
Socio-Economic Inclusiveness And The Size Of Shadow Economy: A Cross-Country Analysis


Abstract
This study aimed at illuminating potential contributors of the shadow economy in a broader perspective. Since, in actual world economic economic units are directly or indirectly influenced by myriad socio-economic, political, legal and other institutional factors. We thus have estimated impact of several inclusive growth measures on the shadow economy. As main factors of interest, the study uses complex factors, including the global competitiveness, prosperity, state fragility, and world economic freedom indices. These variables reflect fiscal, monetary, social, cultural, demographic, legal, and other inclusive aspects of economic development. To analyze empirically effect of indices on the size of underground economy the study includes 140 countries with the time period from 2009 - 2015. We employed Fixed Effects model (FEM) and Random Effects model (REM) to draw general conclusion about correlation and significance of determinants on the shadow economy. The results support our overall hypothesis, reporting strong negative effect of prosperity, the global competitiveness, and economic freedom indices on the size of economic informality. Furthermore, results reveal that the size of the shadow economy increases as country gets more fragile or fails providing well-functioning socioeconomic systems and decent living standards for its citizens.
Keywords: Shadow economy, prosperity, competitiveness, economic freedom, state fragility
Introduction
To date, most scientific researchers have shed light on the causes and consequences of the shadow economy from various perspectives using different theoretical and empirical approaches. In these studies, the focus has mostly on deficiencies of the tax system and tax burden, income level, unfriendly labour market regulations and conditions, education, governance indicators, and other critical factors (Blackburna et al., 2012; Cowell, 1990; Dreher et al., 2009; Schneider & Enste, 2000). However, the hidden virtue of the underground sector causes biases in measurement and identifying potential drivers (Frey & Weck-Hannemann, 1984; Restrepo-Echavarria, 2015; Schneider, 1994), which, in turn, leads to, not only overlooking the core nature of the problem, but also a failure ineffective policy reforms to rein the existing underground sector. Several theoretical pieces of literature found a very small, insignificant, or ambiguous impact of some major contributors to the underground economy. In particular, ambiguities are seen in democracy, taxation inequality perception, quality of public goods, tax burden, and nominal tax rates (Cowell, 1992; Elbahnasawy et al., 2016; Kanniainen et al., 2005). Even more surprising, Ferreira-Tiryaki`s (2008) findings show a negative relationship between greater top marginal tax rates and informality choice (caution: only if such rates increase public good provision), similarly, a study by Johnson et al. (1998a) confirms that countries with higher tax revenues have less concealed economic activities. Such unexpected results occur especially in the study of less developed nations, where even tax burden show ambiguity in sign (Carillo & Pugno, 2004). Thus, the study of the shadow economy should go beyond including only principal causes and analyse more comprehensively in combination with broad societal, demographic, and other unconventional determinants since in reality interactions of observable and unobservable factors go beyond strict theoretical assumptions in explaining responsiveness of citizens to factor effects.
In this paper, we consider several measures of the social, economic, and government policy inclusiveness indices (more specifically, prosperity, the global competitiveness, state fragility, and economic freedom indices) to analyse the synergistic effect of the traditional and untraditional factors of the shadow economy.
Problem Statement
The term of the shadow economy is a broader concept than just tax evasion. It defines a multi-dimensional phenomenon that cannot be explained fully with narrow profit raising behaviour of individuals and economic opportunities created by informal economic institutions. Since notion considers circumventing legal surveillance while conducting both legal and illegal activities (Schneider & Williams, 2013). Furthermore, it deals with buyers, sellers and government officials` behaviours as consumers, producers, and public good providers as well as consumers (Kanniainen et al., 2005; Schneider & Enste, 2013). Consideration of different actor motives provides a different rationale for pursuing gains in the underground economy. It is therefore important because in most literature actors of the shadow economy are seen as rational economic actors whose decisions are driven by conscious profit-maximizing and cost-benefit analysis of illegal conduct (Blackburna et al., 2012; Guillermo & William, 2007; Torgler & Schneider, 2009). In the same vein, Tanzi (1982) describes reasons for “exit”ing formal economy as a response of creative and productive individuals to the regulatory and moral obligatory burden imposed by the government. However, by choosing an informal economy they also understand that their choice deprives them of receiving legal protection, part of public goods, insurance, guarantees for current and retirement period payments from the government; access to the formal financial sectors. Besides, the choice of purchasing in the informal sector provides no protection (consumer satisfaction, health, and safety) and guarantee (consumer rights) against fraud (Kaliberda & Kaufmann, 1996; Williams, 2004). That is why researchers like Cowell (1992) and Culiberg and Bajde (2013) suggest including ethical, social, and psychological variables to study the opportunistic behaviour of individuals. Studies by Round and Williams (2008) and Williams (2004) shed light from different perspective considering socio-spatial variations, and portray informal market participants as social actors rather than rational economic actors who use social networks for redistributive and social reasons (“moral economy” of favours). In addition to societal institutions, Culiberg and Bajde (2013), put forward the importance of including various demographic indicators` influence on the decision-making process of evaders. Alongside the aforementioned variables, several studies show that value orientation, moral reasoning, law enforcement, ethical orientation, social and economic justice, IQ factors also play an influential role (Henderson & Kaplan, 2005; Salahodjaev, 2015; Taylor, 2003; Trivedi et al., 2003).
While some studies focus on behavioural aspects of individuals majority of other researcher pay close attention on macro determinants of the shadow economy development and revealed significant effect of the various structural, socio-economic, political, legal, financial and overall institutional distortions and explain the moral justification of deviant profit-seeking behaviour of individuals as a by-product of poor control of corruption, rule of law, democracy, government effectiveness, regulatory quality, public goods quality, labour market regulations, financial development, fiscal quality, infrastructure, living-standards, income equality (Acosta-Gonzáleza et al., 2014; Berdiev & Saunoris, 2016; Charmes, 2012; Feld & Schneider, 2010; Herwartz et al., 2015; Johnson et al., 1997; Johnson et al., 1998b; Losby et al., 2002; Schneider, 2005; Schneider & Enste, 2000; Startien & Trimonis, 2010; Torgler & Schneider, 2009; Williams, 2004). Such imperfections in government policies create an exclusionary environment for individuals and businesses to obtain critical government benefits which are available for certain groups of population or could be accessed for further extra (bribes) payments (Guillermo & William, 2007). Frustration from such exclusion and inequality of formal sector shapes societal indictment about the capability of government providing inclusive growth opportunities, consequently leads to voluntary exit decisions resulting from private cost-benefit calculations (Hirschman, 1970).
However, in most empirical analysis impact of these external and internal variables has been analysed mainly in ceteris paribus condition (with other things being the same), implying other possible factors` joint effect are ignored. Because factors included in these studies are specific and reflect part of myriad influences an individual may get influenced while deciding producing, supplying, and purchasing informally. So that, finding and investigating indicators built upon complex mixture of factors will provide us with more comprehensive insights into principal drivers of the shadow economy. One of the similar studies by Dell’Anno (2016) on 17 Latin American countries over 1994-2005 provides a significant negative correlation between human development index (which comprises income, education, and life expectancy levels) and the size of the shadow economy, and the overall effect appeared to be greater than taking separately.
Similarly, to get a wider vision about economic liberty circumstances and development of hidden economy, Schneider et al. (2010) and Berdiev et al. (2018) conduct empirical analysis, including overall economic freedom indices and its subcomponents from the Heritage Foundation (2019) and the Fraser Institute (Walter, 1991), respectively. The results of the former study of 162 countries over 1994-2006, presents that for market participants freedom in the sum of all fiscal, business get together with government size are more important than taking any of them individually. As for latter analysis, in which 119 countries` observations from 2000 to 2015 included, economies with a composite of less trade freedom, higher regulatory burden, and inadequate sound money policies together accelerate the “exit” of a greater number of legal entities from the formal economy.
Another notable research work by Arezzo (2014), take social capital index (with sub-dimensions such as social behaviour, social engagement, social relationships, civic responsibility, and territorial characteristics) into the study, and found that besides deterrence measures, there is a significant preventative contribution of social capital compilation to work irregularly in the Italian region. Although these studies to a certain degree explain to what extent various factors jointly determine propensity to operating informally, literature still lacks a deeper study of indicators involving several aspects of the (circumstances) issue. For that reason, we specify several multidimensional indices (or more specifically, the global competitiveness, prosperity, state fragility, and world economic freedom indices) to evaluate the joint effect of society`s political, economic, social, educational bodies and demographic attributes on the size of the shadow economy. Since, we are considering a complex mixture of the development elements our study has a twofold contribution to the literature, due to interested indices included in the analysis. Because included indices, at the same time, reflect both multidimensionality and inclusive growth features.
Research Questions
In this study we investigate empirically to what extent inclusive growth factors effect on the size of shadow economy. Thus, we sort out following dependent and independent variables to formulate research questions.
The size of the shadow economy is used as an explained variable. The data are drawn from Medina and Schneider`s (2018) calculations, estimated employing MIMIC (Multiple Indicator and Multiple Cause) models. The approach enables us to estimate the size of the shadow economy as a percentage share of GDP and its development over time, by considering multiple causal and indicator variables (Schneider & Enste, 2000). The average share of informality as for summary statistics accounts for 28.1 percent for all included 140 countries, while numbers for advanced and developing economies are 15.7 and 32.5 percent, respectively (see Table 1).
The study employs several inclusive growth predictors with the set of major shadow economy determinants as controlling variables, to evaluate how outcomes change with the inclusion of indices from less to more comprehensive one.
We consider the following indices:
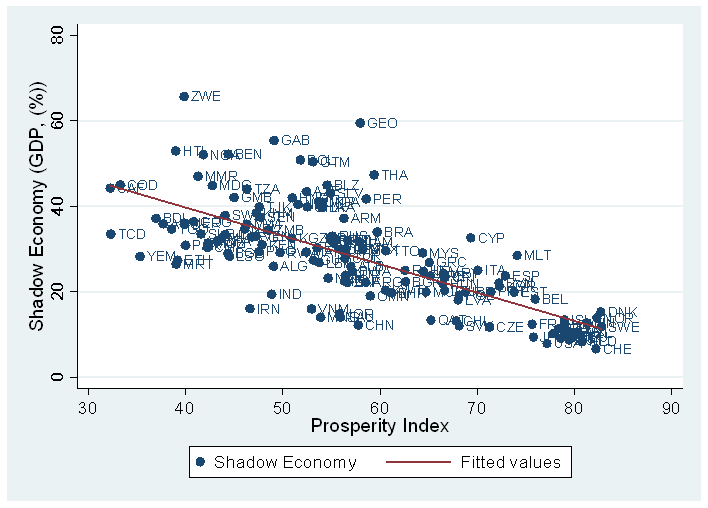
1) Legatum prosperity index (PI) – measures overall prosperity of a nation from 0-100 percent scale (where 0 denotes least and 100 – most prosperous countries), considering nearly 300 key properties of inclusive society indicators, such as economic, societal, political, legal and demographic improvement and equality-based areas. Advanced countries appeared to be on average 3/2 (75.1 versus 51.2 percent) times more prosperous than developing countries (see Table 1).
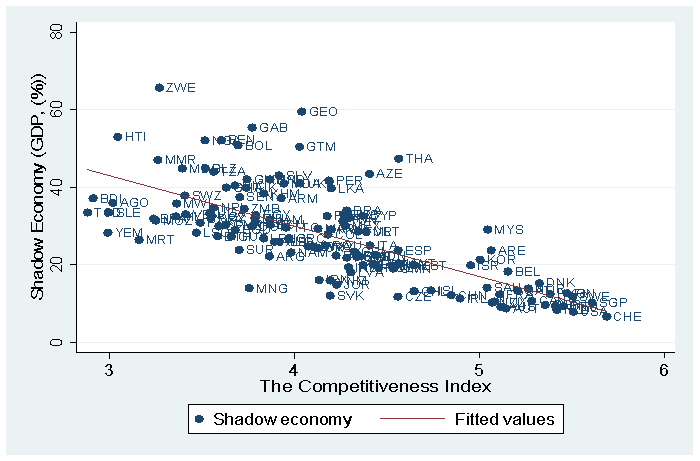
2) The global competitiveness index (GCI) – focuses mainly on competitiveness, equitable resilience, and sustainability of modern economies. The measurement puts weigh on government capability and willingness to ensure a resilient and equal society, inclusive economic growth, and avoiding social fractures through democratic endeavours. According to Table 1, the mean GCI value (ranges from 1 to 7) for developed economies (4.9) is one point higher than emerging economies (3.9).
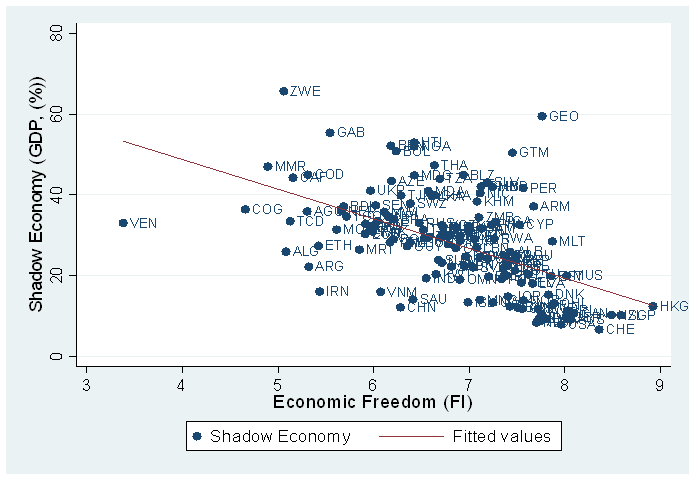
3) Economic freedom index1 (EFIHF) – puts forward the “economically free society” concept as the main attribute of sustainable and inclusive development. The logic behind this concept is associated with the individual`s rationale free choices of investing, producing, and consuming, without being coerced and constrained by the government to a socially acceptable degree (Miller & Kim, 2020). The human development, poverty elimination, greater per capita wealth, democracy, a healthier society, and cleaner environments are the major concerns of the index. The performance of economies is scored on a scale of 0 (low) to 100 (high).
4) Economic freedom index2 (EFIFI) – although this index also follows the same concept to define socio-economic liberty as the previous counterpart, it uses fairly different sub-components to measure the scale (between 1 and 7) of economic freedom. The core hypothesis is that freedom in critical areas of the economy with adequate democracy level allows taking “rent-seeking behaviour” of the political system under scrutiny, thereby constraining government to misuse trusted authority/power and direct them to carry out more holistic, transparent, and socially desirable policies (Walter, 1991).
5) Human development index (HDI) – as a narrower development identifier, reflects the joint effect of PPP adjusted GNI per capita, education, and life expectancy sub-indices, by assigning scores between 0 (low) and 1 (high).
6) Gross domestic product growth (GDPgrowth) – this indicator is our most incomprehensive one and aggregates total domestic production/income or expenditure growth.
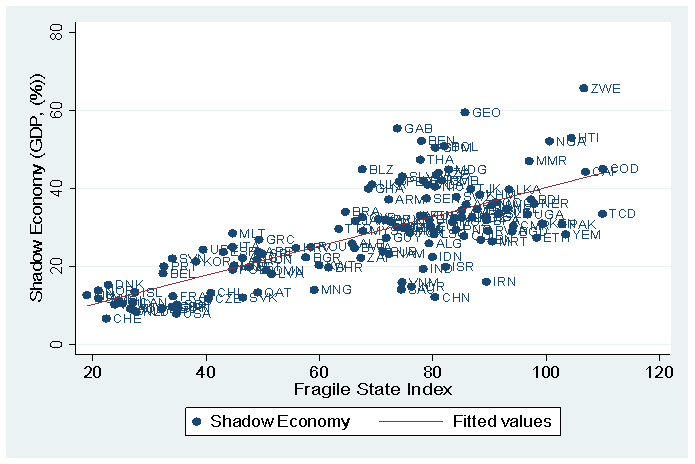
7) Fragile state index (FSI) – this index explores exclusionary and instability stance of an economy, and comprises in itself the cohesion, economic, political and social aspects of state policy. An important facet of fragility measure is the consideration of fractionalized elites, group grievance, brain drain, displacement, and demographic pressures (Fragile States Index, 2017). State rankings range from 0 to 120, a low value meaning better and high worse status quo. The descriptive statistics in Table 1 shows more than twice worse conditions in developing countries (79.0) than in developed ones (35.8).
Bearing in mind the aforementioned theoretical explanation of indices, we formulate following core hypotheses to carry out our empirical estimations:
Hypothesis: – The size of the shadow economy decreases as a government considers more inclusiveness principles in its development path.
In addition to the discussed variables, the analyses involve tax compliance, money growth, fiscal stability, urban population, and unemployment rates as controlling and comparison variables. To check for possible leaner correlation between independent variables we execute multicollinearity and variance inflation factor (VIF) tests (see Table 1), and discover that among Legatum prosperity, fragile state and global competitiveness indices there exist high overlapping. To avoid possible multicollinearity biases, we analyze them separately (Gujarati & Porter, 2009).
Purpose of the Study
This paper attempts to estimate empirically to what extent provided overall circumstance in an economy along with country-specific characteristics simultaneously (give rise to) provoke motives to enter into the underground economy and/or exit from the formal economy in both developing and developed countries. The study includes observations from 140 countries (37 advanced and 103 developing and less developed economies) over 2009-2015.
Research Methods
In the quantitative analysis we utilize an unbalanced sizable longitudinal dataset from 140 countries, over the period 2009 - 2015, due to the availability of data points. The panel data analysis allows us to control for unobserved heterogeneous country-specific and time effects (Hsiao, 2003). Our baseline equation consists of the following properties:
(1)
i = 1, 2, 3,…, N
t = 2009, 2010, …, T
where iscountry`s size of the shadow economy as a percentage of GDP in yearthe denotes intercept, whereasandsymbolize standardized coefficients, thestands for one of the inclusive growth predictors , andrefers to the set of controlling variables. The composite error term is denoted by the .
Due to the short nature (large N and small T) of our unbalanced fixed-panel dataset (Cameron & Trivedi, 2009; Greene, 2008), we follow Gujarati and Porter`s (2009) suggestion to test our basic model (1) employing fixed and random effects model specifications. Besides accounting for cross-border relation between these variables, these models enable us to consider how various inclusive growth aspects within a country may affect the size and development of informality in an economy over time, by treating country-specific heterogeneity differently in the analysis. In the fixed-effects model (FEM), the latent time-invariant country-specific effects (denoted by ) are examined as a part of intercept (2) and assumes this individual (fixed) effects to be correlated with explanatory variables , keeping error variances ( - the remainder disturbance is assumed to be independent and equally distributed, ~ N (0, σ2) and slopes (β, δ) constant.
(2)
While in the random effects model (REM) the ui is treated as a composite error term (ε) component, which allows error variance to be randomly distributed across the country and/or time (3). In contrast, REM assumes no correlation between individual effects and regressors and keeps α, β, and δ constant.
(3)
Findings
Before going to discuss the estimation results of the specified models, we first present scatter plots to have an overall vision to what extent the shadow economy is associated with prosperity, competitiveness, state fragility, and economic freedom. Figure 1, 2, and 3 demonstrate inverse correlations, while Figure 4 shows the opposite relationship for state fragility. According to the graphical illustrations, countries with low economic inclusiveness, contestability, liberty, and high fragility levels (most of which less developed and emerging economies) are appeared to have a greater magnitude of the underground economy.
In regression analysis, we begin by estimating broadly defined inclusive growth index (PI), and step by step go to much narrowly drawn one (GDPgrowth). The inclusion of several similar measures allows us to see variations in results and check for sensitivity, concurrently.
The coefficient of PI for developing countries (-.981) is numerically larger than advanced economies (-.450) and it is statistically significant at a higher level, at the .05 and .01 levels, accordingly. It reveals that the less prosperous economies suffer from a larger magnitude of hidden economic activities. In Eqn. (3) countries are regressed all together, and the results for prosperity level provides also statistically significance level at 1% and the parameter coefficients of β are greater than tax compliance and fiscal stability coefficients, implying improvement just in tax morale and fiscal policies is less efficient to fight against shadow economy than taking these and other socio-economic, political, legal, and demographic factors all together. Economies` competitiveness capability as another inclusive and resilient growth measure, which reflects 111 sub-factors` interaction effect, demonstrate significant (at the .01 level) negative impact on hidden economic activities (Eqn. (4)). Unlike prosperity and competitiveness indices, the state fragility has a positive sign with a standardized coefficient that is statistically significant at .01level. The incapability of governments meeting fundamental needs and expectations of citizens such as providing adequate public goods and economic opportunities leads to underground activities to seize the official economy further (Guillermo & William, 2007). To check fort the sensitivity of our results we introduce two economic freedom variables from the Fraser Institute and Heritage Foundation.
As moderately defined variables (comprise more than 40 sub-indicators) they are examined in Eqn. (7) and Eqn. (8), accordingly, and provide a strong negative correlation at the .1 significance level. They are societal inclusiveness criterion in the essence that economies that are free from arbitrarily property expropriation, corruption, judicial imperfections alongside greater business, trade, investment, labour, financial, and fiscal freedom create a healthy competitive environment through which resources and benefits of economic progress are distributed among all the people fairly (Friedman & Friedman, 1979). Individuals, therefore, feel less burdened with excessive regulations and as a result conduct their activities more openly (Berdiev et al., 2018). The human development index and GDP growth represent our naiver development parameters, and regression outcomes provide a significant negative parameter of interests (Eqn. (10) and Eqn. (11), respectively). As for controlling variables, specified in Eqn. (1) – Eqn. (12), they all confirm theoretically expected signs with conventional significant levels, except money growth where it has an insignificant results. It could be possibly due to the inclusion of broad money measures. In general, the fixed effects model provides solid positive results regarding the relationship between “socio – economic justice” standards in an economy and development of the underground economy. The term “socio – economic justice” is drawn from Smith`s (1990) work on the effect of poor equality policies, citizen rights, poverty reduction policies, duties, taxation policies, public service qualities on overall economic performance and the living.
Although, the fixed effects model provides robust results allowing country – and/or time-specific effects to be correlated with independent variables the model is incapable of estimating time – invariant coefficients (Hsiao, 2007). Furthermore, in the case of finite T, by rising the number of unknown/unobservable parameters through increasing sample observations FEM model may cause incidental parameter problems (Neyman & Scott, 1948).
Conclusion
Majority of studies in determining principal factors of underground economy focus on the critical big fiscal and macroeconomic elements or separately examine social or institutional indicators in ceteris paribus condition, and they hardly consider all together. In real world there are myriad factors an individual takes into account while deriving economic activity away from legal framework. We thus have estimated impact of several inclusive/exclusive growth measures, which comprise complex mixture of fiscal, monetary, social, cultural, demographic, legal, and other institutional aspects of progress. Our empirical analysis involves observations from 140 advanced, developing, and less developed countries over 2009-2015. The results of the static and dynamic panel models report high statistically significant levels for all interested variables. The high prosperity level, synergizing micro to macro socio-economic indicators, reflects the low opportunity cost of running a formal business. Singh et al. (2012) suggest that incapability or unwillingness of the fragile state to provide inclusive institutions discourage more profit-maximizing producers and utility-maximizing consumers to expand formal economy compare to excessive tax rates. In addition, in a freer economy, there is a greater transparent competitive economic activity (Friedman & Friedman, 1979) which allows Pareto optimal distributions of economic growth fruits (Feldman & Serrano, 2006), thereby providing a holistic and credible economic framework to operate productively. In brief, the exclusionary characters of the socio-economic progress shapes moral and economic justification for citizens to “exit” legal boundaries (de Ferranti et al., 2004; Hirschman, 1970) rely on revenue-raising norms of the underground economy even though they consciously truncate themselves from the welfare system. Furthermore, static and dynamic panel analyses reveal that human development and gross domestic product growth along with tax compliance, and fiscal stability are inversely related to the informal economic growth. To conclude, the socio-economic inclusiveness, freedom, competitiveness, and human development are prerequisites for a lower level of the shadow economy. Analysis of critical determinants of the informal economy in a complex environment provides more comprehensive insights about how these factors interact in the real-world situations and jointly formulate ones/economic behaviour.
References
Acosta-Gonzáleza, E., Fernández-Rodrígueza, F., & Sosvilla-Riverob, S. (2014). An empirical examination of the determinants of the shadow economy. Applied Economics Letters, 21(5), 304-307.
Arezzo, M. (2014). Social Capital and Undeclared Work: An Empirical Analysis in Italy from 1998 to 2008. Social Indicators Research, 118(2). 695-709.
Berdiev, A., & Saunoris, W. (2016). Financial development and the shadow economy: A panel VAR analysis. Economic Modelling, 57, 197-207.
Berdiev, A., Saunoris, W., & Schneider, F. (2018). Give Me Liberty, or I Will Produce Underground: Effects of Economic Freedom on the Shadow Economy. Southern Economic Journal, 85(2), 537-562.
Blackburna, K., Boseb, N., & Salvatore, C. (2012). Tax evasion, the underground economy and financial development. Journal of Economic Behavior & Organization, 83(2), 243-253.
Cameron, C., & Trivedi, P. (2009). Microeconometrics Using Stata. Stata Press.
Carillo, M., & Pugno, M. (2004). The underground economy and underdevelopment. Economic Systems, 28, 257-279.
Charmes, J. (2012). The Informal Economy Worldwide: Trends and Characteristics. The Journal of Applied Economic Research, 6(2), 103-132.
Cowell, F. (1992). Tax evasion and inequity. Journal of Economic Psychology, 13(4), 521-543.
Cowell, F. (1990). Cheating the government: The Economics of Evasion. MIT Press.
Culiberg, B., & Bajde, D. (2013). Do you need a receipt? Exploring consumer participation in consumption tax evasion as an ethical dilemma. Journal of Business Ethics.
de Ferranti, D., Perry, G., Ferreira, F., & Walton, M. (2004). Inequality in Latin America and the Caribbean: Breaking with History? World Bank.
Dell’Anno, R. (2016). Analyzing the Determinants of the Shadow Economy With a “Separate Approach”. An Application of the Relationship Between Inequality and the Shadow Economy. World Development, 84, 342-356.
Dreher, A., Kotsogiannis, C., & McCorriston, S. (2009). How do institutions affect corruption and the shadow economy? International Tax and Public Finance, 16(773), 773-796.
Elbahnasawy, N., Ellis, M., & Adom, A. (2016). Political Instability and the Informal Economy. World Development, 85, 31-42.
Feld, L., & Schneider, F. (2010). Survey on the shadow economy and undeclared earnings in OECD countries. German Econ Rev, 11(2), 109-149.
Feldman, A., & Serrano, R. (2006). Welfare economics and social choice theory, (2nd edition). Springer Science, Business media, Inc.
Ferreira-Tiryaki, G. (2008). The informal economy and business cycles. Journal of Applied Economics, 10(1), 91-117.
Fragile States Index. (2017). Fragile States Index 2017. The Fund for Peace.
Frey, B., & Weck-Hannemann, H. (1984). The hidden economy as an ‘unobserved’ variable. European Economic Review, 26(1-2), 33-53.
Friedman, M., & Friedman, R. (1979). Free to Choose: A Personal Statement. Harcourt Brace Jovanovich.
Greene, W. (2008). Econometric Analysis: 6th edition. Upper Saddle River: NJ: Prentice.
Guillermo, E., & William, M. (2007). Informality; Exit and Exclusion. The World Bank.
Gujarati, D., & Porter, D. (2009). Basic Econometrics: Fifth edition. McGraw-Hill/Irwin.
Henderson, B., & Kaplan, S. (2005). An Examination of the Role of Ethics in Tax Compliance Decisions. The Journal of the American Taxation Association, 27(1), 39-72.
Heritage Foundation. (2019). The index of economic freedom. Heritage Foundation.
Herwartz, H., Tafenau, E., & Schneider, F. (2015). One share fits all? Regional variations in the extent of the shadow economy in Europe. Regional Studies, 49(9), 1575-1587.
Hirschman, A. (1970). Exit, Voice, and Loyalty: Responses to Decline in Firms, Organizations, and States. Harvard University Press.
Hsiao, C. (2003). Analysis of Panel Data. (Cambridge 2nd ed). Cambridge University Press.
Hsiao, C. (2007). Panel Data Analysis — Advantages and Challenges. Test, 16, 1-22.
Johnson, S., Kaufmann, D., & Shleifer, A. (1997). The Unofficial Economy in Transition. Brookings Papers on Economic Activity, 2, 159-239.
Johnson, S., Zoido-Lobatonm, P., & Kaufman, D. (1998a). Corruption, Public Finances and the Unofficial Economy. World Bank Policy Research Working Paper Series, 2169.
Johnson, S., Kaufman, D., & Zoido-Lobaton, P. (1998b). Regulatory discretion and the unofficial economy. The American Economic Review, 88, 387-392.
Kaliberda, A., & Kaufmann, D. (1996). Integrating the Unofficial Economy into the Dynamics of Post Socialist Economies: A Framework of Analysis and Evidence. Policy Research Working Paper, 1691.
Kanniainen, V., Pääkkönen, J., & Schneider, F. (2005). Determinants of shadoe economy: Theory and Evidence. Mimio Johannes Kepler University of Linz.
Kanniainen, V., Pääkkönen, J., & Schneider, F. (2004). Fiscal and Ethical Determinants of Shadow Economy: Theory and Evidence. Helsinki Center of Economic Research. Discussion Paper, 30.
Losby, J., Else, J., Kingslow, M., Edgcomb, E., Malm, E., & Kao, V. (2002). Informal economy literature review. The AWashingtion, DC, and ISED Consulting and Research Newark.
Medina, L., & Schneider, F. (2018). Shadow Economies around the World: What did We Learn over the Last 20 Years? IMF Working Papers, African Department: International Monetary Fund. WP/18/17.
Miller, T., & Kim, A. (2020). 2020 Index of Economic Freedom. Washington: The Heritage Foundation.
Neyman, J., & Scott, E. (1948). Consistent estimates based on partially consistent observations. Econometrica, 16, 1-32.
Restrepo -Echavarria, P. (2015). Measuring underground economy can be done, but it is difficult. The Regional Economist, 1, 10-11.
Round, J., & Williams, C. (2008). Everyday tactics and spaces of power: The role of informal economies in post-Soviet Ukraine. Social and Cultural Geography, 9(2), 171-185.
Salahodjaev, R. (2015). Intelligence and shadow Economy: A cross-country empirical assessment. Intelligence, 49, 129-133.
Schneider, F., Buehn, A., & Montenegro, C. (2010). Shadow Economies All over the World: New Estimates for 162 Countries from 1999 to 2007. World Bank Policy Research Working Paper.
Schneider, F., & Enste, D. (2013). The shadow economy: An international survey. Cambridge: Cambridge University Press.
Schneider, F. (1994). Measuring the size and development of the shadow economy: Can the causes be found and the obstacles be overcome? Essays on economic Psychology, 49, 193-212.
Schneider, F. (2005). Shadow economies around the world: what do we really know? European Journal of Political Economy, 21(3), 598-642.
Schneider, F., & Williams, C. (2013). The Shadow Economy. Institute of Economic Affairs. SSRN: https://ssrn.com/abstract=2286334
Schneider, F., & Enste, D. (2000). Shadow economies: size, couses, and consequences. Journal of Economic Literature, 38, 77-114.
Schneider, F., Buehn, A., & Montenegro, C. (2010). New Estimates for the Shadow Economies all over the World. International Economic Journal, 24(4), 443-461.
Singh, A., Jain-Chandra, S., & Mohommad, A. (2012). Inclusive Growth, Institutions, and the Underground Economy. IMF Working Paper.
Smith, L. (1990). Socio-Economic Justice. An Irish Quarterly Review, 79(314), 131-139.
Startien, G., & Trimonis, K. (2010). Causes and consequences of non-observed economy. Economics and Management, 15, 275-280.
Tanzi, V. (1982). The underground economy in the United States and abroad". Ed.Lexington: D.C. Heath.
Taylor, N. (2003). Understanding taxpayer attitudes through understanding taxpayer identities. V. Braithwaite (Ed.), Taxing democracy. Understanding tax avoidance and tax evasion, 15(9), 71-92.
Torgler, B., & Schneider, F. (2009). The impact of tax morale and institutional quality on the shadow economy. Journal of Economic Psychology, 30(2), 228-245.
Trivedi, V., Shehata, M., & Lynn, B. (2003). Impact of Personal and Situational Factors on Taxpayer Compliance: An Experimental Analysis. Journal of Business Ethics, 47(3), 175-197.
Walter, E. (1991). Economic Freedom: Toward a Theory of Measurement. Vancouver: The Fraser Institute.
Williams, C. (2004). Cash-in-hand Work: The Underground Sector and the Hidden Economy of Favours. Palgrave Macmillan.
Copyright information

This work is licensed under a Creative Commons Attribution-NonCommercial-NoDerivatives 4.0 International License.
About this article
Publication Date
25 September 2021
Article Doi
eBook ISBN
978-1-80296-115-7
Publisher
European Publisher
Volume
116
Print ISBN (optional)
-
Edition Number
1st Edition
Pages
1-2895
Subjects
Economics, social trends, sustainability, modern society, behavioural sciences, education
Cite this article as:
Rakhmonov, A. (2021). Socio-Economic Inclusiveness And The Size Of Shadow Economy: A Cross-Country Analysis. In I. V. Kovalev, A. A. Voroshilova, & A. S. Budagov (Eds.), Economic and Social Trends for Sustainability of Modern Society (ICEST-II 2021), vol 116. European Proceedings of Social and Behavioural Sciences (pp. 2491-2503). European Publisher. https://doi.org/10.15405/epsbs.2021.09.02.277