
Cluster Approach For Territorial Development Management


Abstract
The paper is dedicated to the application of cluster approach to manage territory development using artificial intelligence for making rational managerial decisions. The aim set in the paper consists in the necessity to form different approaches to manage regions depending on the region social-economic indexes. 14 parameters were chosen for this, based on which the regions were clustered into 3 groups. For regions from different clusters different approaches for managing them can be applied to reveal weak indexes of the region and make the decision on changing their development strategy and improving their social-economic conditions. To reach the foregoing aim the authors applied the clusterization algorithm: self-organizing maps using analytical platform “Deductor”. The research results are significant and important for the economy as a whole. The Deductor analytical platform has provided complete solutions related to the processing and analysis of structured data. The field of application of the research results is associated with the subsequent formation of proposals and recommendations for the development of organizational, legal, methodological, economic and other measures to manage the development of territories.
Keywords: Clusterization, region, self-organizing maps, neural network, social-economic indexes
Introduction
Currently, social-economic development of a country, including the development of economic sectors, shifts from the application of program- and goal-oriented approach to program-oriented and prognostic approach. The essence of the program-oriented and prognostic approach consists in the forecast development, probable judgment on the condition of some social-economic phenomenon in future. The aim is always a forecast forming a possible certain result. Since it is impossible to use the same approaches for managing an economic entity, the necessity in clusterization arises, i.e. the necessity to combine same-type objects or ones similar in some characteristics into groups (clusters).
Problem Statement
Actually, in general, the cluster approach gains popularity in economy. In recent years, many papers on this subject have been published by Russian authors (Gorochnaya et al., 2020; Ilyasov et al., 2019; Koroleva & Kurnikova, 2020; Kudryavtseva et al., 2020; Perminova et al., 2019; Perova & Papko, 2019; Taranova et al., 2015; Zhelnova, 2012) and by authors from other countries (Haddad & Rahman, 2020; Kumar et al., 2017; Ma et al., 2020; Mishchenko & Mishchenko, 2018) on the necessity to group regions depending on their particularities and differentiate the approaches for managing regions (Baranov et al., 2015). Researchers use modern data mining methods, in particular, self-organizing maps as one of the clusterization methods (Gritsay et al., 2018; Liashenko et al., 2018; Orazi et al., 2020).
Research Questions
In course of the study the following questions were raised:
- What is the role of the cluster approach to regional governance?
- What are Kohonen self-organizing maps?
- What will allow for cluster analysis of data?
Purpose of the Study
In this paper it is proposed to illustrate the application of self-organizing maps for clustering the regions of Volga Federal District of Russia and define the requirements for initial data.
Research Methods
Self-organizing maps can be used to solve such problems as modeling, forecasting, searching for regularities in data bulks, revealing sets of independent features.
A self-organizing map (SOM) is a neural network variety. The algorithm of SOM functioning represents a variant of multidimensional vector clusterization.
This algorithm determines the location of clusters in multidimensional space of factors. The initial data will refer to some cluster depending on the distance to it. Apparently, it is difficult to represent the multidimensional space graphically. The mechanism of SOM development allows depicting the multidimensional space two-dimensionally, which is more convenient for visualizing and interpreting the results by analytics.
The map learning consists in the sequence of correction of vectors being the analogs of neurons of the neural network. At each learning stage, one of the vectors is randomly selected based on the initial data set and then the vector of neuron coefficients, most similar to it, is searched for. Besides, the neuron-winner is selected, the one most similar to the input vector. In this problem under similarity we understand the distance between vectors usually calculated in Cartesian space.
After the neuron-winner is found, the map weights are corrected. Besides, the vector describing the neuron-winner and vectors describing its neighbors in the network are moved in the input vector direction.
The process of self-organizing map development and learning in Deductor Studio system is implemented with the help of analysis tool “Self-organizing map” of the data processing wizard and contains the following stages:
- selection of field mapping;
- adjustment of field normalization;
- adjustment of learning set;
- adjustment of learning parameters;
- adjustment of learning shutoff conditions;
- start of learning process;
- selection of data display method.
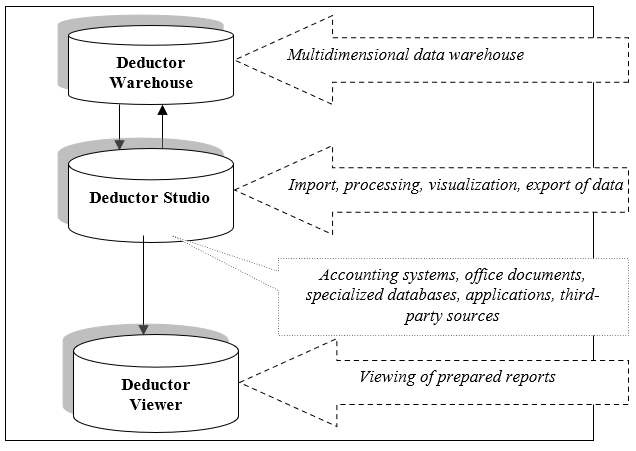
In Deductor analytical platform by BaseGroup Labs the main emphasis is made on self-learning methods and machine learning. Deductor consists of the parts shown in Figure 1.
A self-organizing map (SOM) is a neural network with unsupervised learning, performing the task of visualization and clusterization. With such learning, the learning set consists only of the values of input variables, there is no comparison of neuron inputs with reference values during the learning process.
Kohonen layer comprises some amount (n) of parallely acting linear elements. All of them have a similar number of inputs (m) and get one and the same vector of input signals at their inputs . At the output of linear element we obtain the following signal:
where – weight coefficient of input of neuron,
– threshold coefficient.
After passing through the layer of linear elements, the signals are sent for processing following the rule “the winner takes all”: the maximum output signal is searched for among output signals ; its number:
Finally, the signal with number equals one at the output, the others equal zero. If the maximum is reached for several , then either all corresponding signals are taken as one or only the first in the list (by convention).
Widely spread are Kohonen layers constructed as follows: point is associated for each ( ) neuron in -dimensional space (signal space). For input vector its Euclidian distances are calculated to points and “the nearest takes all” – the neuron, for which this distance is minimal, provides one, the others – zeros. It should be pointed out that to compare the distances it is sufficient to calculate the signal linear function:
The last summand is the same for all neurons, therefore, it is not required to find the nearest point. The problem comes down to search for the number of the maximum value of linear functions:
Thus, the coordinates of point coincide with the linear neuron weights of Kohonen layer (besides, the threshold value of coefficient ).
If points are set, -dimensional space is split into corresponding Voronoi-Dirichlet polyhedrons : polyhedron consists of the points closer to , then to other .
In this case, the learning does not consist in error minimization but in weight tune-up (internal parameters of neural network) for the most coincidence with input data. The obtained map can be used as visualization means for data analysis. As the learning result, SOM classifies input examples into clusters (groups of similar examples) and visually reflect multidimensional input data on the surface of neurons. The SOM neurons are placed in the form of 2D matrix, the matrix is colored depending on the analyzed parameters of neurons. The group of objects marked with red color has the largest values of the index under consideration, and the group marked with blue color – the smallest.
Let us consider the process of complex intellectual data analysis on the example of the analysis of main social-economic indexes of the regions of Volga Federal District (Territorial body of the Federal State Statistics Service for the Udmurt Republic, 2021).
Findings
When analyzing, the following types of statistical data on 14 regions, territories and republics of this federal district were used:
- volume of executed works by the activity type “Construction”, mln rubles;
- commissioning of residential buildings, sq.m. of total area;
- retail turnover, mln rubles;
- volume of paid services for people, taking into account shadow economy, mln rubles;
- total volume of wholesale turnover, mln rubles;
- average monthly salary of personnel, rubles;
- aggregate index of consumer prices for goods and paid services;
- price index of manufacturers of industrial goods;
- salary growth;
- production index by the activity types: “Mining works”, “Manufacturing” and “Production and distribution of electrical power, gas and water”.
Since the regions of Volga Federal District differ rather significantly by the sizes of their territories, the information about the areas of the territories of the regions of this district were also used to obtain more correct analysis results (Areas of the territories of the regions of the Volga Federal District, 2021).
At the same time, the data complex analysis comprised such analysis types as cluster analysis (using self-organizing maps), neural network development (using mode “Neural network” of processing wizard) and decision tree derivation.
The data cluster analysis was carried out using SOM of Deductor Studio system, as a result, three groups of regions with different social-economic indexes were revealed.
Cluster No 0 located in the right area of self-organizing maps (Figure 2) comprised Perm Territory, Kirov Region, Republic of Mari El and Republic of Mordovia. This cluster is characterized by high index of production growth by the activity types: “Mining works”, “Manufacturing” and “Production and distribution of electrical power, gas and water”, but, at the same time, rather low volume of executed works by the activity type “Construction”, rather small retail turnover and high index of price growth of manufacturers of industrial goods.
Perm Territory has the best indexes in the majority of items out of the regions in this cluster; moreover, this territory is one of the leaders in the level of average monthly salary in the whole Volga Federal District. But it should be pointed out that Perm Territory is the largest region of the district (about 160 thsd. sq. km), while Republic of Mari El and Republic of Mordovia have the territories of only 23 thsd. sq. km and 26 thsd. sq. km, respectively.
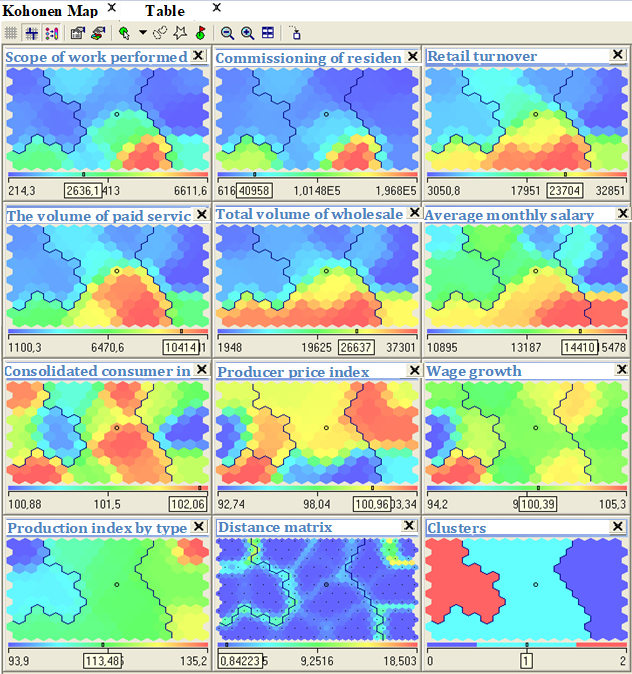
Cluster No 1 located in the central area of self-organizing maps comprised Nizhny Novgorod, Orenburg, Samara and Saratov Regions, Republic of Bashkortostan, Republic of Tatarstan and Chuvash Republic. The majority of the regions of this cluster are the leaders in such indexes as the volume of executed works by the activity type “Construction”, commissioning of residential buildings, retail turnover, volume of paid services for people, taking into account shadow economy, total volume of wholesale turnover and salary growth. But, at the same time, these regions have rather high aggregate growth index of consumer prices for goods and paid services, and high price growth index of manufacturers of industrial goods.
Republic of Tatarstan, Republic of Bashkortostan, Nizhny Novgorod and Samara Regions have the best economic indexes among the regions of this cluster. Chuvash Republic has the worst indexes of executed works by the activity type “Construction”, retail and wholesale turnover. But, at the same time, it should be pointed out that this republic has the smallest territory (in comparison with other regions of the district) – only 18 thsd. sq. km.
Cluster No 2 located in the left area of self-organizing maps comprised Udmurt Republic, Penza and Ulyanovsk Regions. All these regions have small territories – from 37 up to 43 thsd. sq. km. They are characterized by average values of indexes of commissioning of residential buildings and retail turnover, low production growth index by the activity types: “Mining works”, “Manufacturing” and “Production and distribution of electrical power, gas and water”. At the same time, these regions have the salary level average for Volga Federal District, but rather high aggregate growth index of consumer prices for goods and paid services.
Conclusion
The data set containing a number of main social-economic indexes for 14 regions, territories and republics of Volga Federal District was formed based on the open statistical reporting, which can be used for clustering the regions. The data cluster analysis was carried out with the help of analysis tool “Self-organizing map” of the processing wizard of Deductor Studio Academic system, as a result, the groups of regions with different social-economic indexes were revealed.
The methodology obtained can be applied when analyzing social-economic indexes of regions, and can be also used by specialists to make managerial decisions when operating the economic policy in these regions. Splitting into clusters will make it possible to use differentiated approach to manage the regions, reveal weak indexes of the regions and make the decision on changing their development strategy to improve their social-economic conditions.
References
Areas of the territories of the regions of the Volga Federal District. (2021). http://worldgeo.ru/russia/okr_privolg/
Baranov, S., Skufina, T., Samarina, V., & Shatalova, T. (2015). Dynamics of interregional differentiation in Russian regions based on the level of development of information and communication technologies. Mediterranean journal of social sciences, 6(6 S2), 384 - 389.
Gorochnaya, V. V., Mikhaylov, A. S., Mikhaylova, A. A., & Plotnikova, A. P. (2020). Tourism clusters and innovation security: Dialectics in the western border regions of Russia. Geojournal of Tourism and Geosites, 28(1), 127-139.
Gritsay, M., Kulagina, E., Lukina, O., & Proncheva, O. (2018). Key indicators of clusterization potential in regional tourism. GeoJournal of Tourism & Geosites, 22(2), 297-306.
Haddad, K., & Rahman, A. (2020). Regional flood frequency analysis: evaluation of regions in cluster space using support vector regression. Natural Hazards, 102(1), 489-517.
Ilyasov, B. G., Makarova, E. A., Gabdullina, E. R., & Mansurova, M. T. (2019). Algorithms for multiparametric analysis of the state of the multi-industry production complex of regions based on intelligent technologies. Proceedings of the VII All-Russian Scientific Conference Information Technologies of Intellectual Decision Support, 23-28.
Koroleva, E. N., & Kurnikova, M. V. (2020, January). Reasonable Prospects for the Establishment of Local Subregional Tourism and Recreational Clusters in Line with the Specificities of Regional Spatial Development. In First International Volga Region Conference on Economics, Humanities and Sports (FICEHS 2019), 33-37.
Kudryavtseva, T., Skhvediani, A., & Berawi, M. A. (2020). Modeling cluster development using programming methods: case of Russian Arctic regions. Entrepreneurship and Sustainability Issues, 8(1), 150-175.
Kumar, I., Zhalnin, A., Kim, A., & Beaulieu, L. J. (2017). Transportation and logistics cluster competitive advantages in the US regions: A cross-sectional and spatio-temporal analysis. Research in Transportation Economics, 61, 25-36.
Liashenko, O., Kravets, T., & Verhai, T. (2018, May). Estimation of the Production Potential of Ukraine's Regions Using Kohonen Neural Network. In ICTERI, 19-34.
Ma, J., Zhang, R., & Zhu, X. (2020). Cluster Analysis of the Internet Industry Development in Different Regions of China Based on Improved K-means Algorithm. In IEIS2019, 29-39.
Mishchenko, D. A., & Mishchenko, L. O. (2018). Application of cluster analysis to determine the level of the budget potential of the Ukrainian regions. Naukoviy Visnyk Polissya, 2-1(14), 179-185.
Orazi, S., Martinez, L. B., Vigier, H. P., & Guercio, M. B. (2020). A regional Kohonen map of financial inclusion and related macroeconomic variables. Economic Computation & Economic Cybernetics Studies & Research, 54(3), 179-195.
Perminova, O. M., Lobanova, G. A., & Faizullin, R. V. (2019). Raw materials inventory model applied by regional enterprises of the industrial cluster, Acta logistica, 6(2), 35-41.
Perova, V. I., & Papko, A. V. (2019). Neural network analysis of the dynamics of investment activity in the regions of the Russian Federation. Bulletin of the Lobachevsky University of Nizhny Novgorod. Series: Social Sciences, 1(53), 24-32.
Taranova, I. V., Gunko, A. Y. Y., Alekseeva, O. A. E., Bunchikov, O. N., & Kurennaya, V. V. E. (2015). Development of methodical approach on identification of cluster forms of the organization of economy of the traditional and agrarian region. Asian Social Science, 11(14), 95-103.
Territorial body of the Federal State Statistics Service for the Udmurt Republic. (2021). https://udmstat.gks.ru
Zhelnova, K. V. (2012). Development of the public catering management system of the municipality: (dissertation ... Candidate of Economic Sciences: 08.00.05.) Nizhny Novgorod State Engineer-economist.
Copyright information

This work is licensed under a Creative Commons Attribution-NonCommercial-NoDerivatives 4.0 International License.
About this article
Publication Date
25 September 2021
Article Doi
eBook ISBN
978-1-80296-115-7
Publisher
European Publisher
Volume
116
Print ISBN (optional)
-
Edition Number
1st Edition
Pages
1-2895
Subjects
Economics, social trends, sustainability, modern society, behavioural sciences, education
Cite this article as:
Salnikova, K. V., & Faizullin, R. V. (2021). Cluster Approach For Territorial Development Management. In I. V. Kovalev, A. A. Voroshilova, & A. S. Budagov (Eds.), Economic and Social Trends for Sustainability of Modern Society (ICEST-II 2021), vol 116. European Proceedings of Social and Behavioural Sciences (pp. 2053-2060). European Publisher. https://doi.org/10.15405/epsbs.2021.09.02.231