
Analysis Of Dinamics In World Indexes Growth Of Consumer Prices


Abstract
The article is devoted to the analysis of consumer price growth rates in various countries. The combination of indexes into groups was carried out on the basis of the main provisions of the G. Markowitz model. In this work, firstly, the average value (expected return) and standard deviation (risk level) were calculated according to the dynamics of consumer price indices in a number of countries from 2014 to 2017. Secondly, the constructed chart, demonstrating the “Profitability-Risk” relationship, allowed us to identify several subgroups of countries with similar indicators. Thirdly, the article explains the influence of different inflation rates on different groups of objects of economic relations, such as consumers, importers and exporters, as well as the development of recommendations for them based on the information received. The paper shows that it is more profitable for a consumer and an importer to invest in countries with low inflation, while for an exporter it will be more reasonable to conduct its activity in conditions of high inflation. The results of the article contribute to increasing the efficiency of adopted development strategies by the described groups of economic entities.
Keywords: Consumer prices, financial analysis, inflation, Markowitz model, return, risk
Introduction
Inflation as an economic phenomenon has existed for a long time, and consumer price indexes reflect the level of inflation in the best way. Therefore, by calculating inflation indicators for a country or a group of countries, it is possible to determine their economic situation best.
One of the main factors of the macroeconomics that sends signals about the level of its health or existing problems is inflation. Inflation is a process of price increases due to the depreciation of the country's national currency (Labudina, 2013). At the same time, inflation cannot be called a one-time price increase which may be caused by any economic or political reforms. This term implies a constant overall increase in the price level. It is believed that the lower the inflation is, the more stable the country's economy is.
However, it is almost impossible to completely eliminate this phenomenon and fix prices without harm to producers and consumers. In a planned economy, when the state sets the price level, inflation expressed itself as a shortage of goods, since the production plan was determined not by the market and by the demand that it showed, but by the government administration apparatus. Then the manufacturer, being in conditions of unfavorable fixed prices for him, saved to the best of his ability, both in quality and quantity of production, which is why huge queues for empty shelves appeared in stores (Kirsanov, 2014).
On the other hand, a high rate of price growth is expressed in the impossibility for the market to plan the future. Under such conditions, the population and enterprises, if possible, do not invest in the national currency, which leads to its further depreciation, and further to the decline of the economy, further with the possibility of temporary growth in the beginning (Perevyshina, 2016). High inflation rates have a significant impact on low-income groups who cannot quickly adapt to rising prices and the need to further reduce their own costs.
The main way to determine price increases in most countries is through the consumer price index. To determine annual inflation the cost of the consumer basket is calculated — the minimum set of food and non-food products and services that a person needs. Different countries have established a different quantity of goods and the structure of the consumer basket: in Russia, for example, it includes 156 goods and services, in the USA - 300, and in Germany 475 (Shaihatdinov, 2016).
Problem Statement
Having analyzed the data on the growth of the consumer price index in different countries, it is possible to identify trends in the dynamics of the index, see trends in the movement of groups of countries, determine the reasons for the similarities or differences in their indicators, in order to subsequently develop an action plan for various economic entities, based on the dynamics of price growth. In addition, a comparative analysis of consumer price indexes in different countries makes it possible to determine the standard of living in these countries, as well as understand the reasons that led to one or another result.
Research Questions
Based on statistical data, using mathematical models, the authors studied the dynamics of the consumer price index in several countries. The results of the study served as the basis for the development of recommendatory measures for the organization of export-import relations.
Purpose of the Study
The aim of the work is to determine the causes of high / low inflation in the countries under consideration, ranking them according to the “Profitability-Risk” criterion, establishing the most favorable ones that have the most comfortable living conditions, to assess the groups of countries with the most favorable conditions for cooperation for exporters and importers.
To achieve this goal, the following tasks were set: to trace the causes of changes in the consumer price index, both in individual countries and in the identified groups of countries. Then, based on the analysis, to rank the countries in question both by the criterion of expediency of export-import operations with them, and on the quality of life in them.
Research Methods
The “Profitability-Risk” model was used (Gercekovich & Babushkin, 2019) in the work. It is based on the portfolio theory of Harry Markovitz (1952), and supplemented later by William Sharp (2016). The main point of this theory is the assertion that profitability and risk are related. Their ratio affects both the structure of the investment portfolio and its overall profitability. In this work, the average growth in consumer prices is used as the profitability and the corresponding standard deviation is used as the risk. These parameters are used further in constructing the scatterplot diagram, where the average value of profitability is located on the ordinate axis, and the standard deviation (risk) is on the abscissa axis. The diagram constructed in this way demonstrates the state of the economies of individual countries in relation to each other, and also allows you to see any relationships (if any), and, then, based on these relationships, help explain the reasons for the current economic situation.
Findings
Based on statistics for 2014-2017 (Sharp, 2016; Foreign Trade - Economy - South Africa; Gas tariffs for the population in Ukraine from 1.04.2015 to 30.04.2016; Gas tariffs for the population in Ukraine from May 1, 2014 to March 31, (2015); Russian Statistical Yearbook 2016, 2018; USD/RUB – Dollar USA Russian Ruble; USD/UAH – Dollar USA Ukraine Hrivniya) for each country the average value of profitability, standard deviation and the ratio of profitability to risk (Markowitz, 1991) were calculated. The values of expected profitability in the work were taken with the opposite sign, since when constructing a diagram in this case, countries with a more stable economy will be located higher along the ordinate axis, which fully corresponds to the task set in the work, namely, to rank the analyzed countries according to the state of their economies (Table 1).
The last rows of the table contain the extreme values of the considered parameters. From a preliminary analysis of the data presented, it follows that the table simultaneously contains two “champions”: Ukraine and Switzerland. Switzerland can be called a positive champion, based on the maximum in average value and in relation to profitability to risk. At the same time, the expected average profitability is expressed as a positive number. This means that consumer prices in this country do not only rise, but also decline, that is, a deflation process is taking place. Ukraine, on the other hand, demonstrates the leadership both in price increases and in risk level. Its prices are growing on average by 25.8% per year. The minimum (in this case, zero) risk value was demonstrated by China and Australia which means that inflation of these two countries is growing at a constant rate, and for both countries it is 2% per year.
The highest price increase in Ukraine occurred in 2015 and amounted to 49.6%. This can be explained by low productivity that year, an increase in utility tariffs and energy prices (the price of gas, for example, increased from 1.5 hryvnia per cubic meter in 2014 to more than 7 hryvnia per cubic meter in 2015). The depreciation of the national currency also played a large role. Until 2014, the US dollar was no more than one in eight Ukrainian hryvnias, but at the beginning of 2015, the dollar was worth more than twenty hryvnias. All this, coupled with the political crisis and the change of state power in the country, greatly affected the cost of the consumer basket, and its growth was several times greater than all the countries represented (Table 1).
To form a group of leading countries, it is necessary to exclude some of them from further consideration as outsiders. To this end, we will form subgroups of countries that are close to each other in terms of either profitability or risk. The values of the above criteria will be considered close if they differ in absolute value by no more than 0.1%. So, for example, from two countries with similar values of profitability, one that has a larger standard deviation (risk) is excluded. With a minimum difference in risk level, a country with a lower average profitability is excluded from consideration. This is due to the purpose of the study - to identify certain groups of countries in terms of inflation and to identify leaders among them. The formation of a group of leading countries is implemented according to the following algorithm:
All possible pairs of countries are considered in turn (in accordance with the list - Table 1). Then, the first pair of countries with close values of risk level (2.9%) will be Armenia and Kyrgyzstan. Their expected returns are compared. In the considered pair, following the algorithm, it is necessary to exclude Kyrgyzstan from further analysis. Continuing the process of analyzing pairs of countries by the criterion of proximity by risk level, countries such as India, Lithuania, Poland, Great Britain, Italy, France, Japan, Norway and Canada are excluded. The analysis continues until all the “close” pairs are examined (in terms of risk level) (Shvydko, 2018).
After the process of exclusion of countries by risk level is completed, we move on to the next step of the algorithm for the formation of leading countries. Among the remaining countries, the feasibility of excluding from consideration of some of them by the criterion of expected profitability is considered. The assessment is implemented according to the algorithm described above. Then Australia, Hungary, etc. are excluded. In addition to the above, according to the criteria of profitability and risk, Ukraine cannot be considered in conjunction with other countries, since the strong and sudden increase in prices, caused by the political crisis, makes it possible to attribute its emission according to the considered criteria (Gercekovich, 2017). Therefore, Ukraine is excluded from further consideration. The final view of the chart, after exclusion of outsiders, emissions and “duplicate countries” by risk level or by expected profitability, the chart is presented in Figure 1.
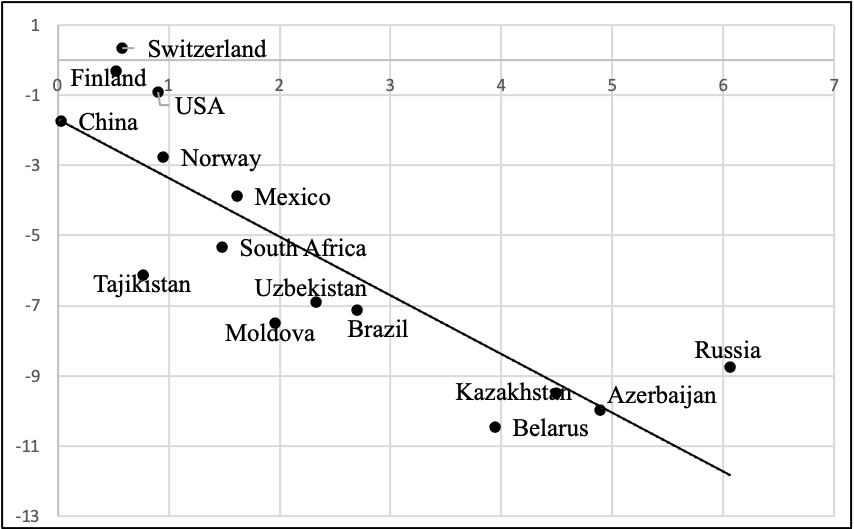
According to the data of the leading countries, the “Profitability-Risk” model was synthesized:
;
where – average value - expected return (%); – standard deviation - risk level; – coefficient of determination. The value of which indicates the acceptable quality of the constructed model. As can be seen from the diagram, some countries can be combined into certain groups that will help draw conclusions about the state of the economies of the countries included in them. The constructed chart allows you to visually see the position of the economies of countries, to conduct a comparative analysis of their inflation relative to other countries.
A group consisting of Russia, Kazakhstan, Azerbaijan and Belarus is highlighted at the bottom right of the graph. These are the countries of the post-Soviet space, their “proximity” in the diagram is explained by their similarity in geographical and historical grounds. The location of these countries in the lower right part of the graph means rather high growth rates of consumer prices, and the volatility of this growth dispersed them along the abscissa axis (according to the level of volatility). The largest growth in the consumer price index in Russia and Belarus occurred in 2015, in Kazakhstan in 2016, and in Azerbaijan in 2017. Thus, one cannot immediately say that the reason for the increase in consumer prices in these countries is unified. However, Russia is the main trading partner of Belarus (39.4% of imports), Azerbaijan (10.2% of imports) and Kazakhstan (17.3%), which closely connects their economies. In turn, speaking of Russia, high inflation in 2015 is largely due to the depreciation of the ruble in the world market, which was caused by Western sanctions. At the same time, Russia introduced counter-sanctions, which negatively affected the economic situation in the country. The increase in prices for imported goods causes the increase in prices for goods in the domestic market. Thus, prices for dairy and meat products, as well as fruits and vegetables, increased most of all, which in Russia makes up a significant share of the consumer basket. Also, in 2015, real cash incomes of the population decreased. As mentioned above, the financial sector did not stand aside and the ruble against the US dollar rose from an average of 32 rubles to more than 65 rubles per dollar.
Such a high level of inflation traditionally has a bad effect both on citizens of the country and on importing companies, since it becomes unprofitable for both parties to conduct economic activity in the state currency. For citizens, this means higher prices for imported goods. In turn, the losses of importing companies are due to the fact that the goods purchased by them at the previous price, in the new import conditions, significantly increase in price when they are converted in national currency, which, of course, leads to a significant decrease in demand.
If we consider this situation from the side of the exporting company, then it is much easier for it to profit from high inflation. The opposite principle works here than with the importer, since, by selling goods abroad at a stable currency price, he (the exporter) will receive a large quantitative benefit in the national currency, which will allow him to further purchase or produce a larger volume of goods, selling them for that same (stable) price.
Further, on the graph, a group of five countries can be distinguished. These are South Africa, Tajikistan, Uzbekistan, Brazil and Moldova. The average inflation rate in these countries is less than that of the above group, but they are all below the trend line. That is, high inflation in these countries is relatively constant and is not a sudden and temporary process. As a reason for combining them into a separate group, we can name the fact that all of the above countries are developing. That is, their economy is not stable enough, and the level of development of its infrastructure is below the level of leading countries-leaders.
It is also noteworthy that the main export items of these countries are ore, metals and other natural resources. For example, in Tajikistan the share of revenues from the export of raw materials (mainly primary aluminum) is 85% (Hasanov, 2012), in Brazil, the main export commodities are ores and mineral fuels, in South Africa these are gold, diamonds, platinum, etc. In general, it can be said that, without a clear development plan, the economies of these countries, while depleting natural resources, will fluctuate “in unison” with the dynamics of world prices.
Based on the diagram, the countries with the most stable economies are Switzerland, Finland, USA, Mexico, Norway and China. These are developed countries that stand out in their own way in economic terms. And, although earlier in this article the negative aspects of high inflation were examined by examples, the low countries also have their problems.
Firstly, low inflation is a bad stimulator of economic growth. It reduces consumption that affects supply and production. And secondly, wages cease to grow, or grow very slowly, which negatively affects the motivation of workers. Thus, Japan, which has fallen into the so-called “deflation trap”, currently uses all the tools available to “accelerate” inflation to at least 2% per year. The population is accustomed to constant stability or even a reduction in the price level, which encourages citizens to save their available funds, rather than letting them back into the economy, which contributes to stagnation of the economy as a whole. Real money supply is growing more slowly, and with it, GDP is doing (Blanshard, 2015).
However, despite these disadvantages, a low level of inflation, if it is planned, is much more favorable than high. Consumers are confident in the future, can have savings, and do not live, being afraid of the lightning-fast depreciation of their money. With a relatively constant increase in consumer prices, citizens remain confident in their own purchasing power, which is why the standard of living in the country is growing. Importers also benefit. If inflation is growing more slowly than that of the country from which the import is carried out, the goods for the importer are actually cheaper, as the currency of this country is cheaper.
At the same time, exporters point on the “other side of the coin”. After all, if they bought or produced goods in their country at a certain price, while incurring certain costs in national currency. Further, when selling it, if we assume that the money of the importing country becomes cheaper, then when converting it into domestic currency, the exporter receives a smaller amount of the national currency. In this case, it is necessary to increase the export price of your product, which may negatively affect consumer demand. Another strategy of the exporting company may be to try to reduce the cost of production, which may affect either the quality of the exported goods or the final profit of the enterprise.
Conclusion
Thus, making a conclusion from the foregoing, we can draw up the most preferred options for action for various groups of economic entities. It is preferable for consumers to keep and invest their savings in the currencies of countries such as Switzerland, Finland, the USA, Norway, Mexico and China. This allows us to assume with great confidence that their money in the near investment horizon will not depreciate. On the contrary, the currencies of countries with high inflation are unfavorable for storing money; these are Russia, Belarus, Kazakhstan and Azerbaijan. The currency of such countries is losing its price relatively quickly. However, with high inflation, the likelihood that inflation will begin to fall also increases, and such investments can become cheaper, with increasing levels of risk. It should be emphasized that, despite the fact that the authors combined Russia, Belarus, Kazakhstan and Azerbaijan into one subgroup, this does not mean that the listed countries are equivalent in terms of profitability to risk ratio (Table 1) (Lenchuk, 2015).
For importers, as well as for consumers, it makes sense to import into countries with low inflation; this reduces the risk of losses and helps to make large profits from international trade. By selling in countries such as Switzerland or Finland, the importer can be sure that the price level will not rise unexpectedly, and the demand for its products or the benefits of the sale will not disappear.
In contrast, exporters benefit from high inflation. Countries located in the middle or lower part of the diagram (for example, Uzbekistan, Moldova or Azerbaijan) are most favorable for it. After all, an enterprise, having produced products at a certain price in its country, sells them (the product) abroad, and when converting the amount received into the currency of the exporting country, it already receives more than the original cost of the goods. That is, a manufacturer seeking to sell goods in another country must also take into account the level of inflation, since it (level) can play both positive and negative effects.
The obtained results contribute to more effective business planning by entrepreneurs having trade relations abroad, as well as more efficient distribution of finances of individuals living or planning to reside in these countries.
In addition, in the future it is planned to continue activities in this direction, add more countries to the list of analyzed ones, expand the data in time (after 2017), and use other analysis methods in addition to those already used.
References
Blanshard, O. (2015). Macroeconomy. Publishing House of the Higher School of Economics
Foreign Trade - Economy - South Africa. Retrieved from: http://www.safrica.ru/uar/economy/exports/
Gas tariffs for the population in Ukraine from 1.04.2015 to 30.04.2016. Retrieved from: https://index.minfin.com.ua/tariff/gas/2015-04-01/
Gas tariffs for the population in Ukraine from May 1, 2014 to March 31, (2015). Retrieved from: https://index.minfin.com.ua/tariff/gas/2014-05-01/
Gercekovich, D. A. (2017). Formation of an Optimal Investment Portfolio for a Complex of Effective Portfolios. Bulletin of Moscow University Ser.: Economics, 5, 86-101.
Gercekovich, D. A., & Babushkin, R. V. (2019). Dynamic Portfolio Analysis of Global Stock Indexes. The World of Economy and Management, 4, 14–30.
Federal Statistics Service (2016). Russian Statistical Yearbook 2016. Retrieved from: https://gks.ru/bgd/regl/b16_13/Main.htm
Federal Statistics Service (2018). Russian Statistical Yearbook 2018. Retrieved from: https://gks.ru/bgd/regl/b18_13/Main.htm
Hasanov, M. (2012). External Debt Situation of Central Asian Countries: Retrospective Comparative Analysis. Central Asia and Caucasus, 2, 169–188.
Kirsanov, R. G. (2014). The State of the Consumer Market in SSSR (the end 1970 – beginning 1990). Bulletin of the Buryat State University. Pedagogy. Philology. Philosophy, 7, 36–41.
Labudina, A. V. (2013). Economy. Saint Petersburg, Piter.
Lenchuk, E. B. (2015). Foreign Economic Dimension of the New Industrialization of Russia. Saint Petersburg, Altheia.
Markovitz, H. M. (1952). Portfolio Selection. Journal of Finance, 7(1), 77–91.
Markowitz, H. M. (1991). Foundations of Portfolio Theory. Journal of Finance, 46(2), 469–477.
Perevyshina, Е. А. (2016). The Impact of Inflation on Economic Growth. Finance and Credit, 9(681), 16–28.
Shaihatdinov, S. Sh. (2016). Social Security Law. Moscow: Yurayt.
Sharp, U. (2016). Investment. INFRA-М.
Shvydko, V. G. (2018). Japan: Current Deflation Experience. Economy and Business: Theory and Practice, 11, 143–149.
USD/RUB – Dollar USA Russian Ruble. Retrieved on 12 August 2020 from: https://ru.investing.com/currencies/usd-rub
USD/UAH – Dollar USA Ukraine Hrivniya. Retrieved on 12 August 2020 from https://ru.investing.com/currencies/usd-uah
Copyright information

This work is licensed under a Creative Commons Attribution-NonCommercial-NoDerivatives 4.0 International License.
About this article
Publication Date
01 July 2021
Article Doi
eBook ISBN
978-1-80296-112-6
Publisher
European Publisher
Volume
113
Print ISBN (optional)
-
Edition Number
1st Edition
Pages
1-944
Subjects
Land economy, land planning, rural development, resource management, real estates, agricultural policies
Cite this article as:
Gercekovich, D. A., Gorbachevskaya, E. U., Chikarenko, S. A., & Shilnikova, I. S. (2021). Analysis Of Dinamics In World Indexes Growth Of Consumer Prices. In D. S. Nardin, O. V. Stepanova, & V. V. Kuznetsova (Eds.), Land Economy and Rural Studies Essentials, vol 113. European Proceedings of Social and Behavioural Sciences (pp. 517-525). European Publisher. https://doi.org/10.15405/epsbs.2021.07.63