Pension Reform And Demographic Processes In The Arctic Regions
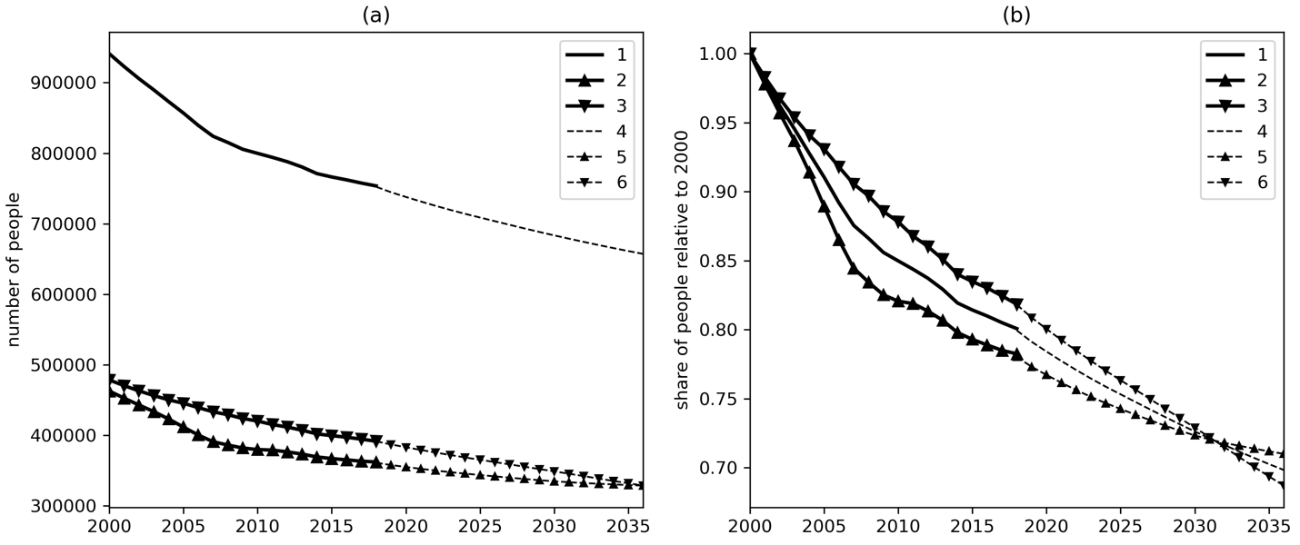
Figure 1: Population of the Murmansk region, 2000-2036 in absolute values (number people), (a) and values relative to 2000 (b). 1-actual data on the population of the Murmansk region for 2000-2019; 2 – actual data on the number men for 2000-2018; 3 – actual data on the number women for 2000-2018; 4-forecast values for 2019-2036; 5 – forecast values for men for 2019-2036; 6 – forecast values for women for 2019-2036. Source: authors ' calculations based on data from the Federal state statistics service of Russia. Date Views 5.09.2020 http://www.gks.ru
< Back to article