
The Migration Attractiveness Factors Of The Russian Far East Region


Abstract
Migration processes induce by the uneven development of regions. The Far Eastern region is Russia's largest by land area and the least populated federal district. Despite its economic indicators' steady growth, one of this territory's most significant problems is its population decline. Several econometric models were used to identify causes and factors influencing this region's migration attractiveness. Modeling results allowed for drawing the following conclusions: the most significant factor is per capita income growth and per capita gross regional product adjusted for climatic conditions. Due to its vast territory and severe climate, the Far East's economic growth centers are cities. Such measures as allocation to Russian nationals of one-hectare land plots at no charge and options to buy new housing at low residential mortgage rates are factors that should have promoted the region's migration attractiveness. It was found that the number of issued loans is decreasing simultaneously with the growth of a mean residential loan size, which indicates a reduction of real incomes of the population and a decrease of potential for accumulation of the first installment sum. Therefore, despite adopted development programs, population outflow will continue. Improving the Far Eastern region's migration attractiveness is an objective that requires the engagement of regional (municipal) authorities, business, and population.
Keywords: Econometric modelmigration attractivenessmigration factors
Introduction
The migration processes are often induced by the uneven development of regions: growing differences in quality of life and wage levels, raising the labor market's disproportions. There are other reasons triggering migration processes such as war conflicts, unfavorable climatic or environmental conditions. As for migration processes in Russia, they are primarily motivated by economic considerations.
Analysis of migration flows in Russian regions of the Far Eastern Federal District
are significantly differentiated in terms of economic development and living standards. The Far Eastern Federal District (FEFD) is the largest federal district in Russia, occupying 40.6% of its total area. However, its population accounts for as little as 5.6% of Russia's total population. At first glance, according to the Federal state statistics service of the Russian Federation all key economic indicators are rather stable in the Far Eastern region and their growth rate exceeds relative values for Russia as a whole.
A comparative dynamic of FEFD key economic indicators in 2019 ( % change over the previous year):
Gross regional product - 119.3;
Industrial production index - 106.2;
Production of minerals - 106.6;
Processing industries - 112.4;
Electric power generation, gas and steam - 104.1;
Foreign trade turnover - 106.1.
In 2019, mean nominal wage was above Russia’s average by 24% and 8.2% higher than in 2018. 1,576 billion rubles of capital investments was sunk in 2019 in FEFD’s economic and social development or 103.3% compared with the preceding year.
The Far East is characterized by three migration flows:
– intra-regional flow, i.e., migration from small towns to largest regional centers and to urban areas from rural areas. Such flows are typical of the Republic of Sakha (Yakutia), Khabarovsk Krai and Chukotka Autonomous District (2011–2016) which is explained by commissioning of new facilities requiring additional workforce;
–inter-regional flow is directed mostly out of FEFD to Russia’s southern, central and northwestern regions. Table
– external migration flow is typical of Khabarovsk Krai, Primorsky Krai and Sakhalin Oblast. A migration surplus was registered in Primorsky Krai in 2010–2012 in connection with large-scale construction projects on the eve of the Asia Pacific Economic Cooperation (APEC) summit.
Population densities in many Far Eastern administrative regions are extremely low (less than 1 person/sq. km in some of them). Although FEFD is of much importance for Russia’s economic development, according to the Russian Federation's Federal state statistics service, it is a region where a significant population outflow has been observed in the last years (Table
A dynamic of incoming and outgoing migration flows is presented below (Figure
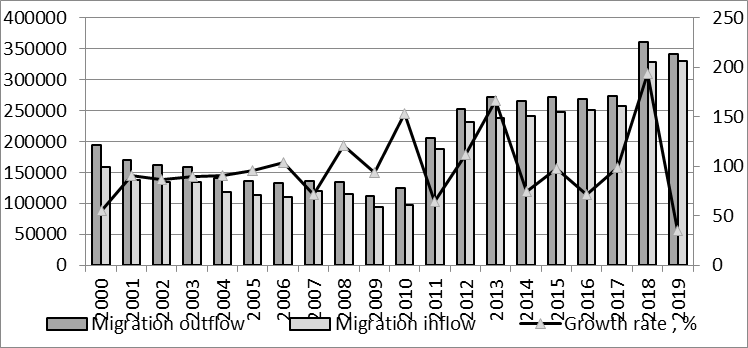
A maximum population migration outflow was observed in 2018 – 361.6 thousand people. Its intensity considerably decreased in 2019 but migration balance remained negative and amounted to -11.7 thousand people. Some analysts (Kiselyov et al., 2018) note that a trend is distinguishing the Far East from Russia's rest federal districts – long-term population decline. Moreover, migration processes should be considered as an indicator of a region's economic development (Motrich & Izotov, 2018).
Literature review of same aspects migration’s factors and modelling
The causes giving rise to migration processes in various countries are in focus of studies. Some authors (Ryazantsev, 2019) point out that China's successful economic development experience proves that the demographic resource can be an additional competitive edge for a country. And U.S. and Canadian experiences shows that deployment of labor resources in comfortable areas and use of temporary mobility forms (back-to-back rotation, temporary labor migration) open up additional opportunities for a region's development. It is stated in a paper by Gerber (2006) that a real wage increase positively affects a net migration flow while an unemployment rate change does not have any significant effects. The following factors driving a population outflow are highlighted in another paper (Ryazantsev & Khramova, 2018): “poverty traps”, i.e., inability to leave one’s region of residence even when willing so because of lack of funds to do so, and another strong pushing factor is regional unemployment rate. Other significant factors may be ethnic and marriage migration (Vorobyeva et al., 2016).
Migration process forecasting requires a review and careful selection of factors for the model. First econometric models were based on the following observation: the scale of migration flows positively correlates with population numbers in communities (or countries or regions) and negatively correlates with the distance between them. In the long run the level of migration growth will depend on a territory's economic development compared with other regions and states and variation of the donor region's children percentage and the strength of ethnic links (Lifshits, 2016). In other studies (Demidova et al., 2018) and (Danilenko et al., 2018), their authors investigate migration attractiveness versus unemployment rate by groups of regions. Another paper (Prokhorov & Epstein, 2016) notes that a high arrival intensity indicating at a territory’s attractiveness may reveal itself simultaneously with a high intensity of population outflows and suggests a special coefficient eliminating the contradicting nature of these two indicators. Another authors (Khavinson & Kulakov, 2017) present in their paper gravitational model-based results for math simulation of a dynamic of structured and interacting populations of a “resource — consumer type”. Another paper (Frisman et al., 2019) presents the key idea and approaches used in current mathematical biology to model a “prey — predator” system with community structure and harvesting. It was found in papers (Sardadvar & Vakulenko, 2017) and (Vakulenko, 2016) that, according to econometric modeling results using panel data, migrant outflows from regions lead to growth and equalization of per capita incomes and equalization of wages.
Problem Statement
Migration attractiveness is defined as a generalized characteristic of a region's promising outlook for potential migrants based on social, economic and climate-geographic factors. It is important for the redistribution of labor resources and population between regions. We provide in a table below FEFD's key
social indicators in addition to its economic indicators according to the Federal state statistics service of the
Russian Federation and Russian News Agency data to understand the reason for this region’s low migration
attractiveness (Table
territories among all Russia’s regions.
The territory of the Far Eastern Federal District is characterized by sharp environmental contrasts casing a broad variance of data in Table
Research Questions
Industrial production growth in FEFD has been 23% since 2013 when the target-specific federal program “Economic and Social Development of the Far East and Baikal Region through 2025” was adopted and launched, while growth in Russia as a whole was 8.3% (Kozlov, 2019). In particular, this program aims to solve one of the region's greatest problems – population decline. It is expected that population inflows will also be driven by development of Rapid Development Areas and Special Economic Zones. To attract people to FEFD and ensure the Far East's social and economic development, the "Far Eastern Hectare" program was launched. It provides for allocation of one-hectare land plots to Russian nationals at no charge in any FEFD's administrative territory. Its key purpose is to attract people to FEFD as permanent residents. Also in process is a governmental residential mortgage program providing benefits for people buying or building homes in the Far Eastern Federal District, which offers residential mortgage loans at rates 4.5 times lower than Russia's average. Why do people still keep leaving this territory?
Purpose of the Study
This study aims to investigate population outflow trends using econometric analysis and identify which specific factors or their combinations influence migration processes in FEFD.
Research Methods
This paper makes use of econometric models described in (Degtyareva, 2018) and (Tikhomirov, 2017).
We suggest using the Holt — Winters adaptive model (Hyndman et al., 2008), a modification of the exponential smoothing method, for short-term forecasting and assessment of population outflows from the Far Eastern region. Its representation in the form of an additive combination of the linear trend with a seasonal component will be taken as a series model.
A Holt ― Winters model-based forecast for p periods in the future is determined by expression (1):
(1),
where
The updating of the coefficients is performed as follows (Formulas 2):
(2),
where αF, αM and αС are parameters of adaptation. Each parameter belongs to [0;1] interval. The closer is a parameter to 1, the larger weighting is assigned to the latest observations. A criterion for parameter selection is minimization of the model’s mean relative error. Initial values
Xt=F0+C0t+εt(3).
In order to forecast population outflows by FEFD administrative regions and address factors influencing migration, we suggest using a fixed effects model that rests on a panel data structure thus allowing for taking account of non-measurable individual differences of objects. The fixed effects model treats each economic unit as “unique” which cannot be treated as a result of random selection from some general assemblage. Such approach is quite justifiable when considering countries or large regions.
Let’s introduce the following denotations:
– numbers of objects;
T – moments of time;
where
The value
We used a combined model looking as (5) to model volumes of residential mortgage loans – this is an additive model of multiple linear regression and time series model for residuals.
Yvif =F1t+F2t+εt= a0+a1x1+…+anxn+ARIMA(p,i,q)+εt (5)
F1
We used the variance inflation factor (VIF) to identify linearly independent factors. This indicator allows for evaluation of variance growth of a given regression rate, occurring due to high correlation of factors. The higher is this indicator for a factor, the stronger is linear relation between it and other factors. This indicator is calculated by formula (6), where is the factor’s determination coefficient j relative to all the rest ones.
(6)
To eliminate multi-collinearity, we excluded factors with too high VIF values from the model. Generally, a critical VIF value is 5; however, this indicator is equal to 10 in some sources. Data are subject to pre-standardization.
An integrated moving average model is applied to residuals of the multiple regression model: F2
whereεt is a stationary time series,
Findings
A source of data for model construction was materials posted on the websites run by the Federal State Statistics Service in 1998–2018.
Migration outflow forecasting
The model (1–2) was used for short-term forecasting and evaluation of the population outflow from the Far Eastern region. The forecasted variable
(8)
The forecasted population outflow from FEFD in 2020 and confidence intervals:
Point Forecast Lo 80 Hi 80 Lo 95 Hi 95
2020 285,674 25,0681.1 320,666.9 232,156.9 339,191.1
The actual outflow in 2019 was 342,106 people by data of the Federal State Statistics Service. The forecasted model-based reduction is 56,432 people (within 17%). We believe that the forecasted migration outflow reduction is related to COVID-19 travel restrictions rather than any expected improvement of the region's migration attractiveness due to the ongoing social and economic development of FEFD.
Identification of migration attractiveness factors
We used a fixed effects panel regression (4) to identify factors influencing the region's migration attractiveness. The region's administrative territories made up the panel for the period of 1997–2017. In this period, FEFD did not include Trans-Baikal Krai and Republic of Buryatia as yet. Values of outgoing migration flows by each administrative territory were considered as a dependent variable. To obtain a significant model, we constructed an artificial variable
The dependent variable
6.3 Modeling of residential mortgage loan volume
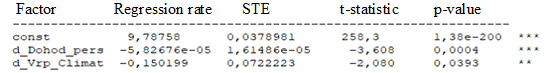
Residential mortgage loan programs may contribute to the improvement of the territory's migration attractiveness. We used a combined model (5) for the simulation of residential mortgage loan volumes. All computations were performed in the R-Studio program. Input data were materials posted on the websites run by Primorsky Krai Office of the Federal State Statistics Service. This administrative region of FEFD was selected because it accounts for 23% of all residential mortgage loans issued in FEFD. An effective indicator is volume of issued residential mortgage loans (Y). Factor features are as follows: X1 – average weighted per cent rate; X2 – subsistence level; X3 – unemployment rate; X4 – mean price of 1 square meter of floor area in the housing market; X5 – per capita monetary income. There is no strong linear relation between factors X1, X3 and X4 and they can be included in the model. The values of variance inflation factors (VIF) and of regression rates are presented in Table
All regression rates are significant in line with the Student criterion and the equation as a whole is significant in line with the Fisher criterion (p-value is 8.65Е-16). The strongest influence on the volume of issued residential mortgage loans is produced by factor X5 – per capita monetary income. Then we computed random component values for our combined model and built an ARIMA model for it.
The time series
(9)
Box — Pierce statistic computations yield values larger than 0.1 which shows that residuals are white noise.
According to our forecast, a quarterly increment of the volume of issued residential mortgage loans will be 124.5 million rubles. At first glance, there are prerequisites for stabilizing the region's population number and migration outflow reduction. But, residential mortgage loan volumes grow against the background of reducing population numbers, which means than local residents enter into residential mortgage deals for buying housing outside the Far East. This is mostly Moscow, St. Petersburg and Krasnodar, i.e., population outflow is ongoing. Simultaneously, the average amount of a residential mortgage loan is growing, thus reducing the volume of monies people can spend on buying a home.
Conclusion
Migration outflow is a systemic problem caused both by economic and social reasons. A high wage level is proportional to high prices for goods and public utilities which make impossible any savings, qualified medical services or education of children, while severe climate hardships are not compensated by personal income of the region’s residents. Taken together with growing mobility of people, all this drives the migration outflow. According to RosStat data, the highest cost-of-living index in 2017 was registered in Petropavlovsk-Kamchatski and Anadyr – 1.58. Comparison with other regions would form an idea of prices in the Far East. For reference, this index is 1.27 in Moscow and 0.99 in Krasnodar. Real disposable personal incomes have dropped to 94.2% since 2015 and the number of people with incomes below subsistence level has accordingly grown. Given high housing prices, an effective behavior pattern for the region’s residents is to sell their rather expensive real estate in the Far East and search for more suitable options in other regions.
A low unemployment rate (4-5%) shows that there is no deficit of jobs because everybody willing to work even for small money is working. Any further population outflow will give rise to a serious workforce deficit. The Interestedness of developers and borrowing of residential mortgage loans by population might help to reduce population outflows from FEFD. In general, residential mortgage crediting is a promising factor of improvement of the region's migration attractiveness. Still, population decline in FEFD requires the solution for economic, ecological, and social problems and cannot be solved only by reducing residential mortgage loan rates. The key factor reducing the region's migration attractiveness is the lack of an infrastructure capable of ensuring migrants' social adaptation willing to join the Far Eastern Hectare program. FEFD administrative regions and municipalities have to cope with a budget deficit and cannot provide financing through local infrastructure projects. A target-specific priority-level governmental program must meet the Far East's demand for all transport services at the federal budget's expense.
A comprehensive approach should be applied to the problem of improving FEFD's migration attractiveness: not only efficient migration policies with a focus on practical rather than theoretical aspects of their implementation but also improvement of the quality of life, major investments in the development of the region's social sphere and infrastructure.
Acknowledgments
This paper has been prepared with support of the Russian Foundation for Fundamental Research. Grant number 19-010-00085 A.
References
- Danilenko, T., Demidova, O., & Signorelli, M. (2018). Unemployment Clubs in Russian Regions. Emerging Markets Finance and Trade, 54(6), 1337-1357.
- Degtyareva, N. (2018). Time series analysis and forecasting models. Chelyabinsk: Cicero.
- Demidova, O., Daddi, P., Medvedeva, E., & Signorelli, M. (2018). Modeling the employment rate in Russia: A spatial-econometric approach. Economy of Region, 14(4), 1383-1398. https://doi.org/10.17059/2018–4–25
- Frisman, E., Kulakov, M., Revutskaya, O., Zhdanova, O., & Neverova, G. (2019). The key approaches and review of current researches on dynamics of structured and interacting populations. Computer Research and Modeling, 11(1), 119–151.
- Gerber, T. (2006). Regional economic performance and net migration rates in Russia, 1993–2002. International Migration Review, 40(3), 661–697.
- Hyndman, R., Koehler, A., Ord, J., & Snyder, R. (2008). Forecasting with Exponential Smoothing. The State Space Approach. Heidelberg: Springer-Verlag.
- Ivashina, N., & Ryabokon, K. (2017). Analiz iskhodyashchikh migratsionnykh potokov iz Primorskogo kraya [Analysis of outgoing migration flows from the Primorsky region]. Cross-border markets of goods and services: problems of research. Proceedings of II International Scientific and Practical Conference, 43–47.
- Khavinson, M. & Kulakov, M. (2017). Gravitational Model of Population Dynamics. Bulletin of the South Ural State University. Series: Mathematical Modelling. Programming and Computer Software, 10, 80-93.
- Kiselyov, N., Gurshalov, P., & Oleinik, E. (2018). Primorsky Region: Economic Growth and Migration Attractiveness Issues, Economics and Law Issues, 7(121), 114-118.
- Kozlov, A. (2019, November 14). O zakonodatel'nom obespechenii operezhayushchego sotsial'no-ekonomicheskogo razvitiya Dal'nego Vostoka i Arktiki [On legislative support to rapid social and economic development of the Far East and Arctic]. https://minvr.gov.ru/press-center/news/23774/?sphrase_id=1449200
- Lifshits, M. (2016). Forecasting of the global migration situation based on the analysis of net migration in the countries. Applied Econometrics, 41, 96-122.
- Motrich, E., & Izotov, D. (2018). Modern Trends and Problems of Migration in a Russian Border Region: The Far East. Studies on Russian Economic Development, 29, 245-251.
- Prokhorov, P., & Epstein, N. (2016). Statistical analysis of the migration situation and factors influencing Russia's demographic expansion. Statistics and Economy, 6, 9-18.
- Ryazantsev, S. (2019). Modern Migration Policy of Russia: Challenges and Approaches to Improvement. Sotsiologicheskie Issledovaniya, 9, 117-126.
- Ryazantsev, S., & Khramova, M. (2018). Factors of emigration from Russia: Regional features. Economy of Region, 14(4), 1298-1311. https://doi.org/10.17059/2018–4–19
- Sardadvar, S., & Vakulenko, E. (2017). A model of interregional migration under the presence of natural resources: theory and evidence from Russia. Annals of Regional Science, 59(2), 535-569.
- Tikhomirov, N. (2017). Methods of econometrics and multidimensional statistical analysis. Moscow: Economy.
- Vakulenko, E. (2016). Econometric analysis of factors of internal migration in Russia. Regional Research of Russia, 6, 344–356.
- Vorobyeva, O., Rybakovsky, L., & Rybakovsky, O. (2016). Migration Policy of Russia: history and modernity. Moscow: Econ-Inform.
Copyright information

This work is licensed under a Creative Commons Attribution-NonCommercial-NoDerivatives 4.0 International License.
About this article
Publication Date
16 April 2021
Article Doi
eBook ISBN
978-1-80296-104-1
Publisher
European Publisher
Volume
105
Print ISBN (optional)
-
Edition Number
1st Edition
Pages
1-1250
Subjects
Sustainable Development, Socio-Economic Systems, Competitiveness, Economy of Region, Human Development
Cite this article as:
Oleinik, E., Zakharova, A., & Yurchenko, E. (2021). The Migration Attractiveness Factors Of The Russian Far East Region. In E. Popov, V. Barkhatov, V. D. Pham, & D. Pletnev (Eds.), Competitiveness and the Development of Socio-Economic Systems, vol 105. European Proceedings of Social and Behavioural Sciences (pp. 663-675). European Publisher. https://doi.org/10.15405/epsbs.2021.04.71