
A Growing Ecological Footprint In The Raw-Materials Export Development Model


Abstract
The development of the modern world economy, which is based on the waste of fossil resources, gradually leads to global environmental, social, and economic problems. Thus, it causes a contradiction between the need to achieve economic growth and preserve the human environment. The export-raw material model is a threat to economic security. A direct demonstration of such a model's failure is a growing ecological footprint of human economic activity, which creates an ecological debt to the planet. Over the last 50 years, the ecological footprint of humanity has increased significantly. This fact indicates a growing imbalance in the relationship between the man and the environment, combined with significant environmental and social changes. The purpose of the research is to study the limitations of the modern export-raw material development model by monitoring the environmental footprint indicator, analyzing the impact of consumption on the environment. As a result of the research, we concluded that the continuous growth of various sectors of the economy's ecological footprint indicates the need to elaborate on a new development model. The model that could allow us to compromise between economic prosperity requirements by constantly increasing the living standards and the need to reduce the environmental burden on the environment.
Keywords: Ecological footprintenvironmental constraints on economic growthenvironmental debt
Introduction
Modern economic development, which tends to the unlimited increase in the production of goods and services, contributes to the anthropogenic degradation of ecosystems through a negative impact on biodiversity, ecosystem integrity, and climate change. The relationship between economic growth and development and environmental degradation was considered in Rachel Carson’s work (1962). Since that time, Economics has increasingly turned to environmental issues. The beginning of the XXI century has convincingly proved the need to maintain the balance of the "man-environment" system for future generations' normal development.
The search for sustainable development indicators has become a constant topic in the literature on environmental sciences, industrial ecology, and environmental management and policy (Van den Bergh & Grazi, 2014). One of the most well-known integrated assessment methods of ecological and economic development is the ecological footprint (EF), which can be used to analyze the relationship between economic development and its impact on the environment. In the early 90-s Mathis Wackernagel and William Rees (1996) from the University of British Columbia proposed this indicator for the first time. Subsequently, the ecological footprint initiated a broader "Footprint Movement", including the carbon, water, land use, nitrogen footprints. Scientists, enterprises, governments, individuals, and institutions in monitoring environmental resources and promoting sustainable development deal with the ecological footprint.
The ecological footprint indicator has become extremely popular in the last decade. It has led to an avalanche of research in this area. For the "ecological footprint" query, Google provides more than 30.4 million results, and Google Scholar provides more than 371,000 articles (August 15, 2020). It is undoubtedly the result of intensive communication activities around the "ecological footprint" concept, carried out by the "Global Footprint Network", supported by the World Wildlife Fund and a long list of national and local environmental organizations, as well as research institutes (www.footprintnetwork.org.). Simultaneously, this concept is criticized in Russia, and environmental aspects do not occupy a sufficiently significant economic policy position. This article aims to demonstrate the insolvency of the development of the export-raw material model in the countries based on studying the ecological footprint of various sectors of the economy.
Problem Statement
The problem of assessing the impact of economic development on the environment is reflected in various scientific papers. One of the founders of Environmental Economics is Karl William Kapp, the author of the book "the Social Cost of Business Enterprises" (1963). The work "The Limits to growth, the report for the Club of Rome" (Meadows et al., 1972) received the wide resonance. In her book Fyuks (2019) notes that notes that "the current crisis...is a transition from an industrial era based on the use of fossil fuels to an ecological mode of production, the contours of which are already discernible" (p. 12). In (Kormishkina et al., 2019), based on analytical calculations, it is shown that an increase in real GDP accompanies the tightening of environmental policy in export-oriented countries. Uddin et al. (2016) reached similar conclusions previously and examined the relationship between income and environmental quality using the Kuznets ecological curve hypothesis by analyzing the time series of 22 countries over the period 1961-2011. The researchers (Beunen & Patterson, 2016; Collins et al., 2020) conclude that at the moment there is no effective compromise between the goals of environmental protection and the pursuit of economic benefits, which confirms the growth of the ecological footprint of humanity, creating an ecological debt to the planet. In 2020, the day when the world economy began to spend the planet's resources "on credit" came on August 22, and because of the coronavirus pandemic, it moved by almost a month. The researchers calculate the "date of environmental debt" from the beginning of 1970. At that time it fell at the end of December. By 1990 it moved to the middle of October, and by the beginning of 2000 – to the beginning of September. Over the last 50 years, almost 190% of humanity's ecological footprint has increased, which indicates a growing imbalance in the relationship between the man and the environment, combined with serious environmental and social changes.
At national level, ecological footprint calculations are currently being made for more than 150 countries, with multiple calculations available for some countries. For example, Wiedmann (2009) used the MRIO method (multi-regional input-output models) to allocate existing UK ecological footprint accounts according to the individual consumption categories. At regional level, Pulselli et al. (2008) showed how various methods, including ecological footprint calculations, can be used to ensure environmental sustainability. In 2014, WWW calculated EF for the regions of the Russian Federation. At local level (city/community) The Stockholm Environment Institute and other experts have identified the ecological footprint of 29 cities in the European part of the Baltic sea. There is a calculated ecological footprint on a smaller scale: for evaluating industry, institution, or product (such as wine), University campus, ecovillage (Carragher & Peters, 2018), and tourism, as well as at the individual and household levels (Collins et al., 2020).
In this regard, an urgent scientific task is to study trends in the changing environmental debt of the economy in order to modernize the economic policy of the state further and form a new model of economic behavior in the direction of ecological and economic compromise.
Research Questions
Is it possible to consider the increasing environmental debt as a manifestation of the export-raw material model's failure? The initial hypothesis that proves the need to transform the traditional natural resource model was formulated earlier (Kormishkina et al., 2018). Its essence lies in the fact that the current economic model does not provide co-evolution of man and nature (which was once again proved by the 2020 pandemic, when the reduction of environmental debt was caused by the global economic crisis and a sharp reduction in production).
Purpose of the Study
The purpose of the research is to study current changing tendencies in the scale of the ecological footprint and give some recommendations on using this indicator in economic science and practice.
Research Methods
The research methodology is based on calculations of the ecological footprint indicator. According to Wackernagel and Rees (1996) classical methodology, the ecological footprint of consumption is calculated as the total area of ecologically productive lands. These are arable land for crop production; pastures and arable land for the production of livestock products and animal feed; water resources for the production of seafood and fishing; forests for the production of wood and other forest products, as well as for the collection of waste; built-up land plots for housing and other urban infrastructure. The lands are necessary for the production of resources and services consumed by the population (from an individual to an entire region or country) and the assimilation of waste.
The main type of waste taken into account in the environmental footprint indicator is CO2 emissions (carbon dioxide) generated by burning fossil fuels. The ecological footprint is measured through the so-called global hectares (GHA) by comparing the direct ecological footprint of consumption (EF) and the biological capacity of the territory (BC). Global hectares are hectares with world average productivity. n other words, 1 GHA represents an equal share of the regenerative capacity of the biosphere approximately 12 billion hectares of the planet are biologically highly productive, therefore, 1 GHA represents one twelve-billionth part of the productivity of this surface. The remaining 39 billion hectares of the Earth's surface are only marginally productive. These are deep oceans, ice fields, deserts; and they are not included in the bio-capacity accounts (Borucke et al., 2013).
Biological capacity is related to a territory's carrying capacity defined for the maximum population of a particular species that a given region can support without irreversible damage to its ecological productivity. Suppose the ecological footprint of a person in a given region is greater than the bio-intensity. In that case, the region has an ecological deficit, which indicates that people's consumption exceeds the territory's ability to provide this level of consumption, i.e., the region's situation is unstable. If a territory's bio-intensity is greater than the ecological footprint, then there is an ecological surplus indicating that human activity in the region is sustainable (Carragher & Peters, 2018).
Findings
Over the last 50 years, almost 190% of humanity's ecological footprint has increased, which indicates a growing imbalance in the relationship between the man and the environment, combined with serious environmental and social changes (Sievers-Glotzbach, & Tschersich, 2019).
According to the Global Footprint Network, sustainable human development will prevail when all people can meet their needs without harming the Earth. To achieve this goal, there are two leading indicators. Firstly, considering the current population and available land area the ecological footprint indicates that the country's resources can be replicated by less than 1.7 GHA per person. Secondly, the human development index (HDI), which measures a country's average achievements in life expectancy, education, and living standards, demonstrates that a value above 0.7 is considered to be a "high level of human development". Thus, these two values represent the minimum conditions for achieving sustainable human development. These two concepts are combined into a single scientifically based measurement picture because sustainable human development means achieving a high standard of living within available resources (Bostan et al., 2017). Our wellbeing is dependent on healthy ecological assets. The increase in the living standards of the world's population, expressed in HDI, which increased from 0.55 in 1990 to 0.7 in 2015, has reduced the cost of environmental assets degradation. Since 1970, the ecological footprint has grown faster than the global bio-capacity, reaching a global bio-capacity deficit of 8339748999 GHA.
One of the most important features of the ecological footprint is that the main reason for "overspending" is the use of fossil fuels (Wackernagel et al., 2019). To illustrate this point, Table
According to table
After two years of growth, the global emissions in 2019 did not change after two years of growth. Their volume amounted to 33 gigatons, despite the world economy increased by 2.9%. This is mainly due to a reduction in emissions in the electricity sector in advanced economies. It became possible because of the increasing role of renewable sources (mainly wind and solar), the transition from coal to natural gas, and an increase in nuclear energy production. Other factors include milder weather conditions in some countries and slower economic growth in some developing markets.
Global CO2 emissions from coal use have decreased by almost 200 million tons, or 1.3% offsetting the increase in emissions from oil and natural gas combustion in comparison with 2018. In advanced economies, emissions fell by more than 370 million tons (or 3.2%), with the electricity sector accounting for 85% of this decline. In 2020, because of the pandemic recession, emissions will decrease even more. As a consequence, the environmental debt will decrease. Nevertheless, this does not mean that environmental problems will disappear or resolve themselves. Although natural capital reserves and flows provide both physical and non-physical environmental services to humanity, the consumption of natural capital reserves often leads to the degradation of natural ecosystems and their functioning. This leads to a number of resource and environmental problems (reduced soil fertility, water pollution and increased water scarcity, climate change and loss of biodiversity) (Wackernagel & Rees, 2019).
In July 2019, experts from the Global Footprint Network presented estimated data on the world's economic footprint for 2019. Data for individual countries are shown in Figure
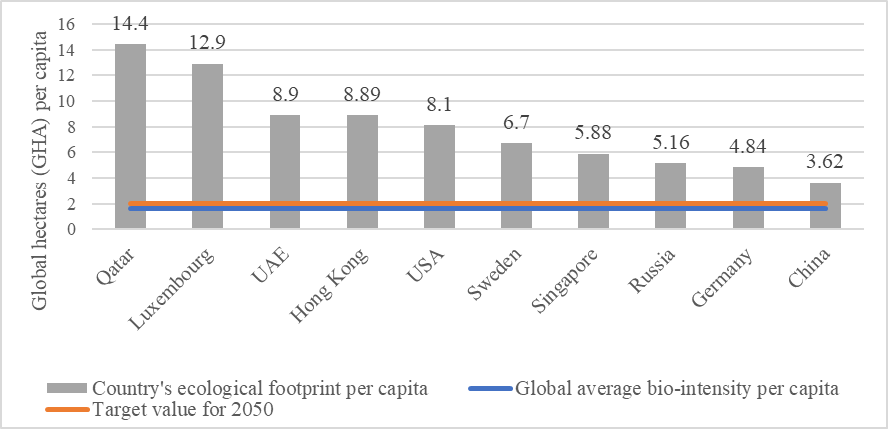
The day of the environmental debt, also determined as "Overshoot Day" is based on the ecological footprint's size. According to Figure 2, it is easy to calculate that if all the Earth people spent as much resources as in Qatar, we would need 8.8 planets like our Earth. The Overshoot Day (the day when the country's residents spent all the resources intended for the whole year) in 2019 in Qatar came on February 11. In Luxembourg, it came on February 16, in the UAE on March 7, in Russia on April 25.
There are significant differences between countries in macroeconomic indicators per capita. While the agricultural footprint per capita exceeds 50% of the same global average indicator in some countries, it corresponds to only 10% of the 2.5 billion people living in India and China. The research works confirm that wealthier societies have a high level of environmental footprint per capita, with a significant portion of their footprint coming from imported goods (Fellner et al., 2017). International trade plays an important role. It allows these societies to use resources outside their internal territory with environmental consequences beyond end-users and policy-making authorities' views. Being responsible for a significant part of environmental degradation, people are not aware of their consumption consequences, as they are hidden in the web of global supply chains. The study of the ecological footprint allows us to show these hidden connections and support sustainability analysis, focusing on staying within planetary boundaries (Mancini et al., 2018).
The next stage is to observe how matters stand in Russia in more detail. As we can see from Table
In addition, WWF-Russia notes that despite the increase in the area of forest cover (including overgrowing of abandoned fields), the number of ecologically valuable primeval forests that were not previously subjected to serious economic impact is decreasing. Similar processes also take place in Brazil, Canada and Indonesia. According to ecologists, the reasons for the loss of intact forests in the Russian Federation are forest fires, deforestation and the creation of forest infrastructure, as well as exploration and mining.
It is worth noting that on September 23, 2019 Russia has become a full member of the Paris Climate Agreement. The decisions of the Paris conference call for urgent assistance to vulnerable and weak countries to adapt to climate change and develop with minimal growth in emissions. Russia has repeatedly stressed its commitment to the principles of the Paris Agreement.
Conclusion
The ecological footprint is essentially the main indicator that measures how much nature we have and how much nature we use. The ecological footprint helps national governments to improve the sustainability and well-being of their populations; local authorities to optimize investment in public projects at the regional and local levels; and individuals to understand their impact on the planet (Syrovátka, 2020).
Sustainable development is a complex cross-sectoral issue and requires the society, from policy-makers to individuals, to co-create sustainable socio-economic alternatives. Scientists worldwide state increasingly that policy- and decision-makers who formulate a sustainable future for human enterprise and facilitate long-term changes in beliefs, social norms, and human behavior should use a systematic approach (Abson et al., 2017; Weinzettel et al., 2019). At the same time, individuals seek to understand the nature and scope of the global environmental challenges that society faces, and what they can do to contribute to a global solution.
Nowadays, humanity's demand for nature, its ecological footprint, is 75% greater than the planet's ability to meet this demand. Currently it takes the Earth one year and nine months to restore what we use for a year. This global "environmental deficit" or "overspending" depletes the natural capital on which human life and biological diversity depend. The consequences of such pressure on the environment are already evident. Destruction of fisheries, loss of forest cover, depletion of freshwater systems, accumulation of CO2 in the atmosphere, and accumulation of waste and pollutants are just a few notable examples. If the situation continues, overspending will permanently reduce the Earth's ecological capacity and lead to environmental collapse and social suffering. While these tendencies affect all of us, they have a disproportionate impact on the poor, who cannot buy off the problem by getting resources from other sources. To reverse this tendency, people and institutions worldwide must recognize the reality of environmental restrictions and start making decisions that meet these restrictions. By scientifically measuring the supply and demand for environmental assets, the ecological footprint (expressed in hectares of land area) provides a resource accounting tool that identifies environmental limits, reports the risk of exceeding, and promotes the sustainable management and conservation of critical environmental assets of the Earth.
Acknowledgments
The reported study was funded by RFBR, project number 20-010-00060.
References
- Abson, D. J., Fischer, J., Leventon, J., Newig, J., Schomerus, T., Vilsmaier, U., Von Wehrden, H., Abernethy, P., Ives, C. D., Jager, N. W., & Lang, D. J. (2017). Leverage points for sustainability transformation. Ambio, 46, 30-39.
- Beunen, R., & Patterson, J. J. (2016). Analysing institutional change in environmental governance: exploring the concept of ‘institutional work.’ Journal of Environmental Planning and Management, 24, 1-18.
- Borucke, M., Moore, D., Cranston, G., Gracey, K., Iha, K., Larson, J., Lazarus, E., Carlos Morales, J., Wackernagel, M., & Galli, A. (2013). Accounting for demand and supply of the biosphere's regenerative capacity: The National Footprint Accounts' underlying methodology and framework. Ecological Indicators, 24, 518-533.
- Bostan, I., Clipa, F., & Clipa, R. I. (2017). Is Romania a Sustainable Developed Country? An Analysis of Ecological Footprint (EF) in Correlation with Human Development Index (HDI). Logos Universality Mentality Education Novelty, Section: Economy and Administrative Sciences, 3(1), 5-14.
- Carragher, V., & Peters, M. (2018). Engaging an ecovillage and measuring its ecological footprint. Local Environment, 23, 1-18.
- Carson, R. (1962). Silent Spring. Houghton Mifflin Company
- Collins, A., Galli, A., Hipwood, T., & Murthy, A., (2020). Living within a One Planet reality: the contribution of personal Footprint calculators. Environmental Research Letters, 15, 1-14.
- Fellner, J., Lederer, J., Scharff, C., & Laner, D. (2017). Present potentials and limitations of a circular economy with respect to primary raw material demand. Journal of Industrial Ecology, 21(3), 494–496.
- Fyuks, R. (2019). Green Revolution: Economic Growth without Compromising the Environment. Moscow: Al’pina non-fikshn Publ.
- Kapp, K.-W. (1963). Social costs of business enterprises. Nottingham, England: Spokesman.
- Kormishkina, L., Kormishkin, E., Gorin, V., & Koloskov, D. (2018). Resource recycling as a key condition for maintaining the growth potential of the economy (a view from the perspective of the neo-industrial paradigm of modern development). Espacios, 39(36).
- Kormishkina, L., Kormishkin, E., Gorin, V., Koloskov, D., & Koroleva, L. (2019). Environmental investment: the most adequate neo-industrial response to the growth dilemma of the economy. Entrepreneurship and Sustainability Issues, 7(2), 929-948.
- Mancini, M. S., Evans, M., Iha, K., Danelutti, C., Galli, A. (2018). Assessing the Ecological Footprint of Ecotourism Packages: A Methodological Proposition. Resources, 7(2), 38.
- Meadows, D. H., Meadows, D. L., Randers, J., & Behrens, W. (1972). The Limits to Growth. New York: Universe Books.
- Pulselli, F., Ciampalini, Fr., Leipert, Ch., & Tiezzi, En. (2008). Integrating Methods for the Environmental Sustainability: The SPIn-Eco Project in the Province of Siena (Italy). Journal of environmental management, 86, 332-341.
- Sievers-Glotzbach, St., & Tschersich, J. (2019). Overcoming the process-structure divide in conceptions of Social-Ecological Transformation: Assessing the transformative character and impact of change processes. Ecological Economics, 164.
- Syrovátka, M. (2020). On sustainability interpretations of the Ecological Footprint. Ecological Economics, 169.
- Uddin, G. A., Alam, K., & Gow, J. (2016). Does Ecological Footprint Impede Economic Growth? An Empirical Analysis Based on the Environmental Kuznets Curve Hypothesis. Australian Economic Papers, 55(3), 301-316.
- Van den Bergh, J. C. J. M., & Grazi, F. (2014). Ecological footprint policy? Land use as an environmental indicator. Journal of Industrial Ecology, 18(1), 10-19.
- Wackernagel, M., & Rees, W. E. (1996). Ecological footprints and appropriated carrying capacity: Measuring the natural capital requirements of the human economy. Focus, 6(1), 45-60.
- Wackernagel, M., & Rees, W. E. (2019). Our Ecological Footprint: Reducing Human Impact on the Earth. Gabriola Island, British Columbia, Canada: New Society Publishers.
- Wackernagel, M., Lin, D., Evans, M., Hanscom, L., & Raven, P. (2019). Defying the Footprint Oracle: Implications of Country Resource Trends. Sustainability, 11, 21-64.
- Weinzettel, J., Vackáru, D., & Medková, H. (2019). Potential net primary production footprint of agriculture: A global trade analysis. Journal of Industrial Ecology, 23, 1133–1142.
- Wiedmann, T. A (2009). Review of recent multi-region input-output models used for consumption-based emission and resource accounting. Ecol. Econ, 69, 211–222.
Copyright information

This work is licensed under a Creative Commons Attribution-NonCommercial-NoDerivatives 4.0 International License.
About this article
Publication Date
16 April 2021
Article Doi
eBook ISBN
978-1-80296-104-1
Publisher
European Publisher
Volume
105
Print ISBN (optional)
-
Edition Number
1st Edition
Pages
1-1250
Subjects
Sustainable Development, Socio-Economic Systems, Competitiveness, Economy of Region, Human Development
Cite this article as:
Kormishkin, E., & Sausheva, O. (2021). A Growing Ecological Footprint In The Raw-Materials Export Development Model. In E. Popov, V. Barkhatov, V. D. Pham, & D. Pletnev (Eds.), Competitiveness and the Development of Socio-Economic Systems, vol 105. European Proceedings of Social and Behavioural Sciences (pp. 552-560). European Publisher. https://doi.org/10.15405/epsbs.2021.04.59