
Digital Inequalities In Russia


Abstract
The penetration of information and communication technologies into all spheres of human life has led to digital inequality both on the inter- and intra-country levels. The article presents the results of a study on the level of digital inequality in the Russian Federation's constituent entities. Coefficients of variation were calculated for indexes that present two groups (the use of information and communication technologies by the population (households) and the use of ICT by organisations), to measure the level of digital inequality in the Russian Federation regions the period 2014-2018. The analysis showed that the Russian Federation subjects are relatively homogeneous in terms of the level of digital technology use, both by the population and organisations. However, there is a significant spread between the regions between the minimum and maximum values of most studied indicators. Further clustering of Russian regions was carried out in terms of studied digital inequality indicators in 2014 and 2018. The level of digital inequality identified five groups of regions. The Russian Federation's movements from one group to another in 2018 compared with 2014 were analysed. The reasons for the transitions were identified. Thus, digital inequality is relevant for Russia and requires certain measures on the part of the state.
Keywords:
Introduction
The modern world trend is the penetration of information and communication technologies in all spheres of life. However, the transformation processes occur unevenly and significantly different in the subjects of the Russian Federation. To assess the level of digitalisation in the regions of Russia, the Moscow School of Management based in Skolkovo calculates the "Digital Russia" index, based on which the assessment of the levels of implementation of digital technologies of the subjects of the Russian Federation is conducted (figure
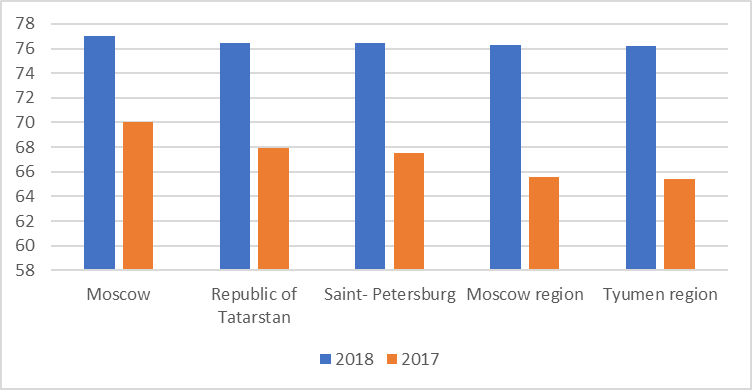
According to the index dynamics in 2017-2018, the level of digitalisation in Russia is growing in all subjects; however, this process is uneven. Moscow leads the rating, with the value of the index 77.03 points in 2018 (in 2017 - 70.01 points). Rating outsider is the Republic of Tyva (in 2018, the index's value - 39.74 points). The gap in the index between regions in 2018 was 1.9 times.
Problem Statement
The digital inequity (digital divide ) has been the subject of research in many countries in recent decades. At the end of the XX century, many countries faced the problem of access to information and communication technologies for various population groups, and therefore, in 1997 the UN Development Program introduced a new dimension of poverty - the information dimension. Over the past decades, approaches to understanding the digital inequality have changed. For example, studies conducted in 2000 considered this phenomenon to be a geographical problem. According to this approach, the level of access and use of ICT by the population depends largely on the country's socio-economic development (Nieminen, 2016; Rainie, 2016; Ragnedda & Kreitem, 2018; Vartanova & Gladkova, 2019). In a later period, research on digital inequality has become interdisciplinary, so that assessment indicators have been supplemented with philosophical, social, economic, political and other components.
A literature review showed that the level of ICT use in different countries depends on gender, age, education level, income level, specific use (personal or professional, etc.) (Alam et al., 2009; Avila, 2009; Nieminen, 2016; Park, 2017; Wessels, 2013).
In Russia, digital inequality problems are addressed mainly in theoretical terms (Bykov & Hall, 2011; Rykov et al., 2017; Volchenko, 2016; Vartanova, 2018). Russian scientists are also investigating factors that affect the level of ICT use: level of education, age, income level, and location (Bykov & Hall, 2011; Brodovskaya & Shumilova, 2013; Volchenko, 2016). A comprehensive analysis of the digital inequality in the context of three levels (Internet access and ICT, availability of digital skills, and social benefits) was conducted in the works of Gladkova et al. (2019).
Research Questions
The issues of digital inequality between regions are insufficiently highlighted. The Russian Federation subjects differ greatly among themselves in the level of socio-economic development, ethnic composition, geographic location, etc., which affects the level of digital economy development in each of them. Therefore, it is of interest to identify the level of differentiation of the Russian Federation regions in terms of the level of digital economy development.
Purpose of the Study
Objective of the study: to measure the level of digital inequality in the RF regions.
Tasks:
- To consider the concept of digital divide;
- To form a set of statistical indicators characterising the level of the digital economy development in the constituent entities of the Russian Federation;
- To identify the degree of differentiation of the subjects of the Russian Federation on the basis of calculation of the coefficient of variation for the main indicators characterising the level of the digital economy development;
- To carry out a clustering of the constituent entities of the Russian Federation in terms of the level of the digital economy development.
Research Methods
The study of the level of differentiation of the Russian regions was carried out using the methods of descriptive statistics, namely, calculation of the coefficient of variation on the basis of the main indicators characterising the level of the digital economy development for 85 subjects of the Russian Federation from 2014 to 2018 (except for the Republic of Crimea and Sevastopol in 2014). Coefficient of variation characterises the homogeneity of the population. In this case, the statistical aggregate is considered homogeneous if the Coefficient of Variation does not exceed 33%.
The following methods were also used: analysis, synthesis, comparison, generalisation.
The study of digital inequality was conducted on two enlarged groups of indicators:
- the use of information and communication technologies by the population (households);
- the use of ICT by organisations.
Open data from the Federal State Statistics Service was used for the analysis.
Further, on the basis of cluster analysis, typologisation of the subjects of the Russian Federation by the level of digital development was carried out.
Since the number of observations and the number of variables in our study is quite large, the most acceptable method of clustering is the k-average method.
Clustering results may be meaningless if the features used have different units of measurement. Therefore, before the clustering of Russian regions in terms of digitisation indicators, the source data were rationed to a single scale by dividing the centred value by the square average deviation.
The main distinguishing feature of the k-average method is the need to determine the optimal number of groups at the initial stage of the study. The solution of this problem depends on the objectives of the study and the specifics of the phenomenon under study, but there are several universal principles. The formation of excessively small number of groups will not allow to reflect distribution patterns, and the formation of excessively large number of groups will make it difficult to interpret the results obtained due to blurring of existing trends.
It was decided experimentally that the optimal number would be 5 groups, taking into account the number of observations and variables used.
Findings
Let us analyse the level of ICT use by households. The following were selected as the indexes (table
- Share of households with broadband Internet access, %;
- Share of the population using the Internet for state and municipal services, %;
- Share of the population using Internet for ordering goods and services, %;
- Population using the Internet (according to the sample population survey on ICT use; as a percentage of the total population of the respective constituent entity of the Russian Federation), %.
In terms of the share of households with access to the Internet, the subjects of the Russian Federation were almost homogeneous throughout the entire period of the study. In 2014, the minimum value of the index - 26% was observed in Chukotka Autonomous District, the maximum - 87% in Yamalo-Nenets Autonomous District. In 2018, the minimum value of the index increased almost twice and amounted to 50.2% (in the Chechen Republic), the maximum value rose by 91% to 96.3% (Yamalo-Nenets Autonomous District).
Note that in the share of the population using the Internet to receive state and municipal services in 2014-2015 there was a significant differentiation between the regions of the Russian Federation, which gradually decreased and by 2018 the subjects of the Russian Federation had become practically homogeneous in this index. In 2014, the minimum value was observed in the Republic of Dagestan - 1.8% of the population used the Internet to receive state and municipal services, the maximum - 66.3% in the Yamalo-Nenets Autonomous District In 2018, the minimum value increased more than 20 times and amounted to 38.6% (Chukotka Autonomous District), the maximum value was 95.3% in Yamalo-Nenets Autonomous District.
Significant differentiation between the Russian Federation's constituent entities in 2014 was also recorded by the share of the population using the Internet for ordering goods and services. The index's minimum value - 5.8% was noted in the Republic of Dagestan, the maximum - 36.2% in Moscow. By 2018, the coefficient of variation was steadily declining, indicating a convergence of the Russian Federation's subjects on this index.
By the share of population using the Internet, the subjects of the Russian Federation are almost homogeneous. In 2018, the index's minimum value was recorded in Mari El - 71.1%, the maximum - 98.4% in the YNAD.
Thus, a decrease in differentiation between the Russian Federation subjects is observed for all the studied indexes. Simultaneously, the leader in the use of ICT by the population during the whole period of the study is Yamalo-Nenets Autonomous District, and the outsider is the Republic of Dagestan.
Similarly, let us analyse the level of ICT usage by organisations. The following indexes were chosen (table
- number of personal computers per 100 employees, pcs;
- the share of organisations that have a website in the total number of surveyed organisations, in %;
- the share of organisations using Internet access at a speed of at least 2 Mbps, in the total number of organisations, in %;
- share of companies that use the Internet to place orders for goods (work, services), in % of the total number of companies surveyed;
-share of organisations that used electronic data exchange, %.
In terms of the studied indexes of ICT use by organisations, the regions of the Russian Federation are almost homogeneous (the coefficient of variation is less than 33%). At the same time, by 2018, compared to 2014, the coefficients of variation noticeably decreased. Nevertheless, in terms of regions there is a significant difference between the maximum and minimum values of the analysed indexes. Thus, by the number of personal computers per 100 employees in 2018 the minimum value - 31, was recorded in Kabardino-Balkarian Republic, the maximum - 78 in Moscow. In 2014, the minimum value of the "Share of organisations using Internet access at a speed of at least 2 Mbps, in the total number of organisations, %"index was observed in the Chechen Republic - 3.8%, the maximum in Moscow - 86.7%. In 2018 the gap between the subjects of the Russian Federation has significantly narrowed. The minimum value of the index was 25.3% (Chukotka Autonomous District), the maximum - 88.3% in Moscow. By the share of organisations that use the Internet to place goods and services, the gap between regions has decreased. However, the reduction was due to a decrease in the maximum value of the index from 58.3% (Moscow) in 2014 to 51.4% in 2018 (Belgorod region).
The analysis showed that the subjects of the Russian Federation are quite homogeneous in terms of the level of use of digital technologies, both by the population and organisations. Nevertheless, there is a significant spread between regions between the minimum and maximum values of most of the studied indexes. The leading regions in terms of the level of development of the digital economy are Moscow, Yamalo-Nenets Autonomous District, as well as regions-outsiders - Chechen Republic, Republic of Dagestan and others. Thus, we can talk about the presence of digital inequality among the subjects of the Russian Federation.
For more detailed analysis, we will cluster the subjects of the Russian Federation according to the above-mentioned indexes.
The results of clustering are presented in table
The highest digitalisation level in 2014 and 2018 was observed in the regions included in Cluster I and II (table
Let us highlight the subjects that showed the highest growth rates in terms of digitalisation and moved from cluster II to cluster I - Leningrad region, Republic of Tatarstan, Yaroslavl and Novgorod regions. Also, due to the positive trend in changes in many indexes Belgorod, Kaluga, Lipetsk, Rostov regions moved from III cluster to I cluster.
At the same time, Khanty-Mansiysk Autonomous District, Yamalo-Nenets Autonomous District on the contrary left the I cluster and by the results of 2018 became part of the III cluster, to which in turn the Republic of Bashkortostan and Tula region moved from the II cluster. At the same time, it should be noted that the reasons for the relocation of the regions are different. Khanty-Mansiysk and Yamal-Nenets Districts moved primarily because of an imbalance in the level of use of digital technologies by households and organisations. While the use of information and communication technologies by the population (households) is significantly higher than the average Russian level, the use of ICT by organisations lags far behind that of other entities.
In the Republic of Bashkortostan, despite some "success" in digitalisation, in general, in 2018 vs. 2014 most indicators showed lower dynamics as compared to other regions of the Russian Federation, which is the reason for moving to the III cluster of regions with an average level of digital technology development.
In the IV and V clusters during the analysed period there were 2/3 subjects of the North Caucasian Federal District (Republic of Dagestan, Republic of Ingushetia, Republic of North Ossetia-Alania, Chechen Republic, etc.), the Far Eastern Federal District (Republic of Buryatia, Republic of Sakha (Yakutia), Transbaikal Territory, Amur Region, Magadan Region, Jewish Autonomous Region, Chukotka Autonomous Region), as well as the subjects of the Siberian Federal District (Republic of Tyva, Altai Territory, Kemerovo and Irkutsk Regions), primarily because of the low level of socio-economic development of these regions, which creates obstacles for the implementation of digital technologies.
Conclusion
The analysis showed that the problem of digital inequality is relevant for our country. Although the Russian Federation subjects are reasonably homogeneous in terms of the leading indicators of ICT use by the population and organizations, there is a significant gap between the minimum and maximum indexes' values. The leading regions in terms of digital development (Moscow, Yamalo-Nenets Autonomous District, Khanty-Mansiysk Autonomous District) and outsiders (Chechen Republic, Republic of Dagestan) are visible. It should be noted that the degree of development and implementation of digital technologies is mainly due to the general level of socio-economic development of the territory.
In order to overcome the problem of digital inequality, it is necessary to create digital infrastructure throughout the country, to raise the level of digital literacy and culture of the population, including the development of mechanisms of "digital assistance" for socially vulnerable groups (pensioners, migrants, disabled people).
Acknowledgments
The reported study was funded by RFBR and Republic of Bashkortostan, project number 19-410-020002.
References
- Alam, S. S., Abdullah, Z., & Ahsan, N. (2009). Cyber café usage in Malaysia: An exploratory study. Journal of Internet Banking and Commerce, 14(1), 1-13.
- Avila, A. (2009). Underdeveloped ICT areas in Sub-Saharan Africa. Informatica Economica, 13(2),136-146.
- Brodovskaya, E. V., & Shumilova, O. Е. (2013). Russian users and non-users: correlation and main features. Public opinion monitoring: Economic and social changes, 3(115), 5–18.
- Bykov, I. A., & Hall, T. E. (2011). Tsifrovoye neravenstvo i politicheskiye predpochteniya pol'zovateley Interneta v Rossii [Digital inequality and political preferences of the Internet users in Russia]. Polis. Political Studies, 5, 151–163.
- Gladkova, А. A., Garifullin, V. Z., & Ragnedda, M. (2019). The model of three levels of digital inequality: current opportunities and limitations: by the example of research of the Republic of Tatarstan. Bulletin of Moscow University, 4, 41-72.
- Nieminen, H. (2016). Digital divide and beyond: What do we know of information and communications technology’s long-term social effects? Some uncomfortable questions. European Journal of Communication, 31(1), 19–32.
- Park, S. (2017). Digital capital. London, United Kingdom: Palgrave Macmillan.
- Ragnedda, M., & Kreitem, H. (2018). The three levels of digital divide in East EU countries. World of Media. Journal of Russian Media and Journalism Studies, 4, 5-27.
- Rainie, L. (2016). The digital divide 2016. Washington, D.C.: Pew Research Center. https://www.pewinternet.org/2016/07/14/digital-divides-2016/
- Rykov, Y., Nagornyy, O., & Koltsova, O. (2017). Digital inequality in Russia through the use of a social network site: A cross-regional comparison. Communications in Computer and Information Science, 745, 70–83.
- Vartanova, E., & Gladkova, A. (2019). New forms of the digital divide. In J. Trappel (Ed.), Digital Media Inequalities: Policies against Divides, Distrust and Discrimination (pp. 193-213). Gothenburg: Nordicom
- Vartanova, E. L. (2018). Kontseptualizatsiya tsifrovogo neravenstva: osnovnyye etapy [Conceptualization of digital inequality: the main stages]. MediaAlmanakh, 5, 8–12. https://doi.org/10.30547/mediaalmanah. 5.2018.812
- Volchenko, O. V. (2016). The dynamics of digital inequality in Russia. Monitoring of public opinion: economic and social change, 5, 163–182.
- Wessels, B. (2013). The reproduction and reconfiguration of inequality: Differentiation and class, status, and power in the dynamics of the digital divide. In M. Ragnedda, G. W. Muschert (Eds.), The digital divide: The internet and social inequality in an international perspective (pp. 17–28). New York, NY: Routledg.
Copyright information

This work is licensed under a Creative Commons Attribution-NonCommercial-NoDerivatives 4.0 International License.
About this article
Publication Date
16 April 2021
Article Doi
eBook ISBN
978-1-80296-104-1
Publisher
European Publisher
Volume
105
Print ISBN (optional)
-
Edition Number
1st Edition
Pages
1-1250
Subjects
Sustainable Development, Socio-Economic Systems, Competitiveness, Economy of Region, Human Development
Cite this article as:
Mamleeva, E., Sazykina, M., & Trofimova, N. (2021). Digital Inequalities In Russia. In E. Popov, V. Barkhatov, V. D. Pham, & D. Pletnev (Eds.), Competitiveness and the Development of Socio-Economic Systems, vol 105. European Proceedings of Social and Behavioural Sciences (pp. 395-406). European Publisher. https://doi.org/10.15405/epsbs.2021.04.44