European Proceedings Logo

National Economic Security Diagnostics

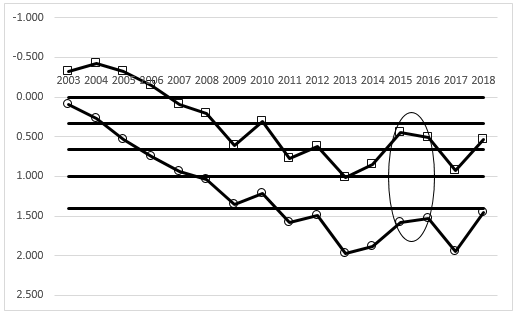
Figure 2: Temporary trends of the interacting indicators “Depreciation rate of fixed assets” – “Ratio of the export production of the territory to the GRP”. Pseudo-security areas are marked with ovals in the graph

 Temporary trends of the interacting indicators “Depreciation rate of fixed assets” –
       “Ratio of the export production of the territory to the GRP”. Pseudo-security areas are
       marked with ovals in the graph
< Back to article