
Econometric Modeling Of The Impact Of Microenvironment On The Level Of Production


Abstract
This article discusses the main indicators that contribute to the development of an econometric model suitable for the refining industry. A model based on the relationship between production results, labour resources and capital is modelled. A non-linear function with two factors is obtained: innovative fixed assets and investments in non-current assets, which puts the importance of innovation in the business process at the forefront. The model was tested for adequacy and statistical significance by replacing indicators with different values, which proves its compliance with the requirements and adaptation to current trends and tendencies. The analysis allows companies to apply this model to increase the selected indicators and increase labour productivity. Also analysed are the macroeconomic indicators that characterize the development environment of the oil refining industry. The necessity of using innovations at enterprises to increase the efficiency of their activities from the point of view of econometric accounting and statistics has been proved. A detailed study was carried out to model the optimal model using the production function. The influence of innovation on output is shown due to the specification of classical factors of production through the transition from factors of a higher order to less. The transformation of econometric research in the direction of modelling the production process is described.
Keywords: Capitalinnovationmacroeconomic environmentmodelingproduction
Introduction
The success of proving any hypothesis in economics depends entirely on the availability of statistical information. The use of a number of official sources helps to identify patterns and main trends for theoretical proof of the significance of the developed models. Theory and practice show that there is a huge relationship between the result of production, expressed in the company's revenue, the volume of finished products or profits, and the elements of the production process: capital (fixed assets and material costs) and living labour. Although in recent years, due to the penetration of digital technologies into all spheres, more and more economists point to the need to take into account the "labour" of IT objects (automata, robots, artificial intelligence, etc.), but until now, the methods of accounting for this factor production is not developed. The production function is intended to reflect the relationship between the effect (product) and causes (resources) from the quantitative point of view, to the study of which the activity will be directed. The creation of a model taking into account the linear growth of the values of independent variables will increase the gross revenue of the enterprise, hence the importance and relevance of the development of an optimal econometric model, which contributes to the growth of the company's revenue, enhances its competitiveness and makes it possible to assess the degree of equipment of the enterprise with innovative developments and the scale of investments in innovation. Therefore, economics closely borders on research in the field of economics - statistical models, which become the basis for analytics of the current state of the company and forecasts for the next few years, taking into account the obvious dynamics of indicators.
Problem Statement
It is believed that the theory of production functions began its development with the work of Douglas and Cobb "Theory of production" (1928) (Cobb & Douglas, 1928), where in their article the researchers proved the existence of a connection between the output and the cost of resources (labor and capital) of industrial enterprises in the United States by constructing a multiple power regression equation. Of course, theoretical and empirical work in the direction of modeling the production process has been undertaken earlier. So, at the end of the XIX century. Walker (2007) formulated the theory of general economic equilibrium, which was mathematically substantiated only in the XX century. Further development of mathematics and software has made it possible to significantly expand the range of models related to production functions. So, in the future, under the production function, an economic and mathematical model is considered that reflects the influence of production factors (resources) on the output of products (goods, services) in physical or value terms. From a mathematical point of view, the production function can be described by the following relationship:
where: y - output of products in kind or in value form;
𝒙𝟏, 𝒙𝟐,… 𝒙𝒎 - types of resources used in production.
In the monograph by Smagina (2018) identifies a number of properties of the class of models related to production functions (Figure
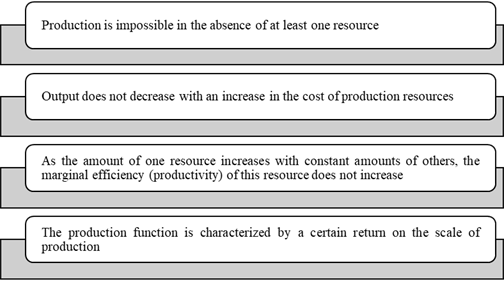
The revealed properties impose a number of restrictions on the application of production functions in the practice of economic analysis, statistics and econometrics, nevertheless, the field of application of the type of functions under consideration is significant, over the years of theoretical development and practical application, a large number of models have been created and formulated that make it possible to describe almost all production options as micro- and macro-level (Antipina, 2019). Table
As shown in Table
determination of the volume of output at pre-fixed values of the indicators of basic resources;
determination of the volume of output in the case of resource values that significantly differ from all observed in the past;
determination of the volume of output at the values of indicators of resources belonging to a given continuous area;
determination of the impact on the output of small independent changes in the size of one or more resources;
determination of the characteristics of the production process, expressed through the parameters of the production function (Kleiner, 2016).
If we turn to the field of application of the considered class of models in economic research, then it can be noted that production functions are used everywhere both at the macro level and at the micro level. In the first case, the object of study is the country (less often the industry), in the second, a specific enterprise (less often a group of similar enterprises). The production function at the lower level is built to assess the growth reserve of output, which is achieved through simulation, i.e. setting the modes of independent variables (factors of production) at which the maximum volume of output (works, services) is achieved. Accordingly, an econometric model in the form of a production function at the macroeconomic level is built in order to analyze and predict the efficiency of the functioning of the national economy of the country (industry) (Akberdina & Volodin, 2020).
Turning to the scientific literature on the construction of production functions, there are no clear guidelines on the set of variables involved in modeling. Obviously, the choice of one or another indicator for building a model depends on the information available, the objectives of the analysis and the scale of the studied objects. If such an object is a country (macrolevel), then output is identical to GDP (GNI), and resources are human and reproducible capital, and they must be measured in value terms in view of a variety of diverse activities (Gilli et al., 2019).
At the micro level, classical factors are mainly used, these are labor costs in the form of a wages fund (wages of workers) and capital, which are reflected in fixed assets, respectively, the output variable is the output of products (works, services). The conclusion is that the production functions currently used in economic research are rather archaic and include only two factors of production. But the development of the economy, widespread digitalization and the transition to the sixth technological order pose the task of revising the set of factors and expanding it towards taking into account new trends. If we turn to the micro level, which is more valuable for our study, then changes in output volumes under the influence of new (innovative) technologies can be tracked by directly analyzing dynamics. In this direction, you can apply: an S-curve, a piecewise linear model, or a model with a dummy switch variable. But this approach has a drawback, which is the loss of some information when moving from multiple regression to pair regression (Sokolov, 2020). The most promising direction in reflecting the influence of innovation on the output of products (works, services) is the inclusion of new variables by detailing the classical factors of production through the transition from factors of a higher order to less (decomposition of factors into components) (Wiśniewski, 2020). Obviously, in the extractive and refining oil industry, the effect of the introduction of innovations can be taken into account by dividing capital into production and innovative fixed assets. Thus, it is necessary to take into account the power of the impact of innovation on product output.
Research Questions
During the study, a number of issues were considered, including the study of econometric models. It was found out why the assessment of the selected parameters influences the result of the enterprise functioning. The question of why enterprises need this econometric model has been resolved. It was decided what role innovation plays in development in terms of their inclusion in the model. It is found out what are the limitations in modelling the model taking into account the peculiarities of the production function and statistical parameters. The answer is given why innovative fixed assets and investments in non-current assets lead to an increase in the company's revenue. It is found out why it is necessary to make an adjustment for the producer price indices of manufacturing industries. It is shown what is the interpretation of the results obtained and their use in practice, that is, the issue of the relevance and applicability of the study is resolved.
Purpose of the Study
The aim of the study is to create an econometric model from the point of view of the influence of production factors (including innovations) on the result of the functioning of the analysed enterprise, taking into account the assessment of the available parameters. The goal also includes the study of a refinery using innovative developments in its activities. The goal is not to integrate the innovative technologies themselves into the process, but only includes their imposition on an economic model, in which innovation and information technology are reflected using variables. The goal also includes the formulation of a non-linear function with two factors: innovative fixed assets and investments in non-current assets, which lead to revenue growth. The goal is also to prove that the innovation component and investment leads to a positive result, i.e. growth of gross revenue of the enterprise. The goal also lies in proving the practical importance of using econometric methods in analysing the economic potential of a company and increasing its competitiveness in the market. The goal is also driven by evidence that an increase in innovative fixed assets by at least 1% leads to an increase in the average gross revenue of an enterprise by 0.463%.
Research Methods
Official sources were used in the study. Information on macroeconomic processes and phenomena that influence the emergence of innovations in the extractive and manufacturing industries (including in the oil and gas industry) were selected from the official statistical publications published by the Federal State Statistics Service of the Russian Federation (Federal State Statistic Service, 2020). In particular, information from the collection Indicators of innovation in the Russian Federation was used. Additional information characterizing the role and place of Russia in the world oil and gas market was taken from the Indicators of innovation in the Russian Federation (Ditkovsky et al., 2018). The indicators given in these publications made it possible to analyze the factors that shape innovation, both in dynamics and in structure. Analytical data collection was carried out. The selection of the necessary information allowed us to model forecasts for the next year in the innovative potential of the company.
Also, to assess the effectiveness of the introduction of innovations at the micro level, we used information from the internal reporting of JSC Antipinsky Oil Refinery for a number of years, which made it possible to evaluate the parameters of the econometric model of the influence of production factors (including innovations) on the result of the functioning of the analyzed enterprise (Antipinsky Refinery, 2020).
Findings
Russia, possessing significant reserves of natural resources, has been holding leading positions in the world oil market for many years, so at the end of 2019 the volume of production was 554.3 million tons, or 12.4% of the total production. But it is worth pointing out the significant competition in this market, and a sharp increase in production in the United States, in connection with which Russia has been ranked second in the ranking for several years. Strengthening competition and a number of other macroeconomic factors pose the task of finding a solution to the problem; one of the ways out of this situation is the widespread introduction of innovations and new technologies at oil enterprises. The proposed approach has been adapted to JSC Antipinsky Oil Refinery, which is a typical manufacturing enterprise, in particular, the enterprise in question is engaged in oil refining and obtaining various types of products and actively uses innovative developments in its activities. The basis of economic analysis will be a qualitative and quantitative study of the influence of factors on generalizing economic indicators, the whole process of which can be presented in the form of three stages, shown in Figure
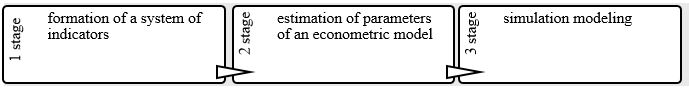
The chain of the above actions was adapted based on the data of Antipinsky Oil Refinery JSC.
When creating a system of indicators reflecting the dependence of the output of a refinery, we will be guided by the theoretical calculations given above.
It is worth noting that the list of indicators that will be used in the analysis largely depends on the available open data, thus, we use gross revenue (Y) as a dependent variable, the list of independent variables is as follows: production fixed assets (X1); innovative fixed assets (X2); personnel costs (X3); investments in non-current assets (X4). Since the cited variables are cost variables, which means they are subject to the influence of inflation, before proceeding with the construction of a regression model, it is necessary to adjust for the producer price indices of manufacturing industries (December in percent to December of the previous year). Four indicators have an upward trend, investments in non-current assets are growing until 2013, and then the growth rate slowed down, which can be associated with the consequences of the 2014 crisis, which had a strong negative impact on the oil and gas industry in Russia. To reflect the relationship between the indicators characterizing the production process, it is possible to use a wide range of production functions, so the calculation will be based on a multiple power function.
Thus, the parameters are estimated using the following regression equation:
Since this is a nonlinear dependence, we cannot directly apply the least squares method to this equation, the variables must first be linearized, namely, take the logarithms on the right and left sides of the equation.
3. The simplest, and accordingly the most frequently used, method for estimating the parameters of the regression equation is the least squares method, the application of this algorithm to the available data using a step-by-step construction method leads us to the following econometric model:
This model can be written in a more familiar form, but having previously carried out the procedure for potentiating the parameter 𝒂𝟎.
It should be noted that variables X1 and X3 were not included in the equation due to their statistical insignificance.
The resulting model is characterized by the following values of the Student's t-statistics:
)=2,624,
)=5,570,
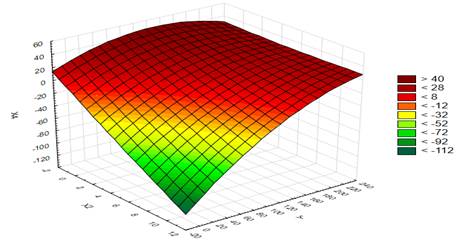
)=2,843. In this case, the tabular value at =0,05 and df = 10 is 2.228. Hence, we draw a conclusion about the statistical significance of the parameters of the estimated regression equation. The empirical value of Fisher's F-statistic is 122.79, comparing it with the table value equal to 4.103 (= 0.05, df1 = 2, df2 = 10), we come to the conclusion that the whole regression equation is statistically significant. The value of the multiple coefficients of determination equal to 0.961 indicates a high degree of adequacy of the constructed equation by the actual value of the dependent variable, since only 3.9% of fluctuations in gross revenue are not described by the variables included in the equation. The surface reflecting the dependence of production results on factors is shown in Figure
The interpretation of the obtained parameters of the regression equation is as follows:
First, the growth of innovative fixed assets (X2) by 1% leads to an increase in the average gross revenue of the enterprise by 0.463%, with the remaining factors unchanged. Secondly, an increase in investment in non-current assets (X4) by 1% leads to a change in the dependent variable by 0.759%. Third, since the regression parameters are comparable with each other (expressed as a percentage), it can be argued that investments have a greater impact on gross revenue than innovation (0.759> 0.463). Fourth, the sum of the two regression coefficients is greater than one (0.463 + 0.759> 1), indicating an increasing return to scale, i.e. an increase in resource costs leads to an even greater increase in the result (Table
The simulation results show that, taking into account the linear growth of the values of the independent variables, and provided that this trend persists, in the forecast period 2020 - 2022. In practice, an increase in the company's gross revenue will be observed.
Conclusion
Consideration of the class of production functions has shown a sufficiently developed theoretical basis, which makes it possible to choose a model to describe almost any production, both at the macro- and microeconomic level. It was also found that, depending on the goals of modeling and the level of the analyzed system, the set of variables involved in the model is different, but at the same time they reflect the relationship between one explained variable characterizing the result of production and two factors that reflect human resources and capital. This set of factors does not allow reflecting new trends in the economy, such as digitalization and the transition to a new technological order. In this regard, in addition to the classical factors in the analysis, we used variables reflecting innovation and investment. As a result of evaluating the parameters of the production function, we obtained a nonlinear function with two factors: innovative fixed assets and investments in non-current assets. According to the coefficients of the model, the first factor leads to an increase in the company's gross revenue by 0.463%, and the second by 0.759%. The sum of the coefficients indicates an increasing return to scale, which means that the result grows faster than the cost of resources. We consider the obtained results of econometric modeling to be logical and in line with modern trends in the Russian economy. Testing the model for adequacy and statistical significance showed that it meets all the requirements, as a result, the gross revenue levels were predicted under the influence of changes in factors, which indicates further growth of the dependent variable in the period 2020-2022. Simulation modeling was also carried out, for this, the values of independent variables were alternately substituted into the model, starting from the minimum and ending with the maximum. The received responses of the explained variable also show an increase with increasing values of the explanatory variables. Thus, an increase in the innovation component and investment leads to a positive result, i.e. growth of gross revenue of the enterprise.
References
- Akberdina, V. V., & Volodin, A. I. (2020). Models of public investment management at the regional level. Economy and Business, 1(11), 45-57.
- Antipina, N. V. (2019). Optimization of investments in fixed assets of an oil company. Bulletin of the Baikal State University: Economics and Business, 2(29), 262-272.
- Antipinsky Refinery (2020). The council of employees. https://www.annpz.ru/en/about/stk/
- Cobb, C. W., & Douglas, P. H. (1928). A theory of production. The American Economic Review, 18(1), 139-165.
- Ditkovsky, K., Fridlyanova, S., Gokhberg, L., Gorodnikova, N., Kuznetsova, I., Lukinova, E., Martynova, S., Ratay, T., & Rosovetskaya, L. (2018). Indicators of innovation in the Russian Federation: 2018. https://issek.hse.ru/en/news/298400322.html
- Federal State Statistic Service (2020). Regional statistics. https://rosstat.gov.ru/regional_statistics
- Gilli, M., Maringer, D., & Schumann, E. (2019). Numerical methods and optimization in finance. Academic Press.
- Kleiner, G. B. (2016). Production functions: Theory, methods, application. Finance and Statistics.
- Smagina, M. N. (2018). Theory and methodology of studying the patterns of regional development. Monograph. TSTU.
- Sokolov, A. P. (2020). Interaction of macro and micro levels in the formation of the country's economic security. Industrial Economics: Economics and Business, 1, 6-10.
- Walker, D. (2007). Early general equilibrium economics: Walras, Pareto, and Cassel. In W. J. Samuels, J. E. Biddle, & J. B. Davis (Eds.), A Companion to the History of Economic Thought (pp. 278-293). Wiley.
- Wiśniewski, J. W. (2020). Econometric modeling of profit in an enterprise. In W. Szkutnik, A. Sączewska-Piotrowska, M. Hadaś-Dyduch, & J. Acedański (Eds.), Proceedings of the 14th International Scientific Conference Analysis of International Relations 2020. Methods and Models of Regional Development. Summer Edition (pp. 225-237). Publishing House of the University of Economics in Katowice.
Copyright information

This work is licensed under a Creative Commons Attribution-NonCommercial-NoDerivatives 4.0 International License.
About this article
Publication Date
30 April 2021
Article Doi
eBook ISBN
978-1-80296-105-8
Publisher
European Publisher
Volume
106
Print ISBN (optional)
-
Edition Number
1st Edition
Pages
1-1875
Subjects
Socio-economic development, digital economy, management, public administration
Cite this article as:
Suraeva, M. O., Kamynin, D. A., & Kucheryavenko, D. M. (2021). Econometric Modeling Of The Impact Of Microenvironment On The Level Of Production. In S. I. Ashmarina, V. V. Mantulenko, M. I. Inozemtsev, & E. L. Sidorenko (Eds.), Global Challenges and Prospects of The Modern Economic Development, vol 106. European Proceedings of Social and Behavioural Sciences (pp. 653-661). European Publisher. https://doi.org/10.15405/epsbs.2021.04.02.79