
Possibilities Of The Slutsky Equation For Studying Consumer Behavior In A Crisis


Abstract
The coronavirus pandemic has impacted all areas of life, transforming the world into a new reality. The economic crisis caused by the pandemic has changed consumer behavior. The way out of the restrictions will be accompanied by a change in previous habits, as well as a decrease in income levels and expenditures on goods and services. Squeezing demand is one of the main consequences of coronavirus infection. This is due to the strong decline in economic activity that began in March 2020. Now it is very important to find methods and mechanisms that would help to develop an algorithm of action during a pandemic, capable of directing the economy towards an exit from the deepest recession. These levers include mathematical methods. The effect of income described by Slutsky, as a result of which there is a change in the volume of demand, caused exclusively by a change in real income with the constant relative prices of goods, illustrates the behavior of consumers in the current situation. The change in consumer preferences caused by the coronavirus crisis and changes in the population's income is illustrated by graphs of three time series: spending on clothing, footwear and accessories; expenses for beauty salons, massage, SPA; expenses for computer and software. Shows the change in costs relative to the comparable week of 2019. The time period from January 2020 to October 2020 inclusive is considered. These graphs fully demonstrate how consumer behavior has changed during the self-isolation regime.
Keywords: Consumer behavioreconomic crisisSlutsky's equation
Introduction
In 2020, a difficult economic situation unfolded amid a pandemic. By the end of the year, many countries will face a serious recession in the economy and a fall in the gross domestic product. The forecasts of the European Commission developed this year (European Commission, 2020) give negative indicators of economic growth in the vast majority of countries, with the exception of China, the United States and some other countries. In its report, the European Commission writes that the US economy, being the largest economy in the world, is recovering relatively quickly from a record fall in April-May thanks to strong private demand, increased stimulus and monetary policy. China's economy is looking much better than the rest thanks to its rapid response to the pandemic. At the same time, the volume of investments and industrial production by the summer returns to the level of 2019. However, this still affected the growth of Chinese GDP. The Chinese economy is expected to grow by about 2%.
The recession in Russia will be somewhat milder than in other G20 countries. This may be due to the fact that in other countries, for example, in France and the UK, more stringent quarantine measures have been introduced. In many sectors of the Russian economy, employees remained at work, in particular, due to the introduction of various state programs for business support. And yet there is an unprecedented decline in the economies of all countries. The crisis hit major areas such as investment, industry, retail, cash income, demand. If the 2008 crisis was a liquidity crisis, the current crisis is of a more widespread nature, since due to the pandemic, enterprises are suspended, cities are closed, the activity of small and medium-sized businesses and the service sector is sharply reduced (Sevastyanova, 2021). All this hurts world trade. We see a global problematic situation that may require a thorough reconstruction of the systems of interconnection between states, the creation of new global institutions and instruments (Maksimova et al., 2020).
Today one of the most urgent tasks is to find ways out of the economic crisis. Anxious and even panic moods are characteristic of its acute phase (Pavlova, 2010). In the current situation, it is necessary to look for various ways and methods that can not only stop the spread of infection throughout the world, but also that are able to analyze the available data and develop ways to solve a huge problem. Thus, to direct the economy along the path out of an unprecedented crisis. The effect of income described by Slutsky, as a result of which there is a change in the volume of demand, caused exclusively by a change in real income with the constant relative prices of goods, illustrates the behavior of consumers in the current situation (Shurevich, 2008).
Problem Statement
The economic crisis caused by the pandemic has changed consumer behavior. These changes can be tracked using numerous reports and statistics (European Commission, 2020; SberIndex, 2020). In the current situation, it is necessary to look for various ways and methods that can not only stop the spread of infection throughout the world, but also that are able to analyze the available data and develop ways to solve a huge problem. Thus, to direct the economy along the path out of an unprecedented crisis. These levers include mathematical methods (Nuykina, 2021). Due to the changing economic realities, there is particular interest in changes in consumer behavior. The mathematical description of the dependence of the demand for certain goods on the income of the population and the prices for these goods makes it possible to form optimal consumption models (Ivanova, 2018).
Research Questions
The key problem of the current crisis is the squeeze in demand. Both global for our export products (Maksimova & Morozov, 2019) and domestic. People's incomes have fallen, many businesses are not working. Retail trade has dropped significantly during the coronavirus crisis. Breaking out of limitations will be accompanied by a change in old habits. There is a decrease in the levels of income and expenditure on goods and services. Changes in consumer behavior are of particular interest due to changing economic realities. The mathematical description of the dependence of the demand for certain goods on the income of the population and the prices of these goods allows us to form models of optimal consumption.
Purpose of the Study
The aim of this work is to study the situation of consumer behavior. Consumer demand is one of the drivers of economic development. It acts as the basis for improving the well-being of the population. The use of the theory of consumer choice can make it possible to develop ways and methods of solving the existing global problems. Mathematical methods, in particular, the Slutsky equation (Shurevich, 2008), have the ability to conduct a detailed analysis of the existing situation. Further research on the volume of consumer spending will make it possible to assess the scale and consequences of the economic crisis. This should increase the quality and efficiency of the measures taken and management decisions (Ivanov, 2020).
Research Methods
The income of the population greatly affects the economy. A significant decrease is associated with strict quarantine measures and the withdrawal from the market of many small and medium-sized businesses. With a decrease in income, there is a change in demand for certain goods. Due to changing economic realities, special attention should be paid to changes in consumer behavior. The mathematical description of the dependence of the demand for certain goods on the income of the population and prices for these goods makes it possible to form models of optimal consumption. In the theory of consumer choice and the demand function, the equation of Slutsky is of great importance (Shurevich, 2008), which characterizes the quantitative relationships between changes in prices for certain goods and consumer income, on the one hand, and the structure of consumer demand, on the other.
- the effect of compensated price changes on demand.
The
Take the consumer choice problem for two products with indicators
Using the formula to determine the demand function:
get
Let the price of the first product increase
The utility function will take the form:
Let us denote by new budget.
That is, to keep the utility the same, a new budget should change into relative to the old.
Demand with a new budget:
The demand for the first and second goods has changed, and in different directions (Kozyrev, 2015).
Let us find the derivatives of the compensated demand for these goods at the price of the first.
The price increment is:
Increases in demand for goods:
Using the Slutsky equation,
one can calculate the indicators of compensated demand for the consumer choice problem.
Findings
Currently, the income effect described by Slutsky (as cited in Shurevich, 2008) is fully observed. There is a change in the volume of demand, caused exclusively by a change in real income while the relative prices of goods remain unchanged.
The pandemic has significantly changed consumer preferences and spending. This statement can be illustrated by using graphs of changes in spending for such categories as “Clothes, shoes, accessories” (Figure
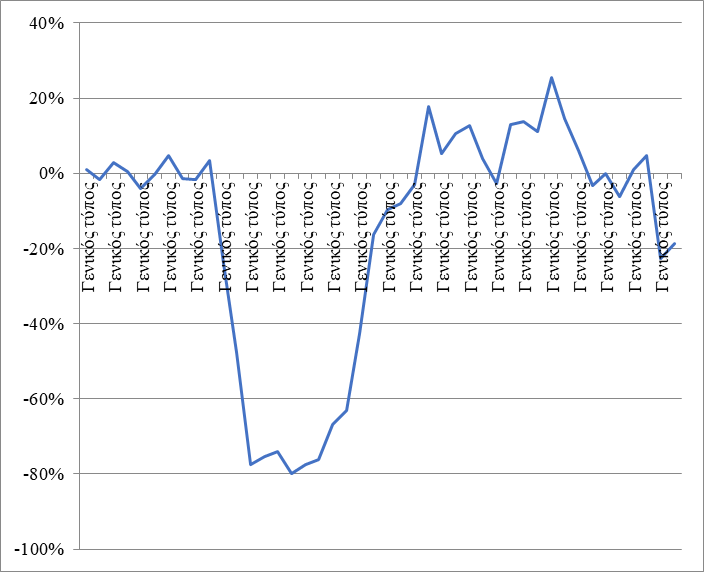
As you can see from the graph, expenses for clothing and footwear fell significantly during the March-June period. In the twenties of April, the decline reached 80% compared to the same week of 2019. Indeed, in self-isolation and teleworking mode, there is no particular need for a wardrobe update. In addition, incomes have dropped for many people. At the end of August, the largest increase in expenses for this category of goods was observed. So, for example, on September 31, 2020, these values reached 25.5%. Next comes the decline. At the beginning of November, there was an 18.6% outflow in spending on clothing, footwear and accessories compared to the same week of 2019. The increase in consumption in the period from July to September can be explained by the fact that after the release from quarantine, deferred demand was realized.
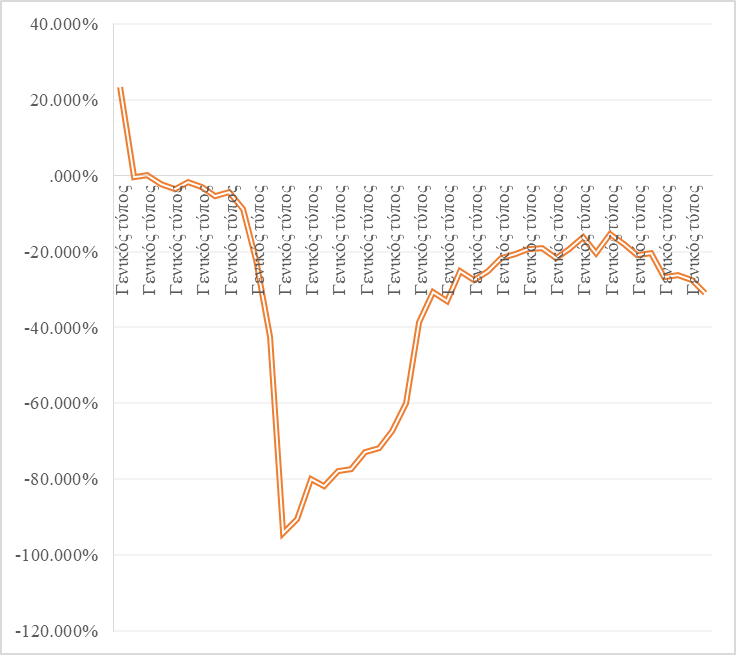
The cost of the services of SPA-salons and beauty salons has also dropped dramatically. For the period January-October 2020, the lowest value can be observed, equal to -94.2% compared to the comparable week of 2019. At the beginning of November 2020, the decline is very large and amounts to -31% compared to the same week of 2019. A slight increase in July-September can be explained by the exit from strict quarantine and the need to tidy up the appearance during the holidays. However, the recovery of this service sector is still very far away.
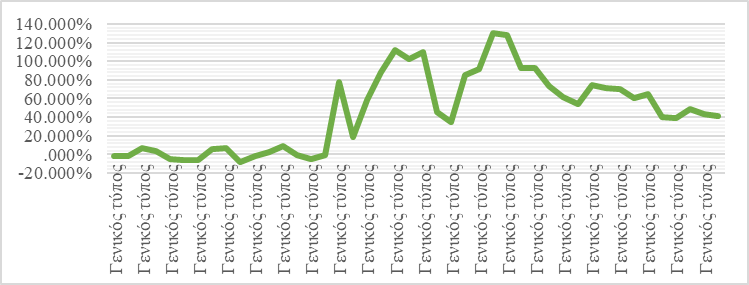
In connection with the transition of a significant part of the population to a remote mode of work, and students to distance learning, there is a significant surge in demand for computers and software. Mid-July saw the largest increase in spending on these items, at around 130% compared to the same week in 2019. Despite the apparent decline in household spending on computer and software from late July to early November, it is clear that relative to the same period in 2019, there is a significant increase. As of November 2, 2020, expenses for this type of goods and services are + 40.8%.
Conclusion
The COVID-19 pandemic has caused an unprecedented crisis around the world. The length of the recession is very difficult to predict (Esin, 2020). A mathematical description of the dependence of the demand for certain goods on the income of the population and the prices for these goods can help to develop ways and methods of solving the existing global problems. Mathematical methods, in particular, the Slutsky equation (Shurevich, 2008) will allow for a detailed analysis of the existing situation. The change in demand affected almost all spheres of the economy. For example, we see a deep hole in spending on clothing, footwear and accessories. Consumption growth in the period from July to September can be explained by the realization of deferred demand. The retail does not grow further. One of the most affected spheres of public service is beauty salons, massage, SPA. There is a catastrophic drop in costs for this category of services. And there is no way out of this unfavorable situation yet. However, spending on computer and software has shown a steady and rather strong growth. It most likely depends on the fact that many people have switched to remote work and study. Old computer hardware and software are not up to date and have to be replaced. It is necessary to conduct further studies of changes in demand and expenditures of the population in order to identify the main consumer trends and to be able to mitigate the negative economic consequences by the effectiveness of management decisions.
References
- Esin, P. A. (2020). Scenario for the development of the global market in the context of the coronavirus crisis. News of Higher Educational Institutions. Applied Nonlinear Dynamics, 28(2), 158-167.
- European Commission (2020) European economic forecast. Autumn 2020. https://ec.europa.eu/info/publications/european-economic-forecast-autumn-2020_en
- Ivanov, M. V. (2020). Mathematical modeling of the pandemic process: Theory and practice. https://indsi.ru/2020/04/30/математическое-моделирование-проце/
- Ivanova, V. O. (2018). The role of economic and mathematical methods in optimizing economic decisions. Creative Economy, 12(9), 1385-1398.
- Kozyrev, V. M. (2015). Economic school for graduate students in the history and methodology of economic science theory of consumer behavior: The essence, initial foundations and practical aspects. Bulletin RMAT, 1, 46-59.
- Maksimova, E. V., & Morozov, V. V. (2019). Economic growth and integration in the new model of the world economy: Conclusions for Russia. Innovation and Investment, 11, 64-68.
- Maksimova, E. V., Ryabtsev, A. G., & Sazonova, O. A. (2020). The impact of coronavirus on the Russian economy. Innovation and Investment, 4, 283-286.
- Nuykina, E. Y. (2021). Some basic mathematical tools’ principles for modeling economic processes. In S. Ashmarina, V. Mantulenko, & M. Vochozka (Eds.), Engineering Economics: Decisions and Solutions from Eurasian Perspective. Lecture Notes in Networks and Systems, 139 (pp. 340-347). Springer.
- Pavlova, M. V. (2010). Historical aspects of world economic crises. Bulletin of Kamchatka state technical University, 13, 40-46.
- SberIndex (2020). Operational economic statistics and open data of BEAC. https://www.sberindex.ru/ru?tags%5B%5D=9
- Sevastyanova, S. A. (2021). Business stabilization during the crisis. In S. I. Ashmarina, J. Horák, J. Vrbka, & P. Šuleř (Eds.), Economic Systems in the New Era: Stable Systems in an Unstable World. Lecture Notes in Networks and Systems, 160 (pp. 303-310). Springer.
- Shurevich, G. I. (2008). Application of the Slutsky equation in the study of the theory of consumer behavior. Bulletin of Kuzbass State Technical University, 5, 128-129.
- Zamkov, O. O., Tolstopyatenko, A. V., & Cheremnykh, Yu. N. (2004). Mathematical methods in economics. Moscow State University.
Copyright information

This work is licensed under a Creative Commons Attribution-NonCommercial-NoDerivatives 4.0 International License.
About this article
Publication Date
30 April 2021
Article Doi
eBook ISBN
978-1-80296-105-8
Publisher
European Publisher
Volume
106
Print ISBN (optional)
-
Edition Number
1st Edition
Pages
1-1875
Subjects
Socio-economic development, digital economy, management, public administration
Cite this article as:
Nuykina, E. Y. (2021). Possibilities Of The Slutsky Equation For Studying Consumer Behavior In A Crisis. In S. I. Ashmarina, V. V. Mantulenko, M. I. Inozemtsev, & E. L. Sidorenko (Eds.), Global Challenges and Prospects of The Modern Economic Development, vol 106. European Proceedings of Social and Behavioural Sciences (pp. 538-545). European Publisher. https://doi.org/10.15405/epsbs.2021.04.02.65