
Behavioral Pricing On Russian Financial Market


Abstract
The purpose of the study described in this article is to solve the problem of investment decisions in the current environment where investor irrationality comes to the front and blinds traditional classical analytical tools. During the post-crisis period it becomes a problem not only for Russian valuation analysts but for global as well. The current study uses behavioral finance methodology to solve this problem. To illustrate the solution, we used the discounted cash flow valuation techniques on a huge amount of on-sale Russian businesses and then applied quantitative financial solution methods to process the multiple results. As it is shown in the article stochastic discount factor-based behavioral pricing theory is a construction set for skilled researchers. An instrument turned into the future. With the developed techniques with improved tools, new models and empirical testing at various markets it will be included in the product range of analytical databases and value assessment methods for businesses and other assets. As it is approved with the article’s data sentiments have an influence on prices and lead to different interpretations of risks and returns in neoclassical and behavioral finance theories. So behavioral finances and neoclassical finances give a different meaning to asset pricing and especially to correlation of risks and profits.
Keywords: Behavioral assessmentbehavioral discount ratebehavioral financebehavioral pricingCAPM
Introduction
The development of behavioral pricing theory and financial and stock market sentiment research is based on the behavioral pricing fundamental theory (Shefrin & Belotti, 2015). In the late nineties, Shefrin and affiliated Santa Clara University professor Belotti added another brick to the behavioral finance research base. This strand of research has its practical value and was used at the Russian M&A market. Determining the basics of their study, Shefrin and Belotti (2015) share that behavioral finances and neoclassical finances give a different meaning to asset pricing and especially to correlation of risks and profits. Their works are centered on the stochastic discount factor framework used to assess any asset as the expected value of the expected discounted cash flow. While the behavioral pricing theory concentrates on new information at the market, misinterpreted by non-rational players from the point of view of established probability laws, here Shefrin and Belotti use the word “sentiment” in the following context.
Problem Statement
Supporters of behavioral pricing emphasize that asset prices reflect sentiments (opinions). Such sentiments are widely understood as erroneous insights on future cash flows and risks. Shefrin and Belotti (2015) in their generalizing study show how sentiment is reflected in the stochastic discount factor. In particular, sentiments have an influence on prices and lead to different interpretations of risks and returns in neoclassical and behavioral finance theories. The authors of the stochastic behavioral assessment theory create strict, consistent and interconnected analytical instruments. They are based on the correlation of a calculated asset value and random payments of this asset, discounted at the discount rate. The rate reflects both temporary money value and risks. Both payments and rates are random values. Payments are inherently random. Discount rate is random due to various levels of asset returns and shows various levels of risk, connected to returns on each level.
Research Questions
In accordance with the Shefrin and Belotti’s (2015) theory, sentiments are subject to erroneous convictions. In that case, we can imagine payments as a variable defined by the probability density function that is intrinsically correct. But the decision-making investor adds their subjective expectations into judging it. If such expectations are correct, investor sentiment is defined as zero. If the expectations are not correct (do not correspond the density), their sentiment is non-zero. Therefore, in such case there is an incorrect perception of probability scenarios, attributed to two different groups of financial and stock market players (Bogatyrev, 2016). The Shefrin and Belotti’s stochastic discount factor theory highlights the aspect that is vital for behavioral valuation, such as how a balanced market merges density functions of individual investors in one density function of the market in the whole. A general market model is built as that it describes the behavior of two investors with similar starting possessions. The consumption growth logarithm has regular distribution. Moreover, both investors think the situation will be the same in the future. However, the investors have divergences at the starting point. One is too focused on growth while the other – on reducing consumption growth. Both investors have similar opinions at the second step (Bogatyrev, 2018). These analytical instruments are illustrated in the diagram.
Purpose of the Study
The Shefrin and Belotti’s (2015) theory shows how a balanced market merges density function curves of both investors. There are four density function curves. The outer two belong to two investors. The one in the middle is indicated in the same way as the behavioral pricing theory indicated transition matrix, and represents the “objective” density. In accordance to the assumption of the theory, the mean of objective density is equal to the simple mean of two investors’ density at the first stage (Bogatyrev, 2020). The fourth density function curve is attributed to the market. It is the equilibrium density used in asset pricing. Density function doesn’t sum conditions. It sums probability density functions.
Both bears and bulls are incorrect in their expectations. It is apparent, as both their lines do not match the objective density. In addition, the market density is also out of the zero sentiment frame, as the equilibrium (market) density differs from the objective density. When all investors have correct expectations, their probability density function is the same as the objective density function. In that case, market density is the same as objective density. Sentiment function is equal to zero. With zero sentiment, market attributes asset prices in accordance with the objective probability density function, and prices will be efficient, i.e. reflect precisely the true source of indetermination at the market. Shefrin and Belotti’s input in developing behavioral finances with their stochastic discount theory resides on the fact that stochastic discount factor reflects both market sentiments and fundamental factors. The authors of the behavioral stochastic theory explain why informed traders don’t use the largeness of noise traders’ mistakes and don’t wipe the latters out (Grigoriev, 2018). The risks are so high and volumes are so great that they don’t dare doing that. Informed investors bring the market into an efficient pricing state in a long-term perspective. The main factor is the value of investor entropy. Investor entropy is the difference between their density function and the objective density function. For informed investors this difference and thus the density are equal to zero while noise investors demonstrate positive entropy. Returns in accordance to the stochastic discount factor will be more volatile.
Research Methods
The theory of behavioral assessment with stochastic discount factor was applied into practice on a specific stock. The theory result represents the sentiment function diagram for the Shevron stock. The interpretation of the result is in conformance with the discount theory is as follows. Positive values at the left signify that the market probability density is overestimated within the probability that the Shevron stock returns will be too low. Negative values at the right signify that the market probability density is underestimated within the probability that the Shevron stock returns will be too high. Therefore, this position makes us state that Shevron stock is traded by both uncertain bears and overconfident bulls. Various researchers have measured investors’ risk avoidance within the scope of behavioral theory. Much to their surprise, it could have turned negative. Values above 6 are also considered to be out of the theory range. To make the model work, sentiments are considered equal to zero. The modern asset valuation theory is built on the principle of stochastic discount factor. The cornerstone of this behavioral version of valuation theory is a good definition of emotions or sentiments. Definition of sentiment is based on the measure of errors in probability density, made by a single investor or by the market in the whole. In the close-to-practice perspective, market sentiments are represented by the difference between two stochastic discount factors – market factor and neoclassic factor. Sentiments are manifested at the evaluation of all assets through the lens of stochastic discount factor. Sentiment activity force is demonstrated in the risk rejection measurement in the models where sentiments are considered equal to zero. So, to say, their influence is ignored. Risk avoidance indices in such experiments are too high and unrealistic. The theory doesn’t completely explain the fact that assets with positive shift in the above mentioned analytical curves are associated with reduced risk premium while assets with negative shift – in the opposite way. Investors’ probability density function is subjected to change in time. So, the sentiment-defining constant in this function is also changed, stochastic discount factor changing with it.
Findings
The most interesting continuation of the foregoing foreign theory certainly could have been expected at the Russian M&A market. The research was focused on the Russian M&A scene. For research purposes we took the Russian M&A data in the maximum retrospective extent, so to consider all the range of sentiments that Russian financial decision makers have undergone. First transactions in this research refer to the beginning of the XXI century. The research assesses the whole range of business and economic cycles that have happened in the new capitalistic Russia during all these years of already born and established market. The analysis covers all popular industries of the period where businesses were evaluated and traded.
First, the research encompasses sales offer advertisements available at the market during the period. It also includes real M&A transactions where valuers were involved to evaluate assets (Pomulev, 2019). After the primary screening and analysis, specific business information, necessary for its correct assessment, was requested from business selling brokers or vendor representatives. Company values were calculated from 2012 until 2018. Primary offering database has been significantly expanding during this period. Finally, it covered all major federal resources with businesses-for-sale advertised. The SME market has shown to be the most active and abundant. The discounting cash flow method was used to value each selected company, based on the submitted information. The result of the cost estimate was compared with the selling price of the business vendor. The difference between the selling price and the calculated market price was assigned as a behavioral bonus or discounting rate reduction, calculated using the capital asset pricing model for developing markets and adjusted for the company size and risks.
CAPM discounting rate behavioral adjustment (component) is adapted so that the DCF-calculated market value was equal to the business vendor’s selling price in the offer. Such adjustment will come positive and will increase the final discounting rate in case the vendor is under the influence of poor reliance and poor reaction heuristics. The market that presents this business for sale suffers from capital drain or even capital flight, the economics registers financial crisis. The industry with such transactions is collapsing. The adjustment comes negative when the seller overprices their business, is influenced by excess confidence heuristics. The market is growing, its players are subjected to the euphoria of growth, financial bubble is inflated, the industry with such transactions is pumped with excess capital. There are two data sequences on deviations of real discount rates in M&A transactions from its CAPM values. One value distribution corresponds the positive, “bull” market sentiment, where prices are overheated. The other is connected to economic downfall, pessimism and bargain sales of businesses. Analytical instruments of value analysts and underwriters are updated with the maximum usage of open data sources on Internet. For example, real estate assessment software, based on sales comparison approach, provides a huge range of similar objects and collects information on real estate items available in open sources such as Cian, Domofon and of course Avito websites (Pomulev, 2019). Every day the programs scan huge amounts of listings and create their analytical tables that are used to calculate multipliers further used for evaluation of similar real estate items.
In that case, semi-manual data processing method was used for an attempt to assess a wide range of business assessments. The research included a long register of business selling websites. Data profiles on various on-sale enterprises allow to create a comprehensive evaluation report on the discounted cash flow-based market value. Discount rate is calculated in accordance with the extended (or modified, as US valuers call it) capital asset pricing model (CAPM). Valuers, while calculating discount rate, can ignore one element of the extended rate – company-related risks. From the US valuers’ experience, it can be taken as a given that these risks are recognized in the beta calculation. In other cases, the company risks are recognized separately as a part of the CAPM calculation formula. Cash flow-to-equity forecasts for the forecasted and post-forecasted periods serve as a basis for equity value calculations. Then follows the comparison of these two indices: business selling price, or vendor estimate, and market value of the same business, calculated in accordance with all the classic assessment rules by the common discount rate model. The objective is to find the discount rate adjustment that will make the discount rate calculation results equal to the selling price under the existing net cash flow forecasts.
If the forecast was based on the vendor’s information about returns and other features of the item, divergence can be found only in one component of the market value calculation – fraction denominator, discount rate. That means that the vendor uses another discount rate, evaluates returns and risks differently. Such calculations can be easily computerized. Let’s study a case where the vendor discount rate is almost eighty percent (79.7%). That means that we need to add 56.7% to the Modified CAPM, to get the business vendor’s discount rate. So, this is the behavioral adjustment of a discount rate. So to say, if a vendor underestimates the selling price with respect to the valuer-calculated market value, the adjustment will increase the vendor’s discount rate. It happens at a buyers’ market, at a reducing capital market, where vendors are tending to sell their businesses at any discount in order not to lose even more at a declining market. If the business price is overestimated, a vendors’ market prevails, investors compete for investment scopes, and the behavioral adjustment should reduce the valuer’s discount rate. To reflect positive and negative sentiments at the market, behavioral adjustment is taken as opposite. So, for a vendors’ market, a growing market with positive emotions and expectations for further growth, the initial analytic dataset, resulted from comparing assessments of on-sale businesses and their selling prices, can be presented with the following dataset: 5%, 10%, 15%, 20%, 25%, 30%. For a declining market where vendors are afraid to lose even more and significantly reduce the price of businesses, we take an opposite behavioral adjustment, and the results are presented with the following dataset: from -150% to -5%.
The datasets show that the higher is the number of evaluated businesses, the better is the data for building probability density function (behavioral adjustment values) charts. Each dataset has its own probability density function graph. Two graphs are built: one for the positive sentiment at the market (marked with rhombic signs), other for the negative ones (marked with square signs). Summed, they create a general market graph for both conditions (graph marked with triangle signs), as shown at the Figure
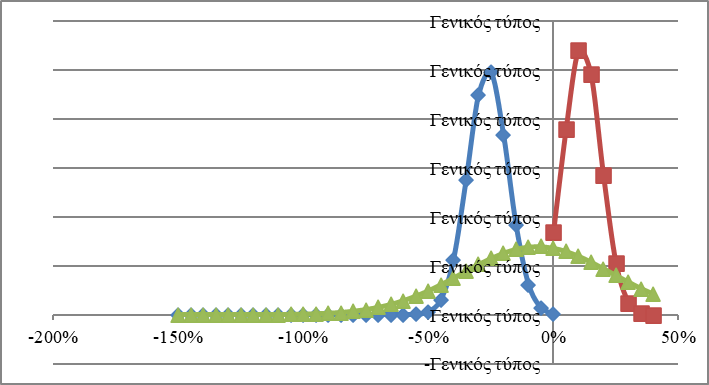
Probability density function for MCAPM discount rate adjustment at the growing market is marked by diamonds of negative adjustment. Squares are for the falling market. Triangles – for the general market. So, it requires a lot of time-consuming operations to get the result, assessment of a single business is rather hard, and it requires dozens of companies to be assessed in order to make probability analytic tools work correctly, but the results look interesting. We want to draw the reader’s attention once more to the fact that the MCAPM discount rate adjustment is to be regarded as opposite in order to reflect not mathematical results but negative or positive emotional background at the market. For negative emotional background, the falling market, the market where business owners sell their businesses at any discount, adjustment values are about 25 percent negative. At the vendors’ market, the growing market, the vendors are not so generous. The adjustment is about 15% with MCAPM. Such results totally correspond the prospect theory.
Conclusion
In the top right part of the value function (usefulness) chart within the prospect theory, financial decision-makers feel the delightful bliss of sudden enrichment and unexpected profitable property acquisitions. In that part the line goes up not so fast as the line goes down in the bottom left part, the part where market players, expecting the worse, are ready for a great value loss in order to prevent even greater losses in the nearest future. As some researchers state that the difference in growth/decline speeds is about double. This is more or less what we see in real data. The second interesting thought that comes from calculation results and their visualization. Traditional instruments of the classical financial science are still effective. As shown at the diagram, the general adjustment probability density function at the time-general market, i.e. the market that exists not for only 4 years of crisis or 4 years of growth but for the whole 8 years of emotional boom and bust cycles, is equal to the result forecasted by MCAPM. That means that in order to use behavioral tools, we need to measure emotions at the market, find the nature of emotional sentiment and apply the current adjustment correctly for asset valuation purposes. So, to say, pure calculation, financial and economic research should be combined with questionnaires, psychological field research when market players are tested for their emotional disposition to the market and its activity. It can be done in the same way as PMI. Behavioral researches based on such selection can help improve practical usage of behavioral tools. That opens new horizons in behavioral value studies and their transition into action. We can expect then that for each measurement of positive and negative emotional situation at the market we can find a correspondence between psychological background and more specific adjustment of the MCAPM discount rate. Stochastic discount factor-based behavioral pricing theory is a construction set for skilled researchers. An instrument turned into the future. We can hope that with improved tools, new models and empirical testing at various markets it will be included in the product range of analytical databases and value assessment methods for businesses and other assets.
References
- Bogatyrev, S. Yu. (2016). Behavioral finances in Russia: Theory and practice. Property Relations in the Russian Federation, 4(175), 32-45.
- Bogatyrev, S. Yu. (2018). Testing the value function of the prospect theory on Russian M&A market. Journal of Reviews on Global Economics, 7, 731-739.
- Bogatyrev, S. Yu. (2020). Modern techniques of behavioral analysis of financial instruments on the stock market. Audit and Financial Analysis, 1, 77-81.
- Grigoriev, V. V. (2018). Nature of the system of common standards for valuation in the countries of the Eurasian economic union. Journal of Reviews on Global Economics, 7, 834-842.
- Pomulev, A. A. (2019). Organization of operational risk management in lending to corporate borrowers. Tenevaya Ekonomika, 3(2), 139-144.
- Shefrin, H., & Belotti, M. L. (2015). Risk and return in behavioral SDF-based asset pricing models. https://ifin.usi.ch/assets/docs/seminars/h_shefrin.pdf
Copyright information

This work is licensed under a Creative Commons Attribution-NonCommercial-NoDerivatives 4.0 International License.
About this article
Publication Date
30 April 2021
Article Doi
eBook ISBN
978-1-80296-105-8
Publisher
European Publisher
Volume
106
Print ISBN (optional)
-
Edition Number
1st Edition
Pages
1-1875
Subjects
Socio-economic development, digital economy, management, public administration
Cite this article as:
Bogatyrev, S. Y. (2021). Behavioral Pricing On Russian Financial Market. In S. I. Ashmarina, V. V. Mantulenko, M. I. Inozemtsev, & E. L. Sidorenko (Eds.), Global Challenges and Prospects of The Modern Economic Development, vol 106. European Proceedings of Social and Behavioural Sciences (pp. 203-209). European Publisher. https://doi.org/10.15405/epsbs.2021.04.02.25