
Methodological Aspects Of Multivariate Analysis Of Innovative Product Markets


Abstract
Negative macroeconomic trends increase the level of uncertainty of projects and reduce the accuracy of forecasts. When implementing innovative projects, the risks associated with product sales multiply. Forecasting future market volumes of innovative products using standard approaches is not efficient and reduces accuracy. Standard approaches to modeling include regression models. The study examines supply and demand factors for innovative products (using composite materials as an example). The aim is to develop a toolkit for analysis of the composite materials market and to develop a model for forecasting market volumes for aircraft and pipe products (as key segments of composite materials consumption). The authors consider the specifics of composite materials projects and model the long-term market development. In the process of studying supply and demand factors in the aircraft and pipe markets, the authors analyzed and prepared multifactor models for forecasting their volumes. Among the factors that determine market volumes, the authors consider such leading indicators as PMI in production, S&P GSCI Commodity Total Return, consolidated leverage of composite materials producers. Leverage is calculated from the components of the indicators that characterize the debt load, liquidity and business activity. We have developed a model for forecasting prices for polyvinyl chloride, which will improve the accuracy of financial modeling of projects in this area. With the use of developed models are given forecasted values of the dynamics of the nominal value of the markets of aircraft and pipe products of the U.S. until 2030.
Keywords: Aircraft marketcredit riskinnovationspipe products marketsupply and demand factors in the market
Introduction
The state of the composite materials market has had an important impact on the development of high-tech industries. The COVID-19 pandemic has had a negative impact on the demand for composite materials in various end-user industries such as aerospace and defense, automotive and transport, wind energy, construction and infrastructure. The global financial and economic crisis of 2020, caused by the COVID-19 pandemic, has had a negative impact on demand for composites. The change of economic and credit cycles affects the quality of forecasting the dynamics of the exchange commodities market, including the composite materials market, as well as the expected results of companies and projects operating in this market. Forecasting the future price dynamics of the underlying asset is also critical for financial institutions that provide funding to companies operating in the composite materials market.
Problem Statement
The problem of predicting future price dynamics of the underlying asset is particularly relevant for emerging markets. Financial assets of the banking sector do not work effectively for the country's economic growth. This conclusion was confirmed by the correlation-regression analysis of two variables: volume of corporate and private loans issued by the banking sector and gross domestic product. The retrospective sample has been formed since 2003.
Thus, in Russia the correlation coefficient between variables is 0.56 (Figure
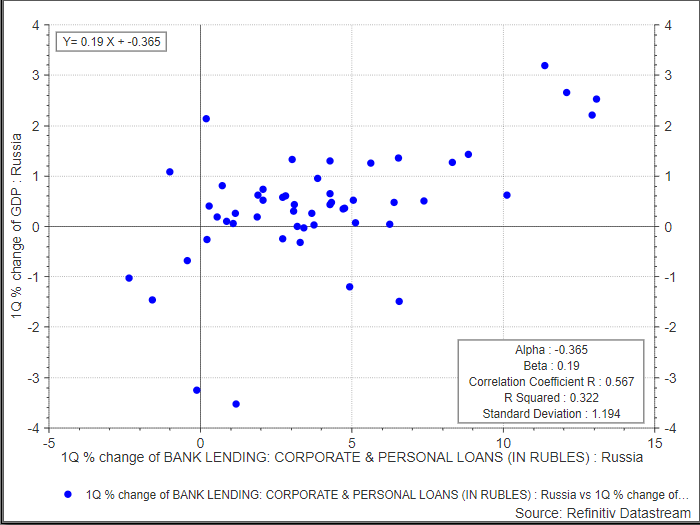
The above charts show the low efficiency of the Russian banking system. An important root cause of the poor efficiency of credit institutions is the low level of maturity of risk management. Mathematical models of risk assessment are the key to decision making. However, the uncertainty of the external environment and poor data quality lead to errors in the models used to assess the credit rating of clients, thus, the quality of the loan portfolio decreases (Pomulev & Kalmykov, 2021).
The works presented on the declared theme are not enough to conclude that the theme is worked out. Among the publications, which are devoted to methods of market analysis, including the use of modern technologies, it is worth noting the following: Bataineh et al. (2020), Ganguly et al. (2011) and Mestre et al. (2020).
The topic of credit risks is dedicated to the works of such authors as (Chursin et al., 2019; Ferretti et al., 2019; Gadzo et al., 2019; Kalmykov & Pomulev, 2021; Pomulev & Kalmykov, 2021; Qayyum & Riaz, 2018; Samorodov et al., 2019). However, there are not enough publications devoted to specific demand and supply factors on the composite materials market.
Research Questions
Fundamental factors of supply and demand in the conditions of changing economic mesocycles. Influence of debt burden of composite materials producers on the supply factor in the market. Specifics of the composite materials production industry. Exogenous variables, which are leading indicators that signal the dynamics of the market of aircraft products and related markets. Factors that affect the cost of finished products and raw materials of enterprises engaged in the production of composite materials. Investigation of approaches to modeling the market dynamics under conditions of uncertainty. Development of the multifactor model for forecasting the future dynamics of the composite materials market.
Purpose of the Study
The purpose of the research is to develop a toolkit for analysis of the composite materials market and to develop a model for forecasting volumes of the aviation and pipe products market (as key segments of composite materials consumption).
Tasks of research:
- study the specifics of projects of enterprises in the sphere of composite materials;
- analyze supply and demand factors in composite materials market modeling;
- build a forecast model of dynamics of aircraft and pipe markets (as key segments of consumption of composite materials market products);
- develop a price forecast model for composite materials market products.
Research hypothesis: external factors from the supply and demand side in the long term have a determining influence on the dynamics of the composite materials market nominal value.
Research Methods
The correlation-regression analysis method is used as the main method for the significance of factors. An important advantage of correlation-regression analysis is the fact that it allows to identify the relationship between factors and regressor on the retrospective data and determine the degree of this influence with a transparent interpretation of the force of influence of each individual indicator.
The model can be schematically presented in the following way:
Y=f(x)+e (1)
where
Y - target predicted indicator (market volume)
f - form of dependence of the target attribute on factors
x - set of factors, independent variables that affect the target attribute (macroeconomic parameters)
e - model error
Depending on the complexity of the modeled process, it is possible to build multi-dimensional regression models, which allows you to take into account the diversity of factors. Economic and logical analysis methods are used to select factors. The empirical basis of the study was provided by enterprises engaged in the production of composite materials in Russia, Europe and the USA, obtained from official statistical sources and as a result of practical work of the authors.
Findings
We solve the task of modeling the composite materials market in several stages:
1. Analysis of demand factors in the composite materials market.
2. Analysis of factors from the composite materials market supply side
3. Forecast of aviation and pipe products market volumes.
Despite a general slowdown in the growth rate of the global market, under the baseline scenario, the size of the global composite materials market will grow from USD 74.0 billion in 2020 to USD 112.8 billion by 2025, with an average annual growth rate of 8.8%. The composite materials industry will grow as the demand for high performance materials increases. The automotive and transportation industries account for the largest share of the aggregate demand in the composite materials market by volume. Demand for composite materials is expected to decline in 2020 due to the negative impact of the COVID-19 pandemic. However, the end of isolation and recovery in end-use industries will stimulate demand over the forecast period. Next, we will study the factors on the supply and demand side in the composite metals market and their specifics, as well as build a factor model for the long-term development of the market.
Demand side factors. As we mentioned earlier, composite materials are used in a wide range of sectors and one of the key ones is the aerospace and defense sector. The global aerospace and defense materials market is projected to reach USD 23.82 billion by 2027, with a CAGR of 4.21% over the forecast period.
According to the International Air Transport Association (International Air Transport Association, 2019), the demand for air travel in 2018 increased by 7.4% compared to the 2017 level. According to IATA, air passengers accounted for 81.9% of the workload of aircraft, and cargo - 49.3%. The growing use of aircraft for passenger and cargo transportation requires the use of efficient materials in the manufacture of aircraft components. North America, especially the United States, has a strong domestic air travel industry, with the country ranking second in terms of passenger air travel in 2018, according to IATA statistics. This, combined with huge spending on military aviation, will allow the region to dominate the aerospace and defense (primarily composite) market in the coming years. Market size in North America in 2019 was US $ 9,878.83 million.
In Europe, market growth is based on France's ability to produce large volumes of commercial as well as military aircraft. The market in the Asia-Pacific region will grow with increased investment by India and China to expand their own aircraft manufacturing and development capabilities. Manufacturing costs and one-time development continue to limit the distribution of composite materials in several areas. Fiberglass composites have dominated the global composite industry in terms of volume and value over the past 10 years. Fiberglass is in high demand because it is not expensive and has excellent physical and mechanical properties such as strength, durability, flexibility, stability and light weight. Fiberglass composites are mainly used in wind power, pipe and tank manufacturing, electrical and electronic engineering, construction and infrastructure. However, due to COVID-19 in the above-mentioned industries, there will be a decrease in demand for composite materials due to a decrease in demand for the supply of aircraft, a decrease in the number of wind turbines, as well as car sales, a contraction in demand in the oil and gas industry. The demand for composite materials will grow with the recovery in demand in the end-use industries.
Other growth drivers in this market are the growing demand for corrosion and chemical resistant materials in the construction and pipe and tank industries. The global pipe and tank market is a multi-trillion dollar industry. The Asia Pacific region will provide future growth for this market as sales are supported by continued economic growth and infrastructure development in the region. Given the size of the market and the prospects for its further expansion, the production of GRP pipes and tanks represents an attractive opportunity for OEMs, suppliers of materials and components (primarily suppliers of composite materials). The key application of composite materials in the described segment is corrosion protection. Corrosion is a major problem in the production of GRP pipes and tanks. This problem can be found in a wide variety of applications, from chemical storage tanks to offshore plants, sewage treatment plants and paper mills to underground oil storage. The total cost of metal corrosion in the US alone is estimated at $ 280 billion. Thus, we have identified the demand-side factors influencing the dynamics of the composite materials market.
Supply side factors. The basis of the multivariate forecasting model from the side of supply factors is the factor of consolidated leverage of companies producing composite materials. Leverage is calculated based on the following components:
The consolidated Net Debt / EBITDA ratio - the average for the companies in the sector is about 3.91).
Average ISCR / EBITDA - about 3.39.
Average value of the current liquidity ratio is 1.38.
Average inventory turnover period is 175 days.
For modeling purposes, the consolidated average of these factors is used, adjusted for weight correction factors.
It seems appropriate to use two indicators as factors that can help predict the market volume:
PMI Manufacturing Sector.
S&P GSCI Commodity Total Return.
Forecasted dynamics of the aviation market and related markets.
Reduced leverage factor.
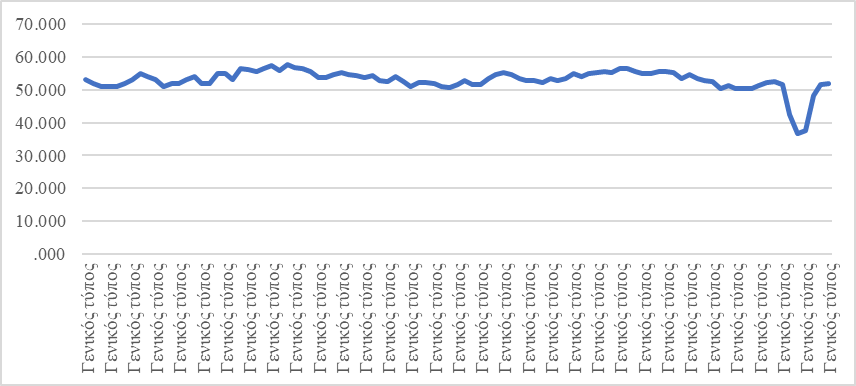
The PMI Manufacturing Sector (US Manufacturing Activity Index) is an index that is based on a survey of purchasing managers in manufacturing. The index refers to leading indicators and allows you to evaluate the value of whether the activity of their enterprises has grown, decreased or remained at the same level (Kholodenko, 2019). According to the Markit (2015) Economics methodology, an index value below 42 for an extended period of time may indicate an impending recession.
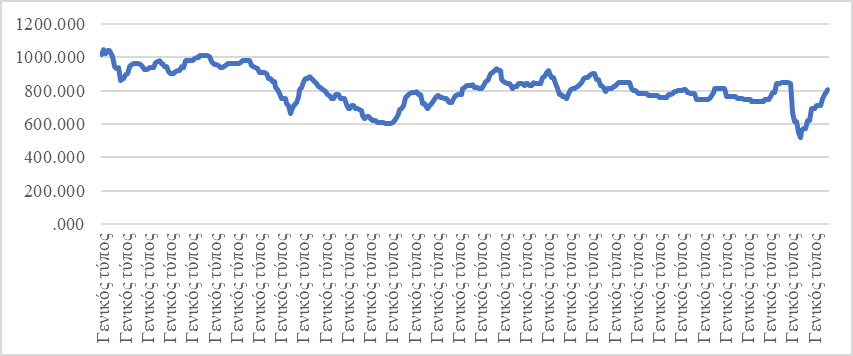
The S&P Index is also a leading indicator that indicates the general situation of key enterprises, which will allow forecasting the value of real assets. It is assumed that the PMI index is leading, if its dynamics is negative, then after a certain time lag it will be reflected in the stock market indicators. As of the current date, the Manufacturing Sector USA PMI has dropped to a record 36.6 since the 2008 crisis Figure
The correlation between the S & P500 and the PMI over the time horizon since 2012 is a correlation coefficient of 0.38. A summary information of the interrelationship analysis is presented in Table
6.2. Distinctive feature of the composite materials industry is the diversity of its constituent subbranches. According to OKVED, the enlarged form differs in the production of basic chemicals, as well as the production of intermediate and final products
The main chemicals for the production of composite materials include: alcophene, dibutyl phthalate, dioctyl phthalate, diphenylolpropane, methyl tetrahydrophthalic anhydride, polyethylene polyamine, roving, PVC suspension resin, PVC emulsion resin, epoxy resin, epoxy resin ED-16, ED-20. From the manufacturer's point of view, the final product can be a product at any stage of the production chain from primary products of raw materials processing (e.g. epoxy resins, reinforcing material, fillers, additives, etc.) to the final products.
When forecasting market prices for products or raw materials, it is necessary to take into account a whole group of parameters that are related to the market situation, purchasing power of the population and other macroeconomic parameters. Often, indexes cannot reflect the full range of factors and market expectations. Therefore, financial modeling can predict the sale price of a product or the price of a unit of raw materials (depending on the structure of the product) in the cost of production using correlation-regression analysis.
This is justified if the industry specialization in a credit institution or fund is properly developed and access to price information databases such as Thomson Reuters Eikon, 2020 is available (Thomson Reuters Eikon, 2020). As an example of price forecasting, polyvinyl chloride (PVC - Polyvinyl Chloride (Poly Vinyl Chloride) Suspension USA Fas Houston United States Dollar Per Metric) is used, a synthetic substance is actively used in the chemical industry. Dynamics of polyvinyl chloride cost is presented at Figure
As factors that can help to predict the price of the material, it seems appropriate to use two indicators:
PMI Manufacturing Sector;
S&P GSCI Commodity Total Return.
The observation period of the indicators was 96 months from June 2012 to present.
The revealed dependence indicates a moderate correlation with the resulting S&P factor index (0.55) and a low correlation with PMI index (0.25) (Table
Y (forecasted PVC) = 474.0779 + 0.0981 (Х1) + 0.1261 (Х2) (2)
The economic sense of the equation lies in the ability to predict the price of PVC products in steps per month, taking into account the leading S&P500 and PMI indices.
Prerequisites and limitations of using models:
The model depends on the quality of the predicted values of the factors that affect the resulting indicator.
The model does not take into account regulatory and behavioral factors.
Price forecasting using the model gives a more accurate result for up to 12 months. Forecasting for a longer period will require calibrating the model at six-monthly intervals, which is possible with systematic project management.
Conclusion
We have calculated the statistics for building a regression model of composite materials market forecast dynamics for each of the above demand factors. Below we present the resulting statistics for the selected market segments. Historical and forecasted market dynamics for aircraft products are shown in the Figure
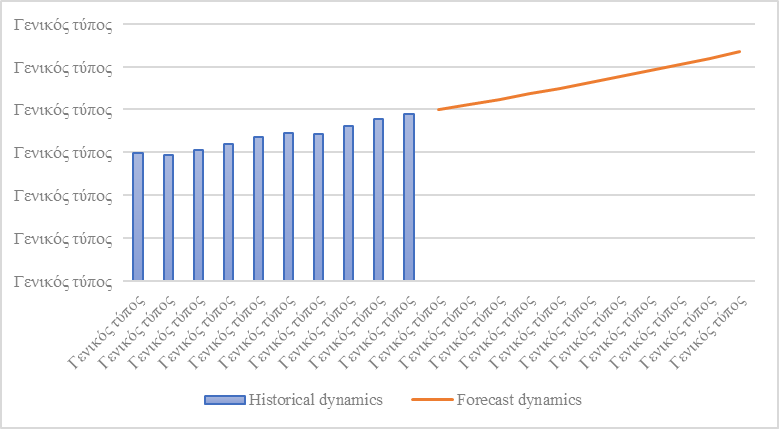
The global commercial aircraft market, estimated at US$191.1 billion in 2018, is expected to grow at an average annual growth rate of 2.93% to US$255.1 billion by 2028 (Figure
The cut-off parameter coefficient for the given factor is of the order -9.57, the factor coefficient is 0.19. The coefficient of determination of the given factor with dynamics of the composite materials market is about 0.96. Taking into account the given regression statistics, we conclude that we will use this factor to construct a multifactor regression. Historical and forecasted dynamics of the pipe market (Figure
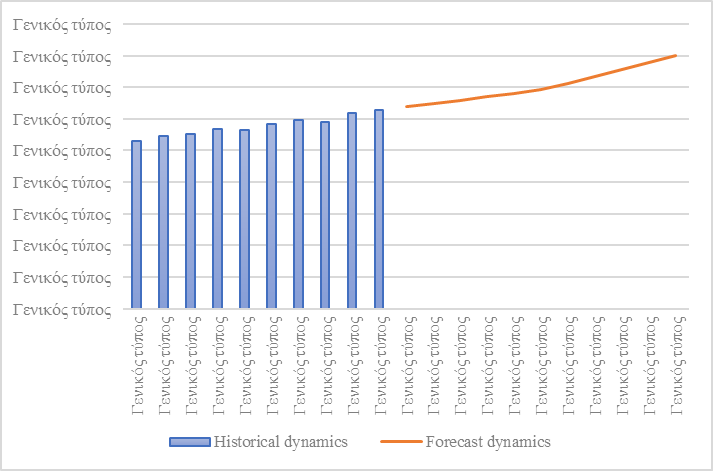
The global market for pipe products is expected to reach $80 billion by 2030, showing a 1.6% CAGR year-on-year (Figure
Acknowledgments
We express our great gratitude to our relatives and friends for their patience. Special thanks to the management of the Financial University under the Government of the Russian Federation for technical support.
References
- Bataineh, A. S., Mizouni, R., Bentahar, J. E., & Barachi, M. (2020). Toward monetizing personal data: A two-sided market analysis. Future Generation Computer Systems, 111, 435-459.
- Bogatyrev, S.Y. (2018). Testing the value function of the prospect theory on Russian M&A market. Journal of Reviews on Global Economics, 7, 731-739.
- Chursin, R. A., Yudin, A. V., Grosheva, P. Y., Filippov, P. G., & Butrova, E. V. (2019). Tool for assessing the risks of R&D projects implementation in high-tech. IOP Conference Series: Materials Science and Engineering, 476, 012005.
- Ferretti, C., Gabbi, G., Ganugi, P., Sist, F., & Vozzella, P. (2019). Credit risk migration and economic cycles. Risks, 7, 109.
- Fisher, R. A. (1922). On the interpretation of χ2 from contingency tables, and the calculation of P. Journal of the Royal Statistical Society, 85(1), 87-94.
- Gadzo, S. G., Kportorgbi, H. K., & Gatsi, J. G. (2019). Credit risk and operational risk on financial performance of universal banks in Ghana: A partial least squared structural equation model (PLS SEM) approach. Cogent Economics & Finance, 7(1), 1589406.
- Ganguly, I., Eastin, I., & MacLachlan, D.L. (2011). An analysis of the US decking materials market: Perceptual mapping approach. Canadian Journal of Forest Research, 41(4), 669-681.
- International Air Transport Association (2019). Slowing demand and rising costs squeeze airline profits. https://www.iata.org/en/pressroom/pr/2019-06-02-01/
- Kalmykov, V.V., & Pomulev, A.A. (2021). Criteria for assessing the effectiveness of monetary policy of the state. In S. I. Ashmarina, J. Horák, J. Vrbka, & P. Šuleř (Eds.), Economic Systems in the New Era: Stable Systems in an Unstable World. Lecture Notes in Networks and Systems, 160 (pp. 580-589). Springer.
- Kholodenko, O. (2019). PMI business activity index. How they are useful for investors. BKS Express. https://bcs-express.ru/novosti-i-analitika/indeksy-delovoi-aktivnosti-pmi-chem-oni-polezny-dlia-investorov
- Markit (2015). Markit PMI. https://www.markiteconomics.com/Public/Home/PDF/PMI_Brochure_RUS
- Mestre, G., Portela, J., San Roque, A. M., & Alonso, E. (2020). Forecasting hourly supply curves in the Italian day-ahead electricity market with a double-seasonal SARMAHX model. International Journal of Electrical Power & Energy Systems, 121, 106083.
- Pomulev, A. A., & Kalmykov, V. V. (2021). Methodological aspects of credit portfolio management in financing innovative projects. In S. Ashmarina, V. Mantulenko, & M. Vochozka (Eds.), Engineering Economics: Decisions and Solutions from Eurasian Perspective. Lecture Notes in Networks and Systems, 139 (pp. 372-383). Springer.
- Qayyum, A., & Riaz, K. (2018). Incorporating credit quality in bank efficiency measurements: A directional distance function approach. Journal of Risk and Financial Management, 11(4), 78.
- Samorodov, B. V., Azarenkova, G. M., Golovko, O. G., Miroshnik, O. Y., & Babenko, M. V. (2019). Credit risk management in the bank’s financial stability system. Financial and Credit Activity: Problems of Theory and Practice, 4(31), 301-310
- Thomson Reuters Eikon (2020). Refinitiv eikon. https://www.refinitiv.ru/ru/products/eikon-trading-software
Copyright information

This work is licensed under a Creative Commons Attribution-NonCommercial-NoDerivatives 4.0 International License.
About this article
Publication Date
30 April 2021
Article Doi
eBook ISBN
978-1-80296-105-8
Publisher
European Publisher
Volume
106
Print ISBN (optional)
-
Edition Number
1st Edition
Pages
1-1875
Subjects
Socio-economic development, digital economy, management, public administration
Cite this article as:
Pomulev, А. A., Kalmykov, V. V., & Nikonova, I. A. (2021). Methodological Aspects Of Multivariate Analysis Of Innovative Product Markets. In S. I. Ashmarina, V. V. Mantulenko, M. I. Inozemtsev, & E. L. Sidorenko (Eds.), Global Challenges and Prospects of The Modern Economic Development, vol 106. European Proceedings of Social and Behavioural Sciences (pp. 181-191). European Publisher. https://doi.org/10.15405/epsbs.2021.04.02.23