The Modern Economic Structure Of Russia
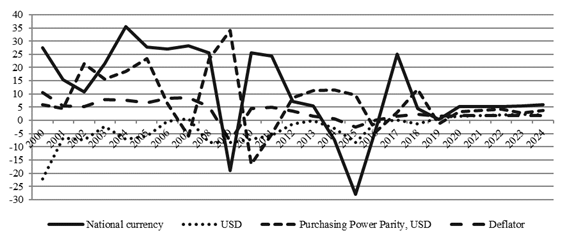
Figure 2: The difference in GDP growth per capita and GDP, GDP deflator, current prices, %. Source: calculated and built according to the World Economic Outlook Database, April 2019, the International Monetary Fund (IMF). URL:https://www.imf.org

