
Us Stock Market Sliding Verification Of Profit-Risk Model


Abstract
The article is devoted to the development of a “Profit-Risk” model which may be considered as an affordable and suitable basis for the practical needs of evaluating the investment portfolio of securities. The main goal of this article is to create an investment portfolio assessment algorithm based on mathematical analysis methods that will allow potential investors to make a more informed decision about investing. The proposed model is based on the basic principles of portfolio analysis. The main method is the sliding verification method. The study confirmed that sliding verification allows not only to obtain greater profitability in comparison with both the path-trough verification method and the average market indicator reflected by the S&P 500 index, but also significantly reduce the volatility of the criteria considered in this article showing the lowest risk ratio to profitability. Testing the model on an independent material proved that the proposed method of sliding verification improves the quality of forecasting the profitability and risk of the investor portfolio and, as a result, improves the quality of investment decisions. The annual yield of the model in the sliding verification mode reaches 25 %, while the S&P 500 index showed an annual yield of only 15 %, i.e. the Profit-Risk model has significantly “overtook the market”. The ratio of the won transactions (time intervals) to lost is 11: 1.
Keywords: Riskprofitabilitymodel “Profit-Risk”portfolio analysisinvestments attraction evaluationsliding verification
Introduction
The increasing use of derivative financial instruments and trading volumes, make the modern financial system more and more inefficient, unstable and diminish the hopes for the real management of the financial sector in the long term. Today, an impressive amount of capital has been localized in the financial sector which, firstly, has led to even greater growth in the number of transactions and their volumes, and secondly, has attracted a large number of amateurs in the field of investment. Thus, taking into account the instability and volatility of the global financial system, and in particular in the United States, both in the long- and short- term ones, we should pay special attention and caution to the process of investing money in the stock market.
Problem Statement
A significant number of works by foreign authors are devoted to the analysis of profitability and forecasting the risk level of the investor's portfolio in the financial markets: Markovitz (1952); Sharp (2016); Mandelbrot (1963); Engle (1982); Bollerslev. (1982); Fama (1984) and etc. The insufficient knowledge of the direction of the modeling profitability and forecasting the risk of the investor’s portfolio, as well as the sufficient difficulty of direct implementation of the Markovitz model in investment practice, conditions the necessitates, relevance and practical significance of the development of fairly simple, and at the same time, effective models of “Profit-Risk”.
Research Questions
The importance and relevance of this problem determined the research objectives: to analyze the approach to the modeling profitability and forecasting the risk of an investor’s portfolio in financial markets; to develop a forecasting model for the profitability and risk of the investor's portfolio in financial markets; to conduct an adequate assessment of the effectiveness of the “Profit-Risk” model on independent materials.
Purpose of the Study
The purpose of this study is to conduct a correlation analysis of the dynamics of the profits of the studied stocks of the US stock market for an objective assessment of the level of diversification of portfolios synthesized in the mode of sliding verification. Based on this analysis and the formation of a synthesized portfolio, it is supposed to create an algorithm for forming an investment portfolio using the “Profit-Risk” model which will allow investors to get the maximum profit with minimal risk of investing their investment funds.
Research Methods
Implementing the set goals, the historical data on the stock returns of the 50 largest companies issuing the US stock market for the period from January 1, 2013 to January 12, 2017 were analyzed. The data were exported from the investment portal finam.ru. The time interval (bar) is one month. Since the authors do not have representative information about the dividends paid, stock returns were calculated based on their exchange rate dynamics.
The selection of historical data in chronological order is divided into two disjoint subsamples: training and verification. Subsequent analysis is based on the obtained values of the expected return, which is calculated as the arithmetic average of stock profit, and risk, which implies a root from the dispersion. The calculated expected profit and risk are rounded to one decimal place. The analysis was carried out in full accordance with the approach proposed by the founder of modern portfolio theory G. Markowitz, where the author proposed a new approach to the study of the effects of investment distribution risk, correlation and diversification of expected investment income (Dodie, 2007; Markovitz, 1952; Sharp, 2016, etc. ), to the methodology of constructing a “winner model” (DeBondt & Thaler, 1985; Jegadeesh & Titman, 1993) and to the method of O`Shaughnessy (2005).
The paper implements a sliding verification method, the essence of which is as follows: to calculate the values of profitability and risk, with the aim of their subsequent placement on the scatter chart and direct selection of shares of those companies that will subsequently be included in the “first” portfolio, a time period of 48 months was used (January 1, 2013–December 31, 2016). The size of the training sample was selected in accordance with the recommendations of Fama (1988). Further, when switching to the analysis of shares that may be included in the “second” portfolio (February 2017), the very first month of the training sample were excluded, namely January 2013 and January 2017 was included. This procedure was repeated 12 times, i.e. for each month of 2017. Portfolios were reviewed at intervals of one month based on the size of the selected time interval. Thus, we get a moving sample, which implies a regular (monthly) review of the investment portfolio.
Thanks to the considered “time-moving” historical data interval which implies the exclusion of outdated profitability indicators and the inclusion of more “fresh” data in the analysis, the investor gets the possibility to track the trend of movement of not only the stock prices of each individual company on the stock market from among those considered, but also the main parameters of the “Profit-Risk” model. First of all, this is profitability, risk and the ratio of profitability to risk. Investor’s attention should be drawn to identified downward or upward trends according to the above criteria. Moreover, the upward trends in profitability and the ratio of profitability to risk together with a decreasing trend in risk should inspire optimism, and the reverse situation means that the situation in the market is changing and not for the better for the investor.
On the initial scatter diagrams constructed below which are formed sequentially for all investment portfolios the risk is located along the abscissa axis, and the expected return on securities of the issuing companies under consideration is plotted along the ordinate axis. Then, according to the algorithm presented below, for each initial set, a synthesis of subgroups of leading companies is performed, i.e. the simplest investment portfolios with equal weights for January, February, December 2017.
The synthesis of the sequence of subgroups of leading issuers is as follows: at each step of the algorithm (for each month under consideration), the shares of the following companies are excluded:
1) show a lower value of profitability at equal risk levels (two values of expected profitability are considered equal if the absolute value of the difference in their values does not exceed 0.1 (%));
2) or, conversely, are characterized by a high-risk value with equal profitability values;
3) also, stocks that demonstrate the notoriously worse risk-profit ratios, the so-called emissions, are excluded from further analysis (Gercekovich, 2017).
Thus, within the framework of sliding verification a monthly update of the portfolio is implied, this operation which involves a selection of the leading stock market issuers from the set of issuing companies under consideration, should also be repeated for each subsequent investment portfolio drawn up for a specific month of the verification sequence (Gercekovich & Babushkin, 2019)..
Findings
The table
The fifth column of table
The absolute leaders whose shares were reflected in each of the constructed portfolios throughout the entire investment horizon, were the following companies: Adobe Systems Inc., 3M CO, Applied Materials Inc, Microsoft Corp.
After twelve repetitions of the above algorithm, it was noted that when placing the selected shares included in the investment portfolio on the dispersion chart in each test month, except for the summer months: July, August and September, there was a visible division of the leading companies into two clusters. As an illustration of the above, we present the results of the synthesis of a group of leading companies for March 2017 (Figure
1. is characterized by significantly lower risk volatility with a relatively equal range of profitability variability than the second (or lower right) one (Table
2. significantly greater angle of inclination in the model “Profit-Risk”;
3. a higher value of the coefficient of determination according to the model "Profit-Risk".
The presence of two clusters makes it necessary to build a profit-risk model for each cluster separately (Gercekovich, 2017).
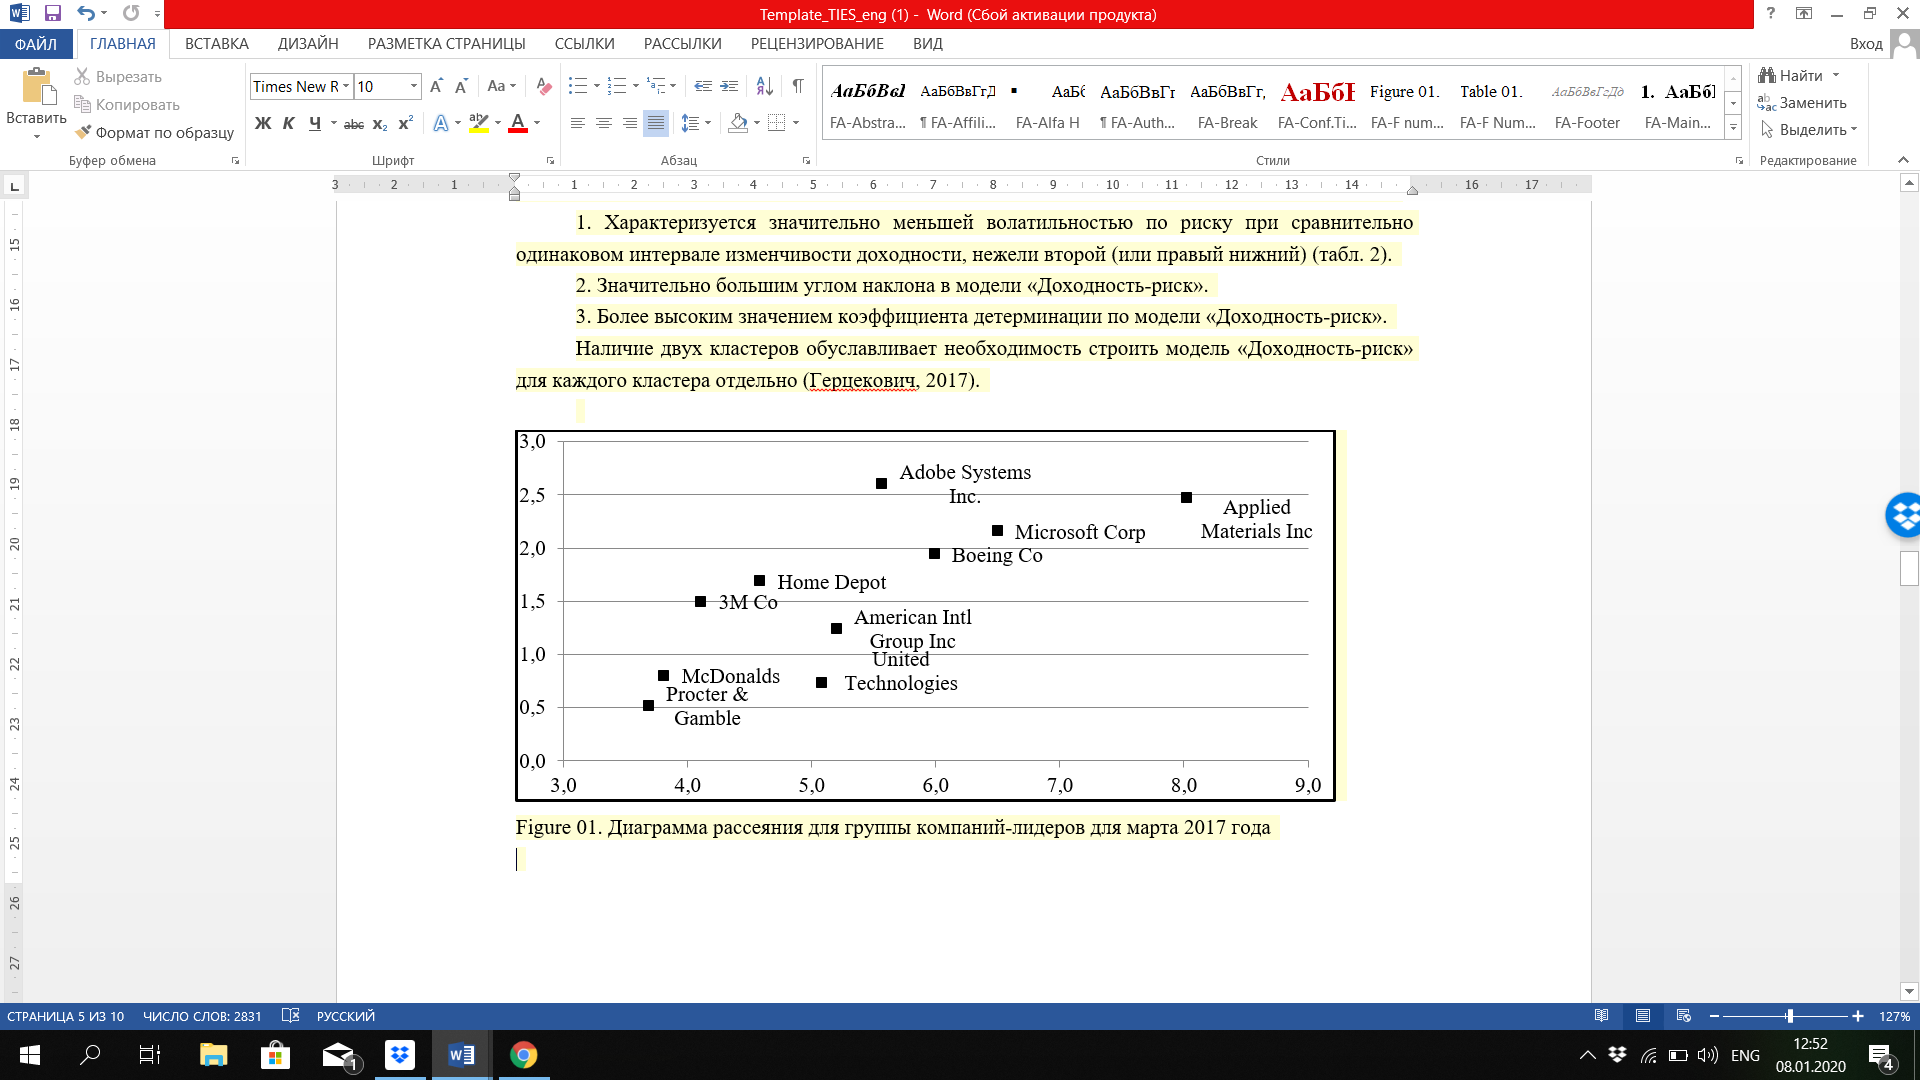
After a thorough analysis of each of the clusters, the authors came to the conclusion that the first cluster (top left) includes highly diversified companies both in terms of goods, work, services and territorial characteristics (as, for example, in the case of McDonalds). It can significantly reduce the expected risk. Moreover, all companies offer consumer goods, i.e. potential customers are both ordinary citizens and large organizations. Thus, the demand for these products is practically independent of the economic situation, purchasing power, consumer price index, income of citizens and other economic indicators.
The second cluster (lower right) also includes large international companies engaged in various fields of activity that can be combined into groups such as software development, insurance, financial services, pharmaceuticals, military order servicing, and the support and provision of telecommunication services systems. These companies have a relatively greater risk compared to the first cluster for the reason that they cover a smaller range of offered goods, works, services, i.e. include fewer areas of activity, or serve only large state-owned companies and orders. This means that demand in this situation is more susceptible to both economic and political factors, and therefore the market is less stable, and prices are more volatile. In addition, a significant number of companies from this cluster operate either directly in the United States or in a limited number of other countries (Wells Fargo, Travelers Comp., American Intl Group Inc., United Technologies, American Tower Corp. Cl A, etc.).
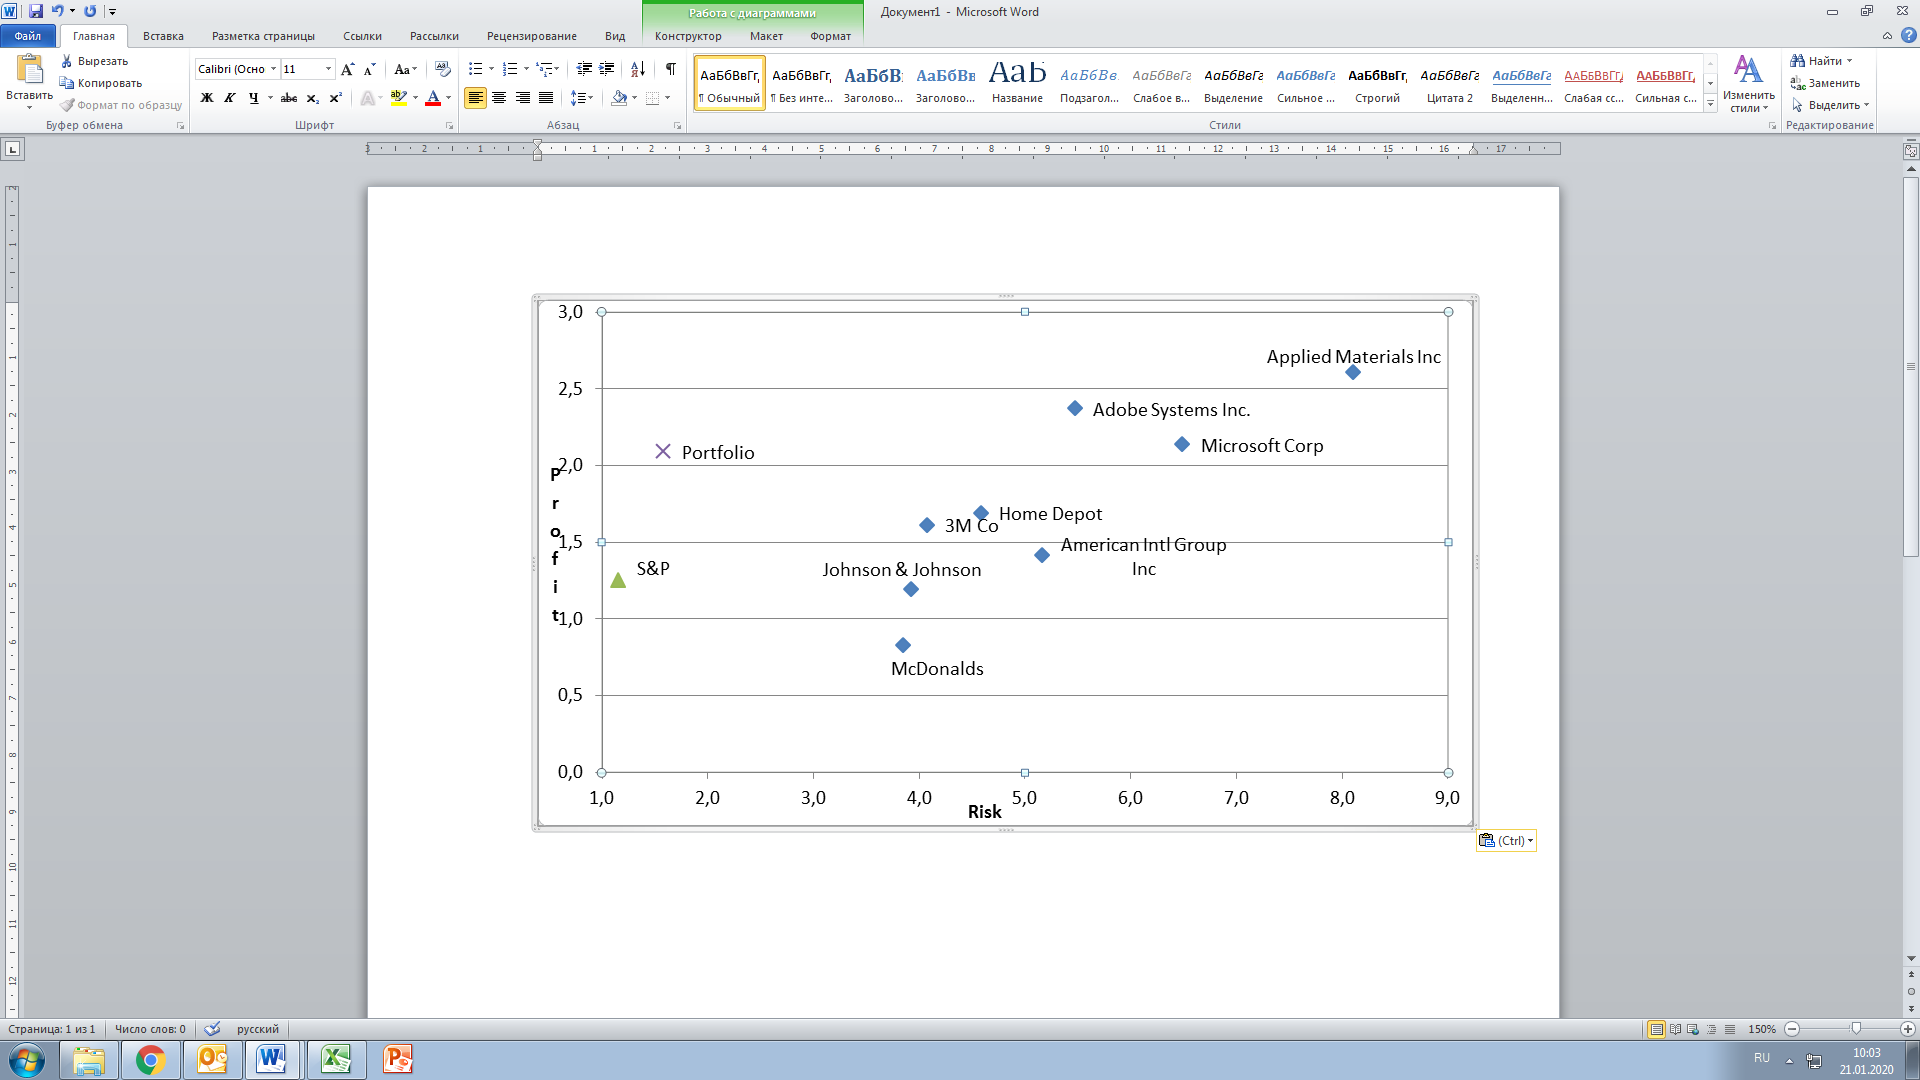
The confirmation of the theory that diversified portfolio composed of a certain number of shares will always (the so-called “Markowitz’s miracle”) be to the left to the abscissa risk axis than any individual share from this portfolio. It is demonstrated in this work (Figure
The comparative results of profit accumulation of two verification methods are shown in Figure
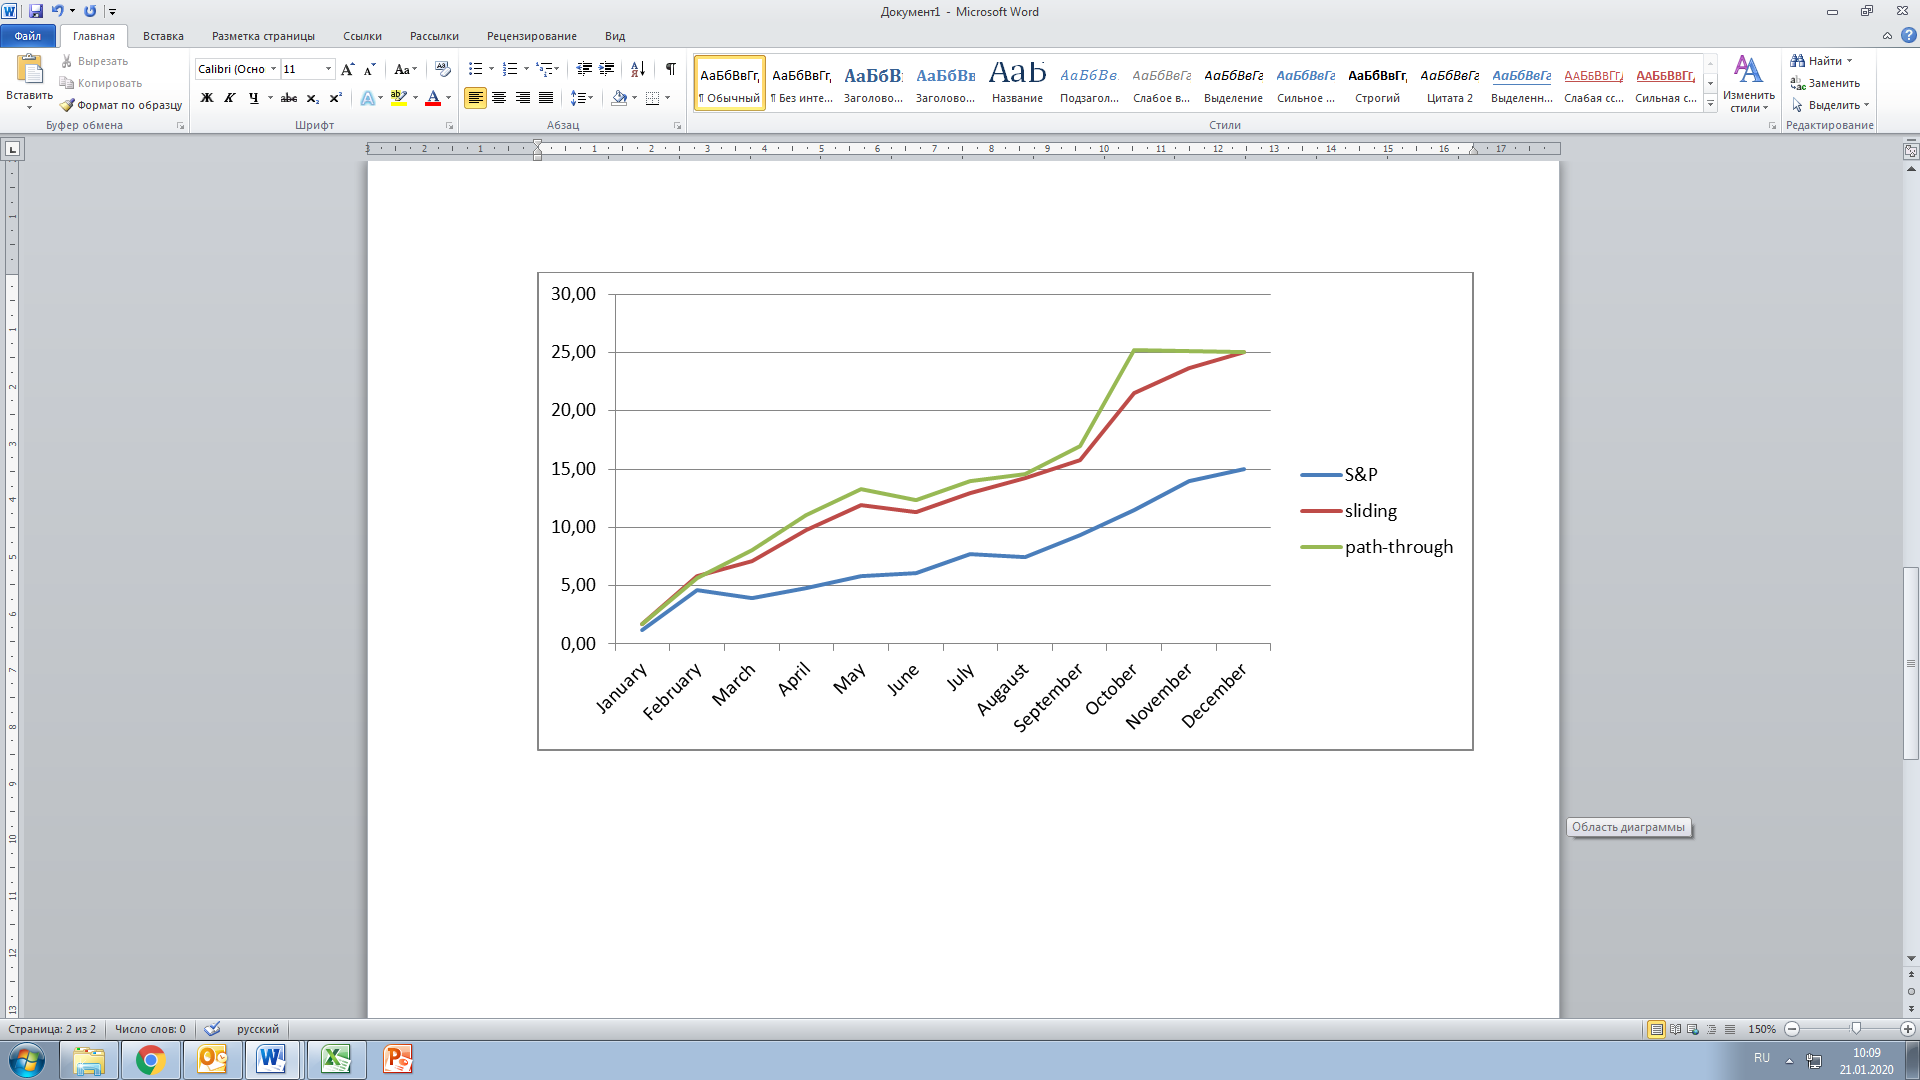
Thus, the total annual return on the portfolio with path-through verification (let's call it Portfolio A) was 25 % with a final Winn / Loss ratio of 9: 3, where 9 is the number of months showing a positive profit on the portfolio (similar to technical analysis we attribute these results to the winning ones) and 3 – negative. The dynamic portfolio (Portfolio B), synthesized using path-through verification, also showed 25.08 % of annual profit with a total ratio of 11: 1, showing a negative profit (0.63 %) only in June. In the year under consideration, the market as a whole, represented by the Standard & Poor’s 500 index, recorded a negative value of profitability for two months. The cumulative annual revenue was 15 %.
Spatial and temporal analysis of sliding verification results:
1) Out of the examined issuers, the following companies showed the most stable results in terms of profit, risk and the ratio of profit to risk: Adobe Systems Inc., 3M Co, Applied Materials Inc, Microsoft Corp – these companies were included in all twelve synthesized portfolios. Joined Johnson & Johnson's portfolio was included ten times. In addition, Home Depot, McDonalds and Boeing were selected 9 times in the portfolio.
2) In terms for the time, February turned out to be the most successful (the average profit among leading companies was 4.17 %) and October (5.70 %), while in June and August the results were negative.
Today, billionaires, Nobel laureates, best-selling authors, professors, financial world gurus and investment titans (Arnold, 2014) unanimously argue that for those who seek to reduce risk while increasing profits, effective diversification is a mantra. Diversification not only reduces the degree of risk, but also allows you to get the maximum possible (in such conditions) income. In fairness, it should be noted that a widely diversified investment portfolio helps to minimize its own (unsystematic), but not market (systematic) risk. Berc and DeMarzo (2013) so, professors at Stanford University, in their book “Corporate Finance” (2013) (following G. Markowitz) also noted that the volatility of a larger combination of stocks will be less than the average volatility of these stocks taken separately. That is why, a diversified portfolio almost always has a lower risk level than any single share, included in the portfolio.
Conclusion
For an objective assessment of the diversification level of portfolios synthesized in the mode of sliding verification (Gercekovich, 2017) a correlation analysis of the dynamics of returns on the studied stocks of the US stock market was carried out. The obtained results indicate that the synthesized portfolios may be considered as highly diversified, since the maximum correlation coefficient among all calculated correlation coefficients is only 0.56. The proposed investment portfolio formation algorithm, using the Profit-Risk model, has been tested in the sliding verification mode on independent material. Sliding verification allows not only to obtain greater profitability in comparison with both the path-through verification method and the average market indicator reflected by the S&P 500 index, but also significantly reduces the volatility of the criteria considered in this article showing the smallest ratio of the risk to profit.
It is assumed in the future, to estimate the optimal length of the training sample based on historical data (Gercekovich & Babushkin, 2019), namely, considering the length of the training sample as a parameter of the Profit-Risk model, to identify its value by which the most effective investment policy is formed on an independent material.
References
- Arnold, G. (2014). Greate investors. Moscow: Alpina Publication.
- Berc, J., & DeMarzo, P. (2013). Corporate finance. Prentice Hall.
- Bollerslev, T. (1982). Generalized Autoregressive Conditional Heteroskedasticity. Journal of Econometrics, 31(3), 307–327.
- DeBondt, W. F. (1985). Does the stock market overreact? Journal of Finance, 40, 793–805.
- Dodie, Z. (2007). Finance. Moscow: Villiams.
- Engle, R. F. (1982). Autoregressive Conditional Heteroskedasticity with Estimates of the Variance of United Kingdom Inflation. Econometrics, 50(4), 987–1007.
- Fama, E. F. (1984). Forward and spot exchange rates. Journal of Monetary Economic, 14(3), 319–338.
- Fama, E. F. (1988). Permanent and Temporary Components. Journal of Political Economic, 96, 246–273.
- Gercekovich, D. A. (2017). Formation of an optimal investment portfolio for a complex of effective portfolios. Bulleten of Moscow University Series Economic, 5, 86–101.
- Gercekovich, D. А., Babushkin, R. V. (2019). Dynamic Portfolio Analysis of World Stock Indexes. World of Economics and. Management, 19(4), 14-30.
- Jegadeesh, N. (1993). Returns to buying winners and selling losers: Implications for stock market efficiency. Journal of Finance, 48(1), 65–91.
- Mandelbrot, B. (1963). The Variation of Certain Speculative Prices. Journal of Business, 36, 394–419.
- Markovitz, H. M. (1952). Portfolio selection. Journal of Finance, 7(1), 77–91.
- O`Shaughnessy, J. (2005). What Works in Wall Street. McGraw-Hill, XVI.
- Sharp, U. (2016). Investment. Мoscow: INFRA-М.
Copyright information

This work is licensed under a Creative Commons Attribution-NonCommercial-NoDerivatives 4.0 International License.
About this article
Publication Date
07 December 2020
Article Doi
eBook ISBN
978-1-80296-095-2
Publisher
European Publisher
Volume
96
Print ISBN (optional)
-
Edition Number
1st Edition
Pages
1-833
Subjects
Management, human resources, resource efficiency, investment, infrastructure, research and development
Cite this article as:
Gercekovich, D. A., Gorbachevskaya, E. Y., Tonkikh, A. V., Arkhipkin, O. V., & Shilnikova, I. S. (2020). Us Stock Market Sliding Verification Of Profit-Risk Model. In A. S. Nechaev, V. I. Bunkovsky, G. M. Beregova, P. A. Lontsikh, & A. S. Bovkun (Eds.), Trends and Innovations in Economic Studies, Science on Baikal Session, vol 96. European Proceedings of Social and Behavioural Sciences (pp. 258-265). European Publisher. https://doi.org/10.15405/epsbs.2020.12.34