
Augmented Gravity Model of the Competitiveness of Renewable Energy Exports in Malaysia


Abstract
The main objectives of this paper are to investigate the relationship between trade flows and technological development with regard to environmental technologies, and estimate empirically the effect of renewable energy demand on the competitiveness of domestic manufacturing firms in Malaysia. By using a gravity model of international trade with a balanced dataset of 19 countries that have trade flows of renewable energy industries from Malaysia covering the period 2009-2017. The augmented gravity model shows that there is a positive evidence for the impact of environmental regulations on both the export of renewable energy industries and their competitiveness in Malaysia. Moreover, the results indicate that Porter hypothesis is valid, in this sense, CO2 emissions used as a proxy of environmental regulations, the results show that whenever the emission of CO2 in the destination countries decreases 1% the trade flows of renewable energy increases by 23.8% in Malaysia. The results indicate that if the competitive advantage increased in the destination country by 1 percent the trade flows of Malaysia will increase by 29.9 percent. The simulation model refers that the bilateral trade agreements between Malaysia and destination country could improve the trade flow by 32.2 percent. The policy recommends to expand the bilateral trade agreements with more countries (Brazil, Germany, and Mexico) that demand more renewable energy industries.
Keywords: Competitive advantagegravity modelrenewable energysolar PV industryCO2 emissiontrade flows
Introduction
Many economists would express their attitudes toward international trade in an even more positive manner. The evidence that international trade confers overall benefits on economies is very strong. By providing a bigger market, international trade allows producers to produce more cheaply, as producing a larger quantity usually lowers the costs. This aspect is important for all economies, particularly small economies, as they will have to produce everything expensively, if they cannot trade and have a bigger market. By increasing competition, international trade can force producers to become more efficient, insofar as they are not developing country firms that would get wiped out by vastly superior foreign firms.
As the scarcity of traditional energy sources and global warming are increasing the increased use of renewable energy has become an effective target for sustainable development. Many countries around the world have prioritized the development of renewable energy technologies with a range of policies and incentives. The manufacturing of these technologies has grown rapidly in recent years. The emergence of several rapidly industrializing economies in these industries has led to an increasingly globalized supply chain, and consequently an increase in the international trade of renewable energy technologies.
Modern renewables increased at more than twice the rate of the increase in global energy demand (REN21, 2017). During that time, the unit costs of renewable energy also declined, to the extent that solar PV and onshore wind power are now competitive with new fossil fuel generation in an increasing number of locations in the world (REN21, 2017).
The Export markets with the strongest potential, in the top level of the rankings, tended to have substantial opportunities across multiple subsectors (e.g., Canada, India, Mexico, Brazil, China, Chile, and Turkey). However, a few markets had overwhelmingly strong prospects in particular subsectors, due to unique driving factors such as the popularity of solar in Japan and France, solar PV in Malaysia, and abundance of wind farm projects in Uruguay (United Nations Environment Programme, 2018).
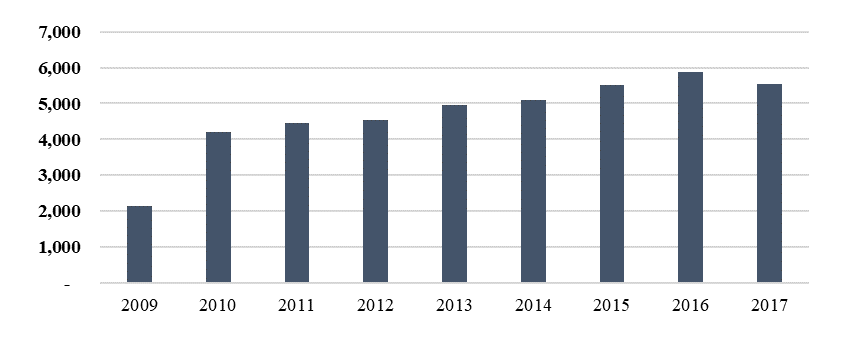
The value traded of solar PV and wind industry in Malaysia had increased during the period (2009-2017) around 8% and it formed 2.47% of total goods and services exports in 2017, while it was formed only 1.16% of total exports in 2009 as shown in Figure
Literature Review
A large body of literature had been trying to use a gravity model of international trade. Researchers using gravity model and analysed the determinants of transmission channels through which environmental technologies are exported to advanced and developing countries (Costantini & Crespi, 2008). Their results were consistent with Porter hypothesis: stricter environmental regulation, supplemented by strong national innovation system, were the crucial driver of export performance in the field of energy technologies. Another study also focusses on the effect of environmental policy stringency - such as environmental protection expenditures or energy and environmental tax revenues - on the export of environmental goods of a set of European countries. They found some evidence of competitive advantage in the new eco-industries markets and the related export opportunities for pioneering countries (Costantini & Mazzanti, 2012).
Groba (2014) focused on the effect of a regulatory framework supporting renewable energy, on the export success of solar PV from OECD countries. They find evidence for a positive effect and the Porter hypothesis was valid with early adopter of renewable energy policies gaining a comparative advantage. The results of this study are in line with the findings of (Costantini & Crespi, 2008; Groba, 2014; Kuik et al., 2019) in that the study also find some evidence of a positive effect of domestic environmental policy in importing countries on the competitive advantage of the renewable energy equipment manufacturing industry. In the wind industry (Lund, 2009) establishes a statistical correlation between large domestic markets and large export shares, while (Sawhney & Kahn 2012) find that domestic renewable power generation of the exporting countries play a significant positive role in export performance.
Research Questions
Based on the augmented gravity model this study raises the flowing questions:
What is the effect of increasing the free trade agreement for Malaysian trade flow of renewable energy?
What is the impact of degree of competitiveness of destination countries on Malaysian trade flow of renewable energy?
Purpose of the Study
The main purpose of this study are:
To estimate the effect of free trade agreement on the trade flow of renewable energy.
To estimate empirically the effect of renewable energy demand on the competitiveness of domestic manufacturing firms in Malaysia that produce renewable energy technologies. In this sense trade flows of renewable energy industries is representing one of the consequences of competitiveness in the industry.
Research Methods
The gravity model explains trade flows among countries by the market size, which is measured by GDP and the distance between countries (Tinbergen, 1962). Tinbergen (1962) used an analogy with Newton’s universal law of gravitation to describe the patterns of bilateral aggregate trade flows from the origin country (o) to the destination country (d) as proportional to the gross national products ( ) of those countries and inversely proportional to the distance between them :
Whereas G is a gravitational constant measured by the inverse of the value of world production. The general notation by Tinbergen returns to the Newton's Law if and .
The dependent variable is the bilateral export flows for wind and solar PV goods, from Malaysia (the origin country o) to the destination country
The estimated model is:
The variables are:
( ): The bilateral export flow of wind or solar PV goods in millions of US dollars.
: The gross domestic product in Malaysia in millions of US dollars are used to proxy economic sizes. It is taken from the World Development Indicator database of the World Bank.
: The gross domestic product in the destination countries in millions of US dollars are used to proxy economic sizes. It is taken from the World Development Indicator database of the World Bank.
: The demand in the destination country. It is expected that an increase in demand in the destination country will lead to more exports to that country.
: The natural logarithm of geographical distance weighted by population between two countries as computed by CEPII (Mayer & Zignago, 2011).
: A dummy variable of a common language between countries; it is given the value 1 when both countries have a common language, and otherwise it is given value 0.
: A dummy variable of a share border between Malaysia and destination countries; it is given the value 1 when both countries have a share border, and otherwise it is given value 0.
: A dummy variable represents the ASEAN regional trade agreements, it is given the value 1 for the country has a free trade agreement with ASEAN, and otherwise it is given value 0.
: A dummy variable represents bilateral trade agreements between Malaysia and destination country, it is given the value 1 for the country has a free trade agreement with Malaysia, and otherwise it is given value 0.
: The emission of carbon dioxide in the destination country is used as proxy of environmental regulations.
: The nature of competitiveness advantage in Malaysia and destination countries, its value from 1 to 7 (best). This indicator is taken from the Global Competitiveness Index report.
In this context, Malaysia has already signed and implemented 7 bilateral FTAs with Japan, Pakistan, India, New Zealand, Chile, Australia and Turkey. While at the ASEAN level, Malaysia has 6 regional FTAs with ASEAN Free Trade Agreement (AFTA), China, Korea, Japan, Australia, New Zealand and India. Therefore, this research concerns on the impact of increasing the bilateral FTAs with more countries on the trade flows of renewable energy.
Findings
Many studies refer that the ordinary least squares (OLS) or Prais–Winsten estimates with panel-corrected standard error (PCSE) have coverage probabilities that are closer to nominal when the panels are between 10-20 with 10–40 periods per panel, therefore, the required models in this study are estimated using the procedure of the PCSE. Although feasible generalized least squares (FGLS) could be an alternative estimation procedure, but FGLS are conditional on the estimates of the disturbance covariance matrix and are conditional on any autocorrelation parameters that are estimated (Greene, 2003). In this study, since the time points are less than cross-section units; whereas T = 8 < N = 19 so using FGLS variance–covariance estimates are normally unacceptably optimistic (anticonservative) and the overconfidence in the standard errors makes this method unusable, unless T > N (Beck & Katz,1995).
Three models are displayed in table
The results show that the bilateral trade agreements between Malaysia and destination countries (BFTA) is not significant in the first and third model. While in the second model the new BFTAs becomes significant. This indicates that if Malaysia signed more bilateral trade agreement the trade flows of renewable energy will increase by 32.2 percent.
All estimated gravity models show a strong positive effect of GDP and negative effect of distance on international trade; typical estimates shows that the 1 percent increase in the distance between Malaysia and destination country is associated with a fall of 45.9 percent in trade flows of renewable energy industries in the third model. This drop partly reflects increased transportation cost of goods.
It is demonstrated that there is a strong empirical relationship between the size of a country’s economy and the volume of trade. Table
The demand of renewable energy in the destination countries is statistically significant with the expected sign, that meaning, if a destination country increase the demand of renewable energy by 1 percent the trade flows of renewable energy industries of Malaysia will increase by 6.5 percent, when everything else hold constant. The results are in line with (Groba, 2014), (Kuik et al., 2019) it means that there is a significant evidence that the renewable energy demand has an effect on the competitiveness of domestic manufacturing firms in Malaysia that produce renewable energy technologies. Furthermore, the variable of nature of the competitive advantage in the destination countries is supporting the main objective of this research, so the results show that it is statistically significant with the expected sign. It means that if the destination country increases the competitive advantage by 1 percent the trade flows of Malaysia will increase by 29.9 percent.
The elasticity of on trade flows has a negative and significant effect on trade flows. This negative sign of the CO2 emission variable is not worry about it; this means that the destination country has a full awareness of environmental regulations; the results show that a decrease by 1 percent in the emission of CO2 in the destination countries will increase the trade flows of renewable energy by 23.8 percent in Malaysia. The results are also consistent with Porter hypothesis and in line with the previous studies (Costantini & Crespi, 2008; Costantini & Mazzanti, 2012; Groba, 2014; Kuik et al., 2019) that supported the positive impact of environmental regulation on export of renewable energy industries. In this context, the results could be generalized to other global industries, where both developed countries and emerging countries compete for market shares.
Conclusion
The augmented gravity model shows that there is a positive evidence for the impact of environmental regulations on both the export of renewable energy industries and their competitiveness in Malaysia. Moreover, the results indicate that Porter hypothesis is valid, in this sense, CO2 emissions used as a proxy of environmental regulations, the results show that whenever the emission of CO2 in the destination countries decreases 1% the trade flows of renewable energy increase by 23.8% in Malaysia.
The results also suggest that, everything else hold constant, the increase of demand of renewable energy in the destination countries will increase the trade flow of renewable energy industries in Malaysia by 6.5%. This mean that the competitiveness of Malaysia renewable energy industry will be better whenever the destination country had increased their demand of renewable energy technologies. In this context, the competitiveness based on technology can be enhanced when strong local market is existence, whereas the continuous innovations and user-producer interaction play a crucial role (Kuik et al., 2019).
However, the decreases of market prices of renewable energy technologies enhanced competition on the global market. In regarding solar PV technologies, market price facing a rapid decline that is beyond imagination, so since the past ten years, they were expected that price would continue declining at a fast pace (IRENA, 2017). As economists predicted (Hirth, 2013), the economic value of solar PV would drop by whopping 50% when it became just 15% of electricity and that the value of wind would decline 40% once it rose to 30% of electricity. This will undoubtedly contribute to easing the transition to a low carbon economy that is high on political agendas since the successful conclusion of the Paris Agreement on climate change in December 2015.
This study recommends to the Malaysian policy maker to expand the ASEAN regional trade agreement and bilateral free trade agreements with more countries such as (Brazil, Germany, and Mexico) that demand more renewable energy industries.
References
- Beck, N., & Katz, J. (1995). What to do (and not to do) with cross-section-time-series data. American Political Science Review, 89(3), 634-647.
- Costantini, V., & Mazzanti, M. (2012). On the green and innovative side of trade competitiveness? The impact of environmental policies and innovation on EU exports. Research policy, 41(1), 132-153.
- Costantini, V., & Crespi, F. (2008). Environmental regulation and the export dynamics of energy technologies. Ecological economics, 66(2-3), 447-460.
- Groba, F. (2014). Determinants of trade with solar energy technology components: evidence on the porter hypothesis? Applied Economics, 46(5), 503-526.
- Greene, W. H. (2003). Econometric analysis (6th ed.). Prentice-Hall. (2003).
- Hirth, L. (2013). The market value of variable renewables, The effect of solar wind power variability on their relative price. Energy Economics, 38, 218-236. https://doi.org/10.1016/j.eneco.2013.02.004
- IRENA, G. E. C. (2017). Renewable capacity statistics 2017. International renewable energy agency, Abu Dhabi.
- Jha, V. (2009). Trade flows, barriers and market drivers in renewable energy supply goods. ICTSD, Issue Paper, 10.
- Kuik, O., Branger, F., & Quirion, P. (2019). Competitive advantage in the renewable energy industry: Evidence from a gravity model. Renewable energy, 131, 472-481.
- Lund, P. D. (2009). Effects of energy policies on industry expansion in renewable energy. Renewable energy, 34(1), 53-64.
- Mayer, T., & Zignago, S. (2011). Notes on CEPII’s distances measures: The GeoDist database.
- REN21. (2017). Renewables 2020 Global Status Report. https://www.ren21.net/reports/global-status-report/
- Sawhney, A., & Kahn, M. E. (2012). Understanding cross-national trends in high-tech renewable power equipment exports to the United States. Energy Policy, 46, 308-318.
- Tinbergen, J. (1962). Shaping the world economy; suggestions for an international economic policy. Twentieth Century Fund.
- United Nations Environment Programme. (2018). Global Trends in Renewable Energy Investment 2018. https://wedocs.unep.org/handle/20.500.11822/33382
- Vossenaar, R., & Jha, V. (2010). Technology mapping of the renewable energy, buildings, and transport sectors: Policy drivers and international trade aspects. ICTSD Is sue Paper No, 12.
Copyright information

This work is licensed under a Creative Commons Attribution-NonCommercial-NoDerivatives 4.0 International License.
About this article
Publication Date
30 December 2020
Article Doi
eBook ISBN
978-1-80296-099-0
Publisher
European Publisher
Volume
100
Print ISBN (optional)
-
Edition Number
1st Edition
Pages
1-905
Subjects
Multi-disciplinary, accounting, finance, economics, business, management, marketing, entrepreneurship, social studies
Cite this article as:
Khudari, M. (2020). Augmented Gravity Model of the Competitiveness of Renewable Energy Exports in Malaysia. In N. S. Othman, A. H. B. Jaaffar, N. H. B. Harun, S. B. Buniamin, N. E. A. B. Mohamad, I. B. M. Ali, N. H. B. A. Razali, & S. L. B. M. Hashim (Eds.), Driving Sustainability through Business-Technology Synergy, vol 100. European Proceedings of Social and Behavioural Sciences (pp. 599-609). European Publisher. https://doi.org/10.15405/epsbs.2020.12.05.65