
Designing Data Analytics System And Monitoring Russian Federation Regions Cluster Policy


Abstract
The article sets the task of creating a data analytics system for processing and storing indicators. The theoretical and methodological basis of the study was the work of modern Russian and foreign scientists on the cluster policies assessment effectiveness. The article is based on the work of the following authors: Porter M., Neskromnaya E.E., Zelinskaya M.V. and others. The main database for the study was statistical data taken from the official website of the Federal State Statistics Service. Research methods are based on the propositions of probability theory and mathematical statistics. Microsoft Excel was selected and Microsoft Access as the research tools. The authors considered problems of cluster policy monitoring, gave a description of the created data analytics system, and formulated the main results of the analysis. On the basis of the study, the authors developed a data analytics system that allows to store and process the results of calculating the innovative capacity of the regions, as well as other indicators for assessing cluster policy.
Keywords: Cluster policydata analytics systemFederal State Statistics Serviceinnovative capacitymonitoringRussian Federation regions
Introduction
More than ten years have passed since the cluster policy in territorial administration received official status. The Concept of Long Term Social and Economic Development of the Russian Federation until 2020 (The concept of long-term social and economic development of the Russian Federation until 2020, 2008) was adopted in 2008. It determined the basic guidelines of cluster policy. Since then more than 110 cluster initiatives were developed (Abashkin et al., 2018, p. 8).
Problem Statement
In order to assess the effectiveness of cluster policies, it is required to organize constant monitoring and to develop data analytics tools that allow tracking down the implementation of cluster policies by local governments (Chokusheva, 2016; Makoev, 2014). The assessment methodology that lays in the basis of monitoring is presented in the article Information Management & Analysis for the implementation of cluster policy in the regions of Russia (Kalinina & Petrova, 2018). The next stage is designing for a data analytics system that will allow us to accumulate monitoring data and automatize the analysis of the effectiveness of ongoing activities.
Research Questions
Let us define the main stages of database development:
requirements determination (forming a list of tasks for the database to solve, determining elements to be stored in the database);
logic design (logical grouping of data by using the ER diagram (Entity Relationship Diagram) in consideration of the relationship between objects);
physical design (a logical structure is displayed as a database storage structure; physical storage environment is chosen for the most effective data storage). The data scheme is formed; all types, fields, sizes and restrictions are indicated. In addition, the key inquiries determination, the reports design and the interface development are performed.
Purpose of the Study
The task was to create a data analytics system for processing and storing indicators.
Research Methods
The theoretical and methodological basis of the study was the work of modern Russian and foreign scientists on the cluster policies assessment effectiveness (Andersson et al., 2004; Bergman & Feser, 1999; Dubrovskaya & Kozonogova, 2016; Neskromnaya, 2010; Petrova et al., 2019; Shpolyanskaya, 2016). Microsoft Excel and Microsoft Access were selected as the research tools.
Findings
Requirements determination
To describe the requirements, we compile a data dictionary designed to describe the individual elements that must be stored in the database. The draft vocabulary is shown in Table
Thus, the elements of a future database were determined and explained.
Logic design
The most common way to represent a logical database model is an ER diagram that displays an entity as a discrete object. The logical model of the database “Cluster Policy Monitoring” is presented in Figure
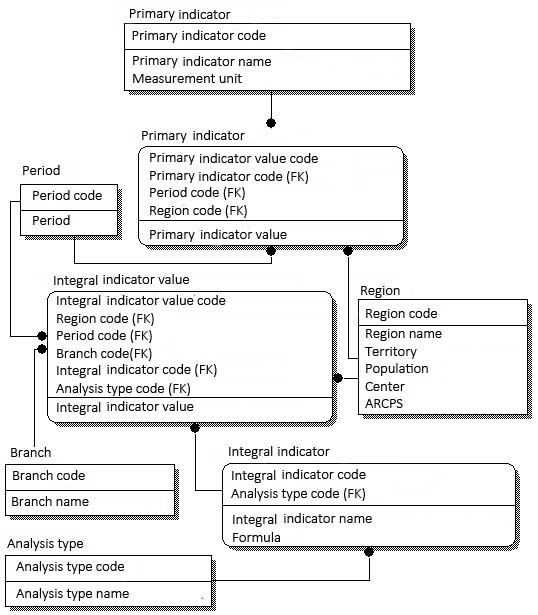
Based on this scheme, we can describe the relationship between objects:
One indicator (primary/integral) can have many values;
One period can be set for several values of primary and integral indicators;
One branch can be specified for many integral indicator values;
One type of analysis can be specified for many integral indicators.
Physical design
Let us begin designing the database in MSAccess by creating tables. To do this, use the "Table Tools" and switch to the "Design" mode. Let us consider in detail the creation of the table "Primary_ indicator" (Figure
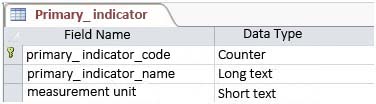
In the first row of the “Field Name” column, enter the primary indicator code and press Enter. The cursor moves to the Data Type column. MSAccess by default assigns a Counter data type. In the first row of the table (Code field) MSAccess by default assigns a primary key field. In the field properties for the primary key the value of the indicator field is set to: Yes (No matches are allowed). Next, fill in the following lines (second and third fields of the table), Field name - Name of the primary indicator (data type - long text) and Measurement unit (data type - short text).
In a similar way, create the remaining tables by using the table constructor: Analysis_type, Integral_ indicator _value, Primary_ indicator_value, Integral_ indicator, Branch, Period and Region.
To establish relationships between tables, we use the “Database Tools” - the “Relationships” icon of MSAccess. The relationship diagram developed for the Cluster Policy Monitoring database is presented in Figure
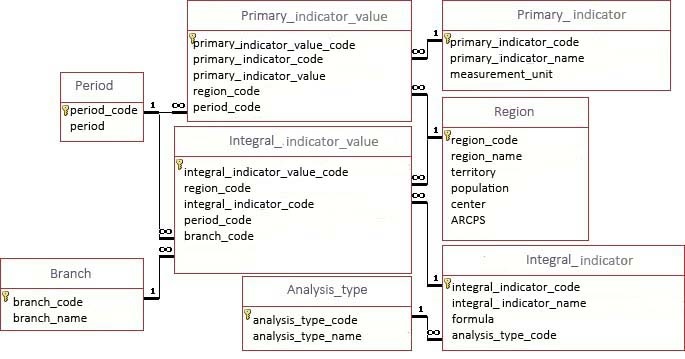
The diagram shows one-to-many relationships. The table with a “one” relationship is the main one, and the table with a “many” relationships is the subordinate one.
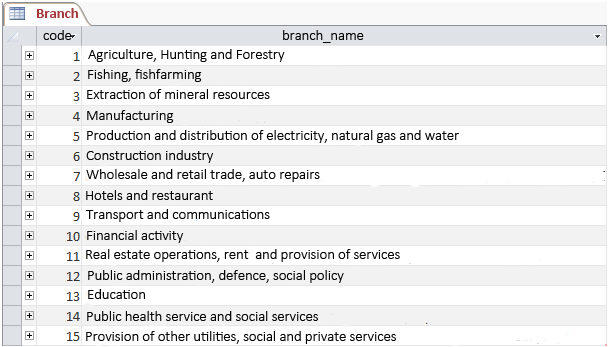
The next step is to fill the tables with data. The completed “Branch” table is as follows (Figure
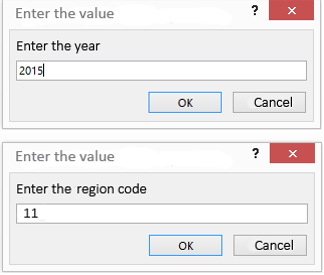
As a next step we create the necessary queries using the "Query Design" mode. Let us consider in more detail one of the created parametric queries “Querying the values of indicators for the year”. When calling up the request, enter the required year and region code (Figure
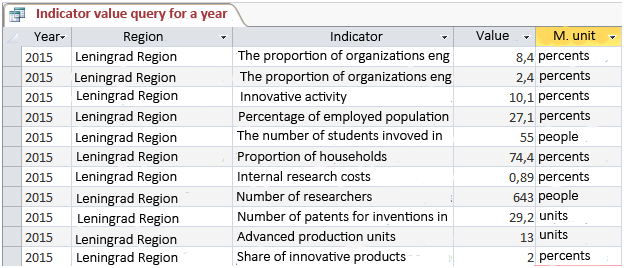
After processing the request, we obtain the following data (Figure
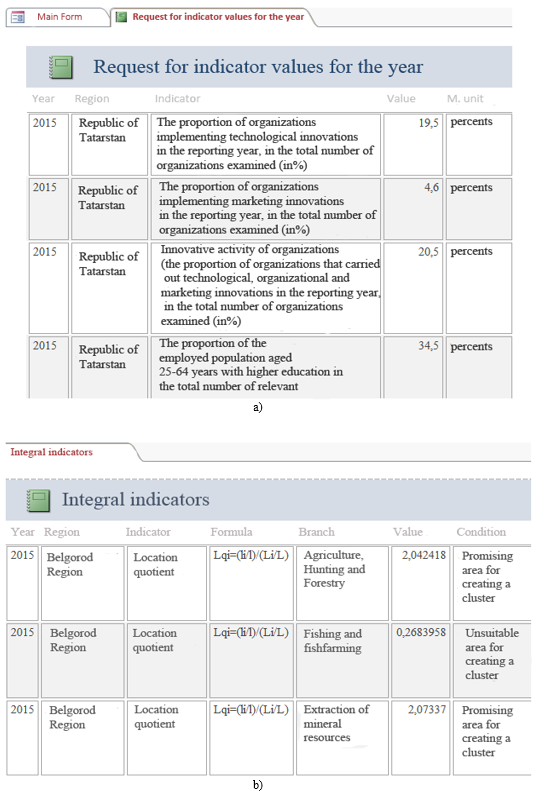
After having made sure that the reports work correctly, let us create reports that allow us to display the results of our queries in a suitable form. Using the “Report Wizard”, we create two queries - “Request for indicator values for the year” and “Integral indicator” (Figure
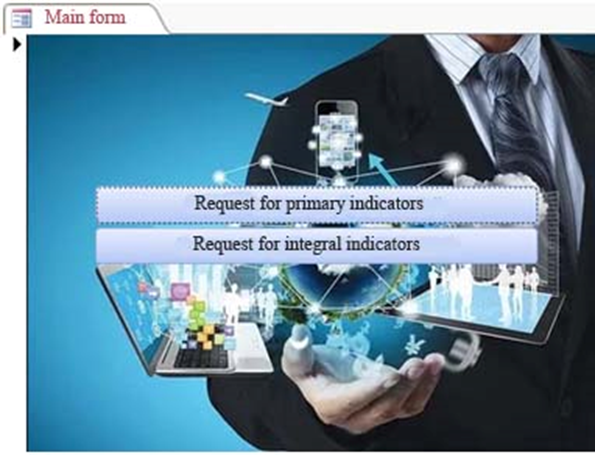
Next, we move on to creating the main form, which will provide quick access to requests (Figure
Conclusion
Having carefully studied the research in the field of cluster policy assessment, we became convinced of the significance, complexity and relevance of this topic.
Based on many definitions, it can be concluded that a cluster is a business entities association of the private and / or public sector, related by territorial proximity and joint activities and allowing optimizing the use of resources in order to increase the competitiveness of each cluster member, as well as the region as a whole.
In the paper, authors carried out a rating assessment of the innovative and cluster potential of the region, which showed that most of the regions have a sufficient level of innovation development and can implement cluster policy.
Based on the results of calculating the location quotient, we can conclude that there is a lack of created clusters in the regions of the Russian Federation since there are many cluster-forming industry branches (Map of Russian clusters, 2018). For example, in the Khabarovsk Territory, it is necessary to form a cluster in the fishing and fishfarming industry, as there is a high potential observed in this branch; in the Krasnodar Territory a cluster of hotel business and restaurants could be successfully developed; in the Astrakhan region it is necessary to create a cluster of public administration and defense.
Thus, as shown above, we have developed a data analytics system in MS Access suitable for storing and processing identification indicators and evaluating cluster potential.
Acknowledgments
The reported research was funded by Russian Foundation for Basic Research and the government of Volgograd region, grant No. 18-410-340020 "Evaluation of the effectiveness of the implementation of the cluster policy of the socio-economic development of the region".
References
- Abashkin, V., Artemov, S., Gusev, A., Islankina, E., Khafizov, R., Kutsenko, E., & Zaurova, E. (2018) Cluster Policy: Achieving Global Competitiveness (iss. 2, p. 342). Ministry of Economic Development of Russia, JSC "RVC", Nat. research University "Higher School of Economics". NIU VSE.
- Andersson, T., Schwaag Serger, S., Sörvik, J., & Wise Hansson, E. (2004). Cluster Policies Whitebook. IKED - International Organisation for Knowledge Economy and Enterprise Development.
- Bergman, E. & Feser, E. (1999). Industrial and Regional Clusters: Concepts and Comparative Applications. Regional Research Institute, West Virginia University.
- Chokusheva, G. R. (2016). The evolution of the concept of "economic efficiency". European Journal Of Humanities and Social Sciences, 3, 95-104. https://doi.org/10.20534/EJHSS-16-3-95-104
- Dubrovskaya, Yu. V., & Kozonogova, E. V. (2016). Analysis of the features of economic clustering based on world experience. Public Administration. Electronic bulletin, 58, 126-144.
- Kalinina, A. E., & Petrova, E. A. (2018). Information Management & Analysis for the implementation of cluster policy in the regions of Russia. Bulletin of VolSU. Series 3, Economics. Ecology, 20(4), 25-37.
- Makoev, M. M. (2014). The cluster is a tool of modern economic development. Economics and Entrepreneurship, 1-2, 156–158.
- Map of Russian clusters. (2018). http://map.cluster.hse.ru/list
- Neskromnaya, E. E. (2010). The state policy of cluster development: conceptual foundations and world experience. Economic Sciences, 5(66), 11-15.
- Petrova, E. А, Trukhlayeva, A. А., & Fokina, E. А. (2019). Economic growth monitoring and the Russian regions typology in terms of quality of life in the digitalization of territories. In Proceedings of the International Scientific Conference "Competitive, Sustainable and Secure Development of the Regional Economy: Response to Global Challenges" (CSSDRE 2019). Advances in Economics, Business and Management Research (AEBMR) (volume 83, p. 575 - 580). Atlantis Press. https://doi.org/10.2991/cssdre-19.2019.111
- Shpolyanskaya, A. A. (2016). Innovation clusters - the interaction of business and science. The experience of Germany. Bulletin of the Ural State Economic University, 3, 106-114.
- The concept of long-term social and economic development of the Russian Federation until 2020. (2008). http://government.ru/info/6217/
Copyright information

This work is licensed under a Creative Commons Attribution-NonCommercial-NoDerivatives 4.0 International License.
About this article
Publication Date
28 December 2020
Article Doi
eBook ISBN
978-1-80296-098-3
Publisher
European Publisher
Volume
99
Print ISBN (optional)
-
Edition Number
1st Edition
Pages
1-1040
Subjects
Multicultural context, learning environment, modern society, personality formation, informatization of the society, economics and law system of the region
Cite this article as:
Kalinina, A. E., Petrova, E. A., Lapina, M. S., & Shipileva, A. V. (2020). Designing Data Analytics System And Monitoring Russian Federation Regions Cluster Policy. In N. L. Shamne, S. Cindori, E. Y. Malushko, O. Larouk, & V. G. Lizunkov (Eds.), Individual and Society in the Modern Geopolitical Environment, vol 99. European Proceedings of Social and Behavioural Sciences (pp. 355-364). European Publisher. https://doi.org/10.15405/epsbs.2020.12.04.42