Corruption VS Entrepreneurship In Developing Countries
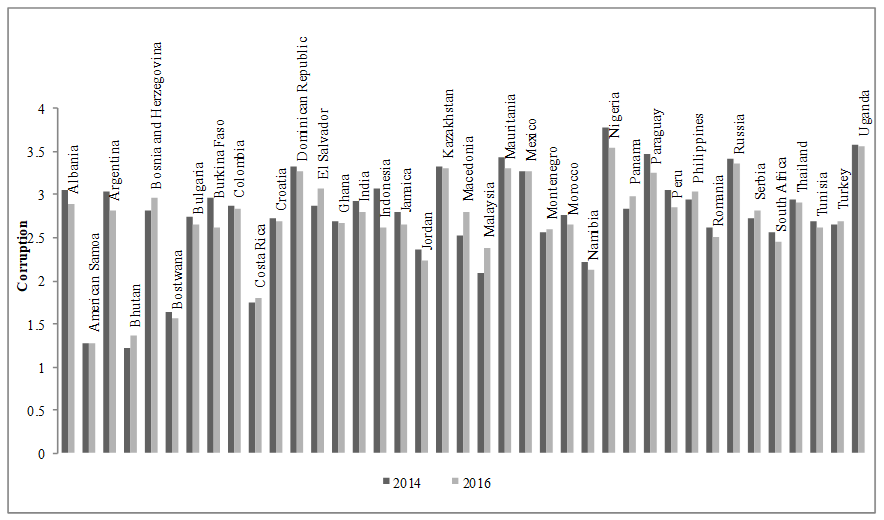
Figure 2: Corruption in the Selected Developing Countries. Source: World Bank (
2017b). Note: The original database for control of corruption provides a range of -2.5 to 2.5 with a higher scores representing lower corruption. For our convenience, the modified score ranges from 0 (the best) to 5 (the worst) using the recalculating formula COR=SCORE*-1+2.5 with a higher score representing greater corruption. Average COR-Average of corruption for developed countries
< Back to article