Anatomy Of Behavioural Risk Seasonality In Equity
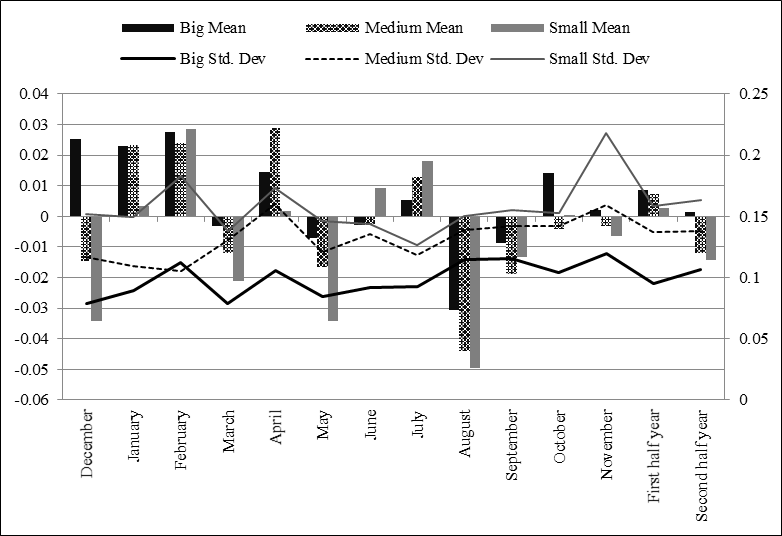
Figure 1: Mean returns and risk behaviour across different calendar months Note: This figure illustrates average mean returns and risk behaviour of different stock size (big, medium, and small) across different calendar months. The data is as presented in Table
5. Winter months (December, January, February, March) and summer months (May, June, July, August, September). First-half year (Jan to June) and second-half year (June to December). Scale: Right (mean raw returns), and Left (Std. Dev.)
< Back to article