
Anatomy Of Behavioural Risk Seasonality In Equity


Abstract
This research offers insight on calendar seasonality from behavioural perspectives with evidence from the Malaysian equity market. First, the behavioural perspectives on human behaviour and behavioural risk seasonality are discussed. Then, empirical tests on the calendar seasonality of behavioural risks with control of fundamental variables are examined on 238 Malaysian firm individual stock returns using the panel regression method. The analyses are performed on calendar months and half-yearly sub-samples to examine the behavioural risk seasonality. The finding supports the presence of behavioural risk seasonality in Malaysia and provides valuable theoretical and practical insights. The results provide useful insights for both theory and practice. For theory, the human behaviour cycle partly provides a behavioural justification on the calendar seasonality behaviour of equity market throughout the year. For investment practices, this research highlights the behavioural calendar-based investing strategy that is valuable to measure and manages behavioural risk seasonality impacts on equity portfolio.
Keywords: Behavioural financebehavioural riskcalendar seasonalitycalendar style investingrisk aversion seasonality
Introduction
Calendar anomalies have long been puzzled in finance literature since the 1930s with persistence occurrence and significant economic impacts in almost every country even in most developed stock exchanges in the world ( Corhay et al., 1987; Doeswijk, 2008; Gultekin & Gultekin, 1983; Jacobs & Levy, 1988; Tadepalli & Jain, 2018). Calendar anomalies research concentrate on identification of positive or negative returns based on respective months in a year due to non-fundamental forces ( Washer et al., 2016). On global average, stock return premium is close to zero from May continues to October and only generates premium in November up to April ( Doeswijk, 2008). These calendar anomalies still an object of curiosity in finance theory and practice ( Burton et al., 2013). Understanding market anomalies is important because theoretically, they contradict the conventional theory of asset pricing. In practice, it is important for portfolio and risk management ( Schulmerich et al., 2015). Research evidence from modern finance perspectives based on rational decision and investment practices are well documented globally but do not provide a complete justification to calendar anomalies. The chronological summary of literature on calendar anomalies is documented in Tadepalli and Jain ( 2018). The modern finance views, in particular, the risk and value considerations appear insufficient to explain calendar anomalies ( Jacobs & Levy, 1988). On the other hand, behavioural finance evidence is limited and incomplete. In behavioural finance perspectives, assuming an imperfect human, investors are at best bounded rational in behaviour and decision ( Simon, 1955). In line with this human behaviour theory, both rational considerations and irrational forces ( Keynes, 1936) influence investors’ trades. This bounded rational force would induce heterogeneity in investors’ opinions and investing decisions ( Miller, 1977). Divergence in investors’ opinions and behaviour cause many behavioural anomalies in financial markets. Based on these premises, the calendar anomalies could be the manifest of heterogeneity in investors opinion and risk taking behaviours that are induced by irrationality forces due to psychology, sociology, and biology forces on human ( Ahmad et al., 2017).
Behavioral perspectives on investors and market behavior
In behavioural theoretical lenses, the foundations for investor behaviour are informed by bounded rational theory complemented with theory of mind. The
Empirical evidence
A calendar anomaly refers to the unusual market behaviour in different calendar months, which provides signal of good or bad times to invest. Key calendar effects are elaborated herein.
The psychology of calendar effects has been less discovered. Theoretically, several calendar effects were due to investors psychological factors ( Brahmana et al., 2012), in particular overreaction behaviour during a particular month ( Park, 2013). In addition, neuroscience and cognitive psychology studies have documented the presence of seasonal patterns in human brain responses ( Meyer et al., 2016). In connection to stock market behaviour, stock trading seems to follow times due psychology forces yet they influence trading. For instance, optimism in first half of the year is the psychology stimulus for January effect and Deaknso-bushi effect. Repeatedly seen that the stock market is higher in January due to aggressive buying and lower in December due to aggressive selling. On holiday occasion, investors’ trade excitement is higher due to positive mood or emotion leads to higher buying interest and consequently higher stock returns. Dekanso-bushi effect hypothesize that people are more optimistic in the first-half of the year and risk-taking activity in the stock market is higher ( Sakakibara et al., 2013). Happiness on holidays is the psychology stimuli for the February effect and the December effect. Happiness influence individual choice ( Mogilner et al., 2012). Higher stocks return during the months of February due to Chinese New Year effects have been continuously observed in high Chinese populated financial markets ( Kling & Gao, 2005). Pessimism is the psychology stimulus for May effects in which investors’ optimism in May is lower ( Doeswijk, 2008). This can be reconciled with existing evidence, on average, stock prices are higher during winters (November until April) and relatively lower during summer months (May until October). Variations in human mood during winter and summer months are the psychology stimulus for differences in risk-returns relationships during winter and summer months across the globe ( Kamstra et al., 2003; Kramer & Weber, 2011). Illusion of fear is the psychology stimulus for October effect. The industry player noted that October is the scariest month for investors due to the past experiences that profound stock market crashes occurred all in October (i.e. Black Tuesday, October 29, 1929), and Black Monday, October 19, 1987). These October crashes cause illusion of fear to many traders believing that bad things happen in October ( Gärling et al., 2009).
Problem Statement
Some scholars have indicated and argued that human behaviour could provide insights on seasonality behaviour in financial markets since in the 1980s but less attended. For instance, De Bondt and Thaler ( 1987) provides evidence connecting overreaction with stock market seasonal behaviour. Jacobs and Levy ( 1988) call for behavioural explanations to calendar anomalies pointing to the possibility that human behaviour cycle could be the root cause behind calendar seasonality in financial markets. Haug and Hirschey ( 2006) offer behavioural explanations to the January effect due the aggressive trading behaviour of individual investors. Doeswijk ( 2008) provides the optimism cycle hypothesis as the psychological reasons to the May effect. Brahmana et al; (2012) offers the psychological rational on irrational financial decision making with the idea that cognitive and affective biases from human mind are the stimuli for psychological biases that cause the day-of-the-week effect. In recent article, Kaplanski and Levy ( 2017) documented the presence of seasonality in the perceived risk due to sentiment variations in investing society. This research documented significant positive association between the magnitude of seasonality and the prevalence of seasonal affective disorder that is responsible for seasonal fluctuations in risk-aversion of investors and consequently creates seasonality in financial markets. So far, the fragmentation of evidence on this topic and lack of consensus underlies the complexity of the calendar anomalies. In particular, the modern finance justifications remain incomplete and unreconciled with behavioural finance perspectives. Calendar anomalies due to investor behaviour is an evidence of investor bounded rationality. Consequently, the possibility that calendar anomalies are affecting the financial markets is an evidence highlighting non-efficiency of financial markets. To date, there is a need to explore calendar anomalies issue in sufficient depth ( Rossi, 2015). This line of research is important but lacking in Malaysia. Malaysia equity market is important to the global investing community and understanding the Malaysian seasonality is important for investment strategies in this market. Historical statistics (2004-2017) indicated that on average, Malaysian stock market traders are comprising of 71 percent local investors (70 percent institutional and 30 percent retail) and 29 percent foreign investors. The statistic also shows higher presence of retail and foreign investors, which has been associated with noise trading behaviour due to information disadvantage ( Richards, 2005) that causes irrational behaviours in Malaysian stock markets. In the calendar seasonality literature, in contrast to western literature, growing new evidence of higher returns is spotted to be in the month of February not in January ( Fountas & Segredakis, 2002). Previous scholar argued that significant higher average returns for February is driven by the Chinese New Year (cultural factors) which mostly has been in the month of February ( Ahmad & Hussain, 2001; Wong et al., 1990; Yong, 1989).
Research Questions
The research questions are as follows; RQ1. Do risk-returns seasonality present in Malaysia equity market? RQ2. Do behavioural risk seasonality present in Malaysia equity market? RQ3. What are the psychology rationales for behavioural risk seasonality in Malaysia equity market?
Purpose of the Study
This research revisits this issue and provokes an examination of the significance of behavioural analyses on calendar anomalies. This research extends the behavioural justifications on calendar anomalies in equity markets in two folds. First, a behavioural theoretical perspective is linked with the calendar anomalies. Second, the empirical analysis covers six major calendar anomalies and these empirical evidences are synthesized with behavioural theories and evidences. The research finding offers behavioural insights on calendar effect. The findings established evidence of seasonality of behavioural risks in line with behavioural changes in investor psychology behaviour (mood) that induce variances in risk-taking behaviours during the winter versus summers months and on pre-holiday session. The results provide logical psychology justifications on seasonality in equity market behaviour due to seasonality of investor behaviour induced by psychology, sociology, and biology forces in human. Understanding calendar anomalies offers both theoretical and practical merits. Theoretical relevance, deeper understanding on calendar anomalies and its rationale in inducing market non-efficiency. In practice, simple calendar investment strategies have attracted strong attention among academic researchers and investors for decades. In practice, investment strategies based on calendar give higher risk-adjusted returns compared to buy-and-hold strategy ( Swinkels & van Vliet, 2012).
Research Methods
To recap, in behavioral perspective, investors’ decision will be influenced by rational (fundamental) and irrational (behavioral) as represented in equation 1. In reference to Tuyon and Ahmad ( 2018), the stock return model with fundamental and behavioral risks are presented in equation 2. Where,
represents the sensitivity of stock
(1)
The multifactor stock returns determinants model is developed with risk factors derived based on theory reasoning as suggested by Chen et al. ( 1986). Apart from general economic factors, firm fundamental and behavioral factors are included. The economics fundamental risk is proxies by Coincident Index (CI
Where,
= the respective firm
Findings
The interpretation of findings is organised as follows. First, the descriptive statistic is inspected to understand the statistical properties of the data. Second, the risk and return seasonality estimations for monthly and half-yearly is elaborated. Finally, the behavioural risk seasonality and its psychology rational is discussed.
Descriptive analysis
The empirical analysis is performed on 238 stocks that are continuously traded in Bursa Malaysia stock exchange from 1996:01 to 2014:12 in the respective industry category have been obtained from Bloomberg’s database in Bursa Malaysia. This sample represents about 26 percent of the stock traded in Malaysia stock exchange (currently about 900 listed firms). The 238 stocks provide representations of all industry sectors in Malaysia (i.e. trade & services, consumer product, plantation, property, industrial products, construction, finance, and technology). In the analysis, these stocks are grouped according to size group as per Bursa Malaysia classification. In particular; 24 big firms (MC: <12M), 95 medium firms (MC: 0.97M – 12M), and 119 small firms (MC: >0.97M). The overall sample descriptive statistics is as summarized in Table
Risk-returns seasonality analysis
In the empirical test, the risk-returns seasonality analysis is performed on two sub samples namely; monthly and half-yearly. The monthly analysis is performed to examine the seasonality or risk-returns across different months in a year. The half-yearly analysis is performed to access the seasonality behaviour of stock returns in the first-half (January to June) and second-half (July to December) of the year.
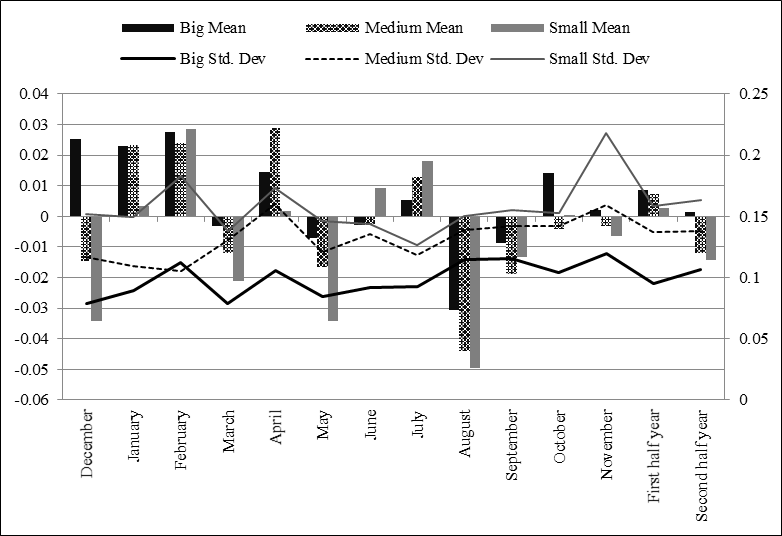
Summary of risk and returns behaviour across calendar months are reported in Table
In terms of risk, the high (low) risk-high (low) returns principle is observed only in winter month and not in summer month. In addition, risk is also varying with stock size where big stock carries low risk, medium stock with medium risk, and small stock come with high risk profile. Graphically, it is also evident that the risk in the later part of half-year is slightly higher compared to the earlier part of half-year. Big firms behaviour, the effect of fundamental risk is higher and the behavioural risk effect is lower. This evidence can be corroborated with the ideas that institutional investors with investment principles are mostly based on rational justifications mostly hold these big stocks. In another view, the effect of fundamental risk on small and medium sized firms is low and behavioural risk influence is higher. This evidence can be linked to the facts that these stocks are highly hold by retail investors who are more prone to behavioural biases and thus behavioural risks influence are relatively greater compared to fundamental risk influence.
Summary of calendar anomaly for overall and half-yearly data – by firm size is reported in Table
Analysis on the heterogeneity of behavioural risks impacts on stock returns is reported in Table
Behavioural risk seasonality and psychology rational
Calendar anomalies may be partly due to cognitive and affective biasness on part of investors’ decision ( Gärling et al., 2009). In particular, mood (positive and negative) is an affective state that is susceptible to be affecting investors and consequently the stock market behaviour. Throughout the calendar month, investors’ mood cycle is partly induced by the winter and summer season that is affecting the human psychology behaviour. In addition, in certain month, investors’ mood is also driven by happiness feeling during holidays particularly the Chinese New Year and Christmas. These perspectives are proven valid in the present context of this research. In behavioural perspective, investors’ mood state is related to level of optimism and affecting investing behaviour. Good mood makes investors more and risk-taker than do individual in a bad mood ( Baker & Nofsinger, 2002; Duxbury, 2015; Gärling et al., 2009; Kaplanski et al., 2015; Kramer & Weber, 2011; Shu, 2010). In the analysis, on monthly perspectives, during winters months, on average, returns are high and risk is low. On the other hand, during summer months, on average, returns are low and risk is high. Winter is the coldest of the four temperature seasons and summer is the hottest season of the year. In Malaysia environment, the country will be affected by the rainy northeast monsoon that will be most severely affecting the North East coast of peninsular Malaysia (December, January, February, and March). During summer season, Malaysia is having a hot season (June, July and August). Holidays also induce good mood to investing society during February and December, which confirmed the February effect as well as the December effect. In the half-yearly analysis, also indicates higher returns in earlier part of the year. This is in line with half-yearly optimism cycle and the Dekanso-bushi effect hypotheses ( Sakakibara et al., 2013). This provides confirmation evidence on investors’ optimism cycle is higher in the first half of the year due to overly optimistic expectations in earlier part of the year. Accordingly, the anatomy of behavioural risk seasonality is summarized in the following equations and Table
Winters and holidays > high positive mood > high optimism > high behavioural risk > high returns
Summers and illusion of fear > low positive mood > low optimism > low behavioural risk > low returns
So far, for few studies have investigated the psychology justification for market behaviour seasonality. Earlier research has documented the cultural factor (i.e. CNY) which influence the investor and market behaviour ( Ahmad & Hussain, 2001; Wong et al., 1990; Yong, 1989). In more recent evidence, scholar have documented that variation mood in human mood during day-of-the week is partly the psychological justification for daily anomaly in financial market behaviour ( Brahmana et al., 2012). This research adds to this literature with evidence that investor optimism during different month due to variation in mood as induced by different mood state during different seasons (i.e. winter and summer) as well as more optimism during first-half of the year compared to the second-half of the year.
Conclusion
This study theoretically connects behavioural risks seasonality with calendar anomalies and empirically tests the ideas in Malaysia equity market. The research aims to provide the behavioural theoretical and empirical justifications on calendar anomalies. Based on behavioural perspectives and evidence about bounded rational of human mind structure and seasonality of human behaviour. The research extends behavioural insights on calendar seasonality behaviours in equity markets. The findings support the seasonality of behavioural risks in line with behavioural changes in investor psychology behaviour (mood) that induce variances in risk-taking behaviours during the winter versus summers months and on pre-holiday session. The results provide logical psychology justifications on seasonality in equity market behaviour due to seasonality of investor behaviour induced by psychology, sociology, and biology forces in human. This research offers behavioural insights on calendar anomalies that are important to inform finance theory and practice. In theoretical implications, this research offers psychological insights on calendar anomalies and its roles on market efficiency. In practical implications, the findings offer investment strategy insights for portfolio hedging and calendar-based trading strategies. The investigations never complete at this stage and invites wider and deeper understanding of many behavioural anomalies (under/overreaction, under/overconfidence, momentum, herding, and etc.) in financial markets rooted within the human psychology. Understanding human psychology behaviour could complement modern finance perspectives for a better awareness of financial markets anomalies in the financial world with bounded rational investors that is partly forming an adaptive market behaviour.
References
- Ahmad, Z. (1998). Stock market seasonality and Chinese New Year effects in the Far Eastern markets. Capital Markets Review, 6(1&2), 85-99.
- Ahmad, Z., & Hussain, S. (2001). KLSE long run overreaction and the Chinese New-Year effect. Journal of Business Finance Accounting, 28(1-2), 63–105.
- Ahmad, Z., Ibrahim, H., & Tuyon, J. (2017). Institutional investor behavioral biases: Syntheses of theory and evidence. Management Research Review, 40(5), 578-603.
- Ariel, R. A. (1987). A monthly effect in stock returns. Journal of Financial Economics, 18(1), 161–174.
- Ariel, R. A. (1990). High stock returns before holidays: Existence and evidence on possible causes. Journal of Finance, 45(5), 1611-1626.
- Baker, H. K., & Nofsinger, J. R. (2002). Psychological biases of investors. Financial Services Review, 11(2), 97-116.
- Bouman, S., & Jacobsen, B. (2002). The Halloween indicator, "Sell in May and go away": Another puzzle. American Economic Review, 92(5), 1618-1635.
- Brahmana, K. R., Hooy, C. W., & Ahmad, Z. (2012). Psychological factors on irrational financial decision making: Case of day-of-the week anomaly. Humanomics, 28(4), 236-257.
- Brennan, M. J., Chordia, T., & Subrahmanyam, A. (1998). Alternative factor specifications, security characteristics, and the cross-section of expected stock returns. Journal of Financial Economics, 49(3), 345-373.
- Burton, E. T., Shah, S. N., & Shah, S. (2013). Behavioral finance: Understanding the social, cognitive, and economic debates. John Wiley & Sons.
- Cadsby, C. B. (1989). Canadian Calendar Anomalies and the Capital Asset Pricing Model. In R. M. C. Guimaraes, B. G. Kingsman and S. J. Taylor (Eds.), A reappraisal of the efficiency of financial markets (pp. 199-226). Springer-Verlag.
- Carmerer, C. F., Lowenstein, G., & Prelec, D. (2004). Neuroeconomics: Why economics needs brains. Scandinavian Journal of Economics, 106(3), 555-579.
- Chen, H., & Singal, V. (2003). A December effect with tax-gain selling? Financial Analysts Journal, 59(4), 78-90.
- Chen, N. F., Roll, R., & Ross, S. A. (1986). Economic forces and the stock market. Journal of Business, 383-403.
- Corhay, A., Hawawini, G., & Michel, P. (1987). Seasonality in the risk-return relationship: Some international evidence. Journal of Finance, 42(1), 49–68.
- De Bondt, W. F., & Thaler, R. H. (1987). Further evidence on investor overreaction and stock market seasonality. Journal of Finance, 42(3), 557-581.
- Doeswijk, R. Q. (2008). The optimism cycle: Sell in May. De Economist, 156(2), 175–200.
- Duxbury, D. (2015). Behavioral finance: Insights from experiments II: Biases, moods and emotions. Review of Behavioural Finance, 7(2), 151–175.
- Fama, E. F. (1970). Efficient capital markets: A review of theory and empirical work. Journal of Finance, 25(2), 383.
- Fields, M. J. (1934). Security prices and stock exchange holidays in relation to short selling. Journal of Business, 7(4), 328-338.
- Foster, R. G., & Roenneberg, T. (2008). Human responses to the geophysical daily, annual and lunar cycles. Current Biology, 18(17), R784-R794.
- Fountas, S., & Segredakis, K. N. (2002). Emerging stock markets return seasonalities: The January effect and the tax-loss selling hypothesis. Applied Financial Economics, 12(4), 291-299.
- Gärling, T., Kirchler, E., Lewis, A., & Van Raaij, F. (2009). Psychology, financial decision making, and financial crises. Psychological Science in the Public Interest, 10(1), 1-47.
- Gultekin, M. N., & Gultekin, N. B. (1983). Stock market seasonality: International evidence. Journal of Financial Economics, 12(4), 469-481.
- Haug, M., & Hirschey, M. (2006). The January effect. Financial Analysts Journal, 62(5), 78-88.
- Jacobs, B. I., & Levy, K. N. (1988). Calendar anomalies: Abnormal returns at calendar turning points. Financial Analysts Journal, 44(6), 28-39.
- Kamstra, M. J., Kramer, L. A., & Levi, M. D. (2003). Winter blues: A SAD stock market cycle. American Economic Review, 93(1), 324-343.
- Kaplanski, G., & Levy, H. (2017). Seasonality in perceived risk: A sentiment effect. Quarterly Journal of Finance, 07(01), 1650015-1 - 1650015-21.
- Kaplanski, G., Levy, H., Veld, C., & Veld-Merkoulova, Y. (2015). Do happy people make optimistic investors? Journal of Financial and Quantitative Analysis, 50(1-2), 145-168.
- Keynes, J. M. (1936). The general theory of employment, interest, and money. Macmillan.
- Kling, G., & Gao, L. (2005). Calendar effects in Chinese stock market. Annals of Economics and Finance, 6(1), 75-88.
- Kramer, L. A., & Weber, J. M. (2011). This is your portfolio on winter. Social Psychological and Personality Science, 3(2), 193–199.
- Lo, A. W. (2004). The adaptive market hypothesis. Journal of Portfolio Management, 15-29.
- Meyer, C., Muto, V., Jaspar, M., Kussé, C., Lambot, E., Chellappa, S. L., Degueldre, C., Balteau, E., Luxen, A., Middleton, B., Archer, S. N., Collette, F., Dijk, D. -J., Phillips, C., Maquet, P., Vandewalle, G. (2016). Seasonality in human cognitive brain responses. Proceedings of the National Academy of Sciences, 113(11), 3066-3071.
- Miller, E. M. (1977). Risk, uncertainty, and divergence of opinion. Journal of Finance, 32(4), 1151-1168.
- Mogilner, C., Aaker, J., & Kamvar, S. D. (2012). How happiness affects choice. Journal of Consumer Research, 39(2), 429–443.
- Murray, G., Allen, N. B., & Trinder, J. (2001). A longitudinal investigation of seasonal variation in mood. Chronobiology International, 18(5), 875–891.
- Park, J. H. (2013). Calendar effect: do investors overreact to the seasonality of the US hotel industry? International Journal of Tourism Sciences, 13(1), 80-102.
- Petersen, M. A. (2009). Estimating standard errors in finance panel data sets: Comparing approaches. Review of Financial Studies, 22(1), 435-480.
- Raible, F., Takekata, H., & Tessmar-Raible, K. (2017). An overview of monthly rhythms and clocks. Frontiers in Neurology, 8(189), 1-14.
- Richards, A. (2005). Big fish in small ponds: The trading behaviour and price impact of foreign investors in Asian emerging equity markets. Journal of Financial and Quantitative Analysis, 40(1), 1-27.
- Rossi, M. (2015). The efficient market hypothesis and calendar anomalies: A literature review. International Journal of Managerial and Financial Accounting, 7(3-4), 285-296.
- Sakakibara, S., Yamasaki, T., & Okada, K. (2013). The calendar structure of the Japanese stock market: The ‘sell in May effect’ versus the ‘Dekansho‐Bushi effect’. International Review of Finance, 13(2), 161-185.
- Schulmerich, M., Leporcher, Y. M., & Eu, C. H. (2015). Applied asset and risk management. Springer Berlin Heidelberg.
- Shu, H. C. (2010). Investor mood and financial markets. Journal of Economic Behavior & Organization, 76(2), 267-282.
- Simon, H. A. (1955). A behavioral model of rational choice. Quarterly Journal of Economics, 69(1), 99-118.
- Swinkels, L., & van Vliet, P. (2012). An anatomy of calendar effects. Journal of Asset Management, 13(4), 271-286.
- Tadepalli, M. S., & Jain, R. K. (2018). Persistence of calendar anomalies: Insights and perspectives from literature. American Journal of Business, 33(1/2), 18–60.
- Tuyon, J., & Ahmad, Z. (2018). Psychoanalysis of investor irrationality and dynamism in stock market. Journal of Interdisciplinary Economics, 30(1), 1-31.
- Wachtel, S. B. (1942). Certain observations on seasonal movements in stock prices. Journal of Business, 15(2), 184-193.
- Washer, K. M., Nippani, S., & Johnson, R. R. (2016). Santa Claus rally and firm size. Managerial Finance, 42(8), 817–829.
- Wong, P. L., Neoh, S. K., Lee, K. H., & Thong, T. S. (1990). Seasonality in the Malaysian stock market. Asia Pacific Journal of Management, 7(2), 43-62.
- Yong, O. (1989). Seasonality effect in the Kuala Lumpur stock exchange. Malaysian Management Review, 24(3), 37-44.
Copyright information

This work is licensed under a Creative Commons Attribution-NonCommercial-NoDerivatives 4.0 International License.
About this article
Publication Date
06 October 2020
Article Doi
eBook ISBN
978-1-80296-087-7
Publisher
European Publisher
Volume
88
Print ISBN (optional)
-
Edition Number
1st Edition
Pages
1-1099
Subjects
Finance, business, innovation, entrepreneurship, sustainability, environment, green business, environmental issues
Cite this article as:
Tuyon, J., & Ahmad, Z. (2020). Anatomy Of Behavioural Risk Seasonality In Equity. In Z. Ahmad (Ed.), Progressing Beyond and Better: Leading Businesses for a Sustainable Future, vol 88. European Proceedings of Social and Behavioural Sciences (pp. 120-135). European Publisher. https://doi.org/10.15405/epsbs.2020.10.11