
Quantitive Evaluation Of Investment Performance In Real Estate Funds


Abstract
The present research is focused on the possibility to develop the existing tools for investment projects funding in real estate – set-up and growth of investment funds which is particularly topical under the current economic conditions in Russia. The development basis of such tools includes two aspects: 1. Investor appeal feasibility and 2. Effective performance of the fund itself which involves selection of the investment project, its return evaluation and correlation of the expected return and investment risks, and general management of the investment portfolio. This research studies feasibility evaluation of investment funds for prospective investors through mathematical modelling on assessment of investing efficiency in a particular fund. This research on the fundamental principles of portfolio analysis makes a study of the actual international investment funds dealing with management and development of real estate. The evaluation timeframe taken is the years 2013–2016. As the result of application of evaluation mathematical methods, a group of leading funds was identified on independent material (01.2017–03.2019). The group showed the 0.54 % average annual return per instrument. The conclusion offers the further ways to study the proposed methodological tools and their practical approval. The proposed methodology provides practical evidence to feasibility evaluation and economic efficiency of investments in investment funds and by that to overcome the present constraints for developers in the sphere of mobilization of financial resources.
Keywords: Returnriskreal estate fund“Return-Risk” modelinvestment policy optimizationportfolio theory
Introduction
In 2018 there were more than two hundred REIT investment funds functioning on the US market. The return of real estate investment funds (REIT, 2019) usually exceeds the return on government bonds and banking deposit rates. It also exceeds the inflation and (almost always) is only behind the stocks (Belyh, 2010; Bocharov, 2009; Bragin, 2012; Neprienkov, 2008). As a rule, REIT funds simultaneously invest in a number of real estate assets. That causes high diversification of investments which means that investments in REIT funds can not be only considered as prospective investment objects (trends) of relatively low-risk investing but also as components for widely diversified investment portfolios. For instance, domestic companies stocks constitute 20 %, overseas companies stocks – 20 %, developing markets stocks – 10 %, real estate investment funds – 20 %, long-termed bonds of U.S. Treasury – 15 %, loan stocks – 15 % (Robins, 2017). Moreover, the share of real estate funds in them can be as much as 23–25 %, even up to 40 % of the total investment amount (Abdullaev, 2017). The size of the share, as a rule, is determined by the investor’s concern about risk. REIT funds are the companies owning and managing real estate. Consequently, the conventional methods of technical, fundamental and investment analysis can be fully applied to them (Brenstain, 2013; Bogl, 2013; Miller, 2017).
Problem Statement
In modern conditions of increasing constraints of investment resources for developers, delivering projects in real estate, there is urgent need in methodological instrumentarium evolution and search of new ways to attract financial resources. The REIT investment funds popular in other countries can be developed in Russia and become one of such trends. Now the given type to attract investment resources receives little use at national market due to a number of restrictions: lack of economic stability as a whole, powerful impact of political events on the country’s economy, ever-changing regulatory and normative environment, imperfection of methodological instrumentarium for feasibility evaluation of funds, their prospective return, etc.
Although the real estate market of Russia has been undergoing considerable changes recently. More often the projects on formation of collective investment funds have been implemented. The demonstrative example is realization of projects in the “apartotel” and “rental house” category. This requires the methodological base of prospective investor appeal feasibility of investment funds which is the subject of study in this article.
Research Questions
This article studies the approaches and the models for feasibility evaluation of investment funds which basically develop real estate assets.
Purpose of the Study
The purpose of the research is to develop the procedure of estimation and discovery of the investment funds which, in the investment horizon in focus, provide the highest performance, i.e. the fastest growth rates of return at the acceptable risk level, or the lowest risk level at the specified return rate.
Research Methods
As the initial historical selection we used the data of investing.com from 01.01.2013 till 31.12.2019 (global indexes, basic). The sequence of data (totally 21 indexes) 01.2013–31.12.2016 was used to train the model and the sequence 01.01.2017–31.03.2019 was hold over to estimate its applicability in investment practice. The size of the training sample was determined in accordance with the recommendations of Fama (1988).
The offered method to select investment priority guidelines rest on the fundamental principles of the portfolio analysis (Burenin, 1998, 2008; Damodoran, 2007; Fabocci, 2000; Gercekovich, 2018; Markovitz, 1952, 1959, 1987, 1991; Sharp, 2016; Tobin, 1958, 1965; Uotshem, 1999). This article understands the selection of guidelines as the selection of such funds (indexes) that allow optimizing the expected profit with the limited growth of risks. The procedure of grouping of leading tools is close in nature to the methodology of “the winner modelling” (Damodoran, 2007; DeBondt, 1985; Jegadeesh, 1993) as well as to O`Shaughnessy’s (2005) method, where the authors based on the wide variety of real instances proved practical feasibility of the models offered by them.
Following Markovitz (1952, 1959, 1987, 1991) as the expected return we take the simple medium per each fund (index) and as the measure of the expected risk the corresponding standard error of the mean. All the calculations were performed with training sample solely (Table
Here Dx – the expected return, and Rs – the risk rate. The maximum and the minimum of the return, the risk and the return-risk ratio (Table
In the light of the principles of the portfolio theory above all the funds are compared in pairs by the return and risk value (in the case of parity of returns, those values with higher risk are excluded from consideration, and on the contrary, at risk parity the values with lower return are excluded).
Findings
The procedure above determined the following group of leading funds (Table
The deceptively simplicity of the rules of shaping the leading funds group represented above in reality requires exact formalization of implementation in order to provide repeatability and reproducibility of the exception process of outsiders. The basic stages of the procedure to shape the leading group is as follows:
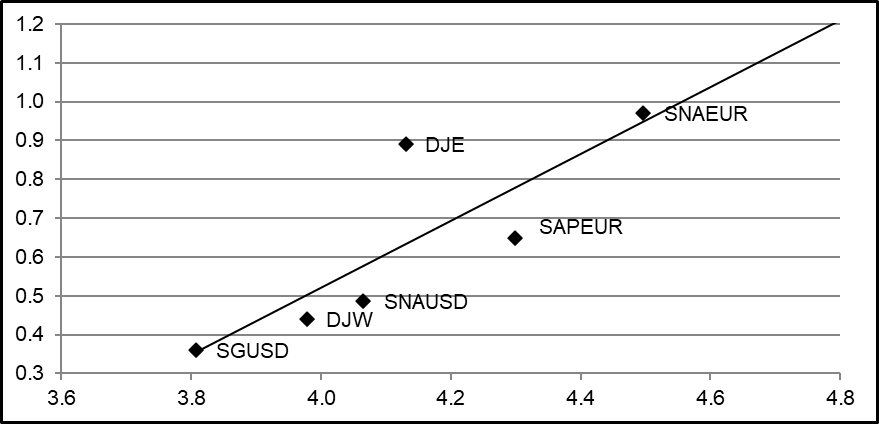
A dot diagram is constructed according to the original data in MS EXCEL. The risk value of the corresponding fund is plotted on the abscissa, and the expected return – on the ordinate.
The trend running line is constructed on the scatter dot diagram based on the original data set, and the current value of the determination coefficient is displayed onscreen.
The dots below the trend line are considered primarily. Those of them that correspond the rules above are excluded from further consideration. The adequacy of the exception process of outsider funds and the shaping of the leading funds group is checked by the determination coefficient. Then, the analysis includes the other points of the “Return-Risk” plane.
The final form of the scatter diagram looks as follows (Figure
According to the data of the leading funds group (Table
Here Dx – Return (%), Rs – Risk (standard error of the mean), R² – determination coefficient. The determination coefficient value shows that the given model is appropriate for practical application. The standard errors of the model coefficients estimated with 95 % confidence probability level, are notably lower than the corresponding coefficient modules, which proves that the synthesizable model can be implemented in investment practice.
The resultant group of the leading funds and their symbols are as follows (Figure
DJ Equity REIT Total Return (REIT) – DJE,
DJ Global Select REIT (DWGRT) – DJG,
STOXX Asia/Pacific 600 REIT EUR – SAPEUR,
STOXX Global 1800 REIT USD – SGUSD,
STOXX North America 600 REIT EUR – SNAEUR,
STOXX North America 600 REIT USD – SNAUSD.
Formation of the widely diversified investment portfolio starts with the preparatory statistical manipulation of the historical data. The necessary element of it is the correlation analysis which allows evaluating the strength of relationship between the investment tools. The best configuration of the tools is based on the results of the conducted analysis. In fact, shaping a portfolio requires the tools which are:
the least correlated between each other, what apparently improves the investment qualities of the portfolio (Markovitz, 1952, 1959, 1987, 1991);
showed the best results in terms of the key criteria of the portfolio analysis. This work employed the expected return – risk ratio as it.
In order to receive a comprehensive idea of the strength of returns relationship within the leading funds group (Table
In the leading funds group in focus the correlation coefficients range from 0.66 (the lowest value) to 0.99 (the highest value). Table
As for the results of the correlation analysis, it is worth noting that SAPEUR and SNAEUR funds do not have high correlation values with other funds (lines 3 and 5 Table
The model verification. The quantitive evaluation of investment potential of DJ Equity REIT Total Return (REIT), STOXX Asia/Pacific 600 REIT EUR and STOXX North America 600 REIT EUR funds as a primitive portfolio with equal values was conducted. The practical approval of the indexes above was undertaken on independent material from 01.01.2017 until 31.03.2019. At average per index for the whole period mentioned, the gained (saved) profit constituted 14.52 % (i.e. 6.45 % per year). And the average profit per index per month made up 0.54 %. According to the assessment of various authors, the annualized gain of real estate funds range between 2–3 and 4 – 5 % per year, though in some periods it can considerably deviate from these values (Abdullaev, 2017). The flow of the saved return on independent material of the subgroup above is shown on Figure
The average monthly saved return per fund in other clusters is notably low and accounts 9.61, 12.88 and 12.9 %, respectively, etc. Hence, the analyzed portfolio can be recommended to use in investment practice.
Figure
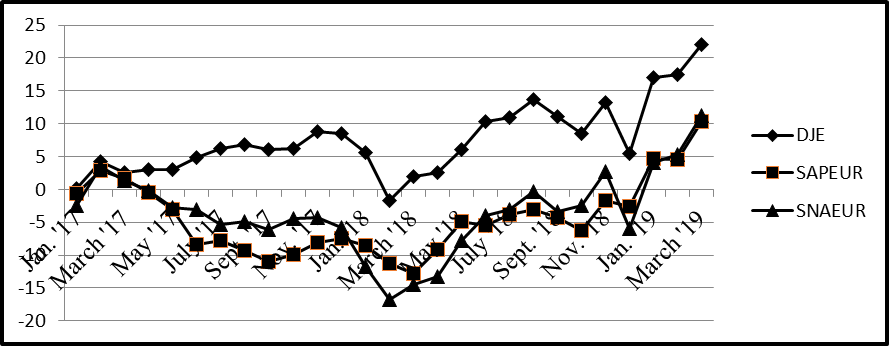
The basic profit earner of Equity REIT funds is rental fees from the objects they own. Consequently, in the time span in focus (2013–2019), this kind of business ranges among the most profitable ones. Some negative results should be noted as well: all the three funds on independent material early in 2018 simultaneously bore losses, to one degree or another. This means that the portfolio has to be diversified wider, including bonds and stocks, other securities, exchange commodities, and many others.
Conclusion
The main conclusions are as follows:
21 real estate funds were considered, and it resulted in a leading group which contains 3 funds: DJ Equity REIT Total Return (REIT), STOXX Asia/Pacific 600 REIT EUR and STOXX North America 600 REIT EUR.
The group of leading funds was practically approved on vast real data. The received return estimate is coherent with expert estimates.
REIT funds can and should be considered as one of the integral parts of the investment portfolio.
The further research trends:
Construction of some investment portfolios from Markovitz model.
Practical approval of widely differential investment portfolios including real estate funds, risky and risk-free assets, etc.
References
- Abdullaev, G. V. (2017). Analysis of the foreign Reit funds. In XXXIV int. student sci. and pract. Conf., 23(34). Novosibirsk.
- Belyh, L. P. (2010). Property Portfolio Management. Infra-M.
- Bocharov, V. V. (2009). Investment. Moscow.
- Bogl, J. (2013). Do not believe the numbers! Reflections on investors’ fallacies, capitalism, mutual funds, index investing, entrepreneurship, idealism and heroes. Alpina Publ.
- Bragin, V. V. (2012). A model for the formation of an investment strategy of a company in the real estate market. Microecono., 2, 58–59.
- Brenstain, U. (2013). Investor Manifest: Getting Ready for Shocks, Prosperity, and More. Alpina Publ.
- Burenin, A. N. (1998). Securities and Derivatives Market. 1 Federal Bookselling Company.
- Burenin, A. N. (2008). Portfolio Management. Academician S.I. Vavilov Sci. and Techn. Society.
- Damodoran, A. (2007). Investment Valuation: Tools and Methods for Valuing Any Assets. Alpina.
- DeBondt, W. F. (1985). Does the stock market overreact? J. of Finance, 40, 793–805.
- Fabocci, T. J. (2000). Investment management. INFRA-М.
- Fama, E. F. (1988). Permanent and Temporary Components. J. of Polit. Econ., 96, 246–273.
- Gercekovich, D. A. (2017). Formation of an optimal investment portfolio for a complex of effective portfolios. Bull. of Moscow Univer. Ser. Econ., 5, 86–101.
- Gercekovich, D. A. (2018). Analysis of the state and forecast of the dynamics of US industries according to the “Profit-Risk” model. News of higher ed. instit. Ser. Econ., Finance and Product. Managem., 03(37), 45–53.
- Jegadeesh, N. (1993). Returns to buying winners and selling losers: Implications for stock market efficiency. J. of Finance, 48(1), 65–91.
- Markovitz, H. M. (1952). Portfolio selection. J. of Finance, 7(1), 77–91.
- Markovitz, H. М. (1959). Portfolio Selection: Efficient Diversification of Investments. Wiley.
- Markovitz, H. M. (1987). Mean-variance Analysis in Portfolio Choice and Capital Market. Blackwell.
- Markovitz, H. M. (1991). Portfolio Selection. Efficient Diversification of Investments. Blackwell.
- Miller, J. (2017). Investment Rules Warren Buffett. Alpina Publ.
- Neprienkov, S. G. (2008). Real estate funds as an effective tool for tax optimization. Sci. and Techn. Bull. of St. Petersburg State Univer. of Inform. Technol., Mechan. and Optics, 50, 166–171.
- O`Shaughnessy, J. (2005). What Works in Wall Street. McGraw-Hill.
- REIT (2019). Group Exchange Data. https://www.reit.com/what-reit.
- Robins, T. (2017). Money. Game Master. Popurri.
- Sharp, U. (2016). Investment. INFRA-М.
- Tobin, J. (1958). Liquidity Preference as Behaviour towards Risk. Review of Econ. Studies, 26(1), 65–86.
- Tobin, J. (1965). The Theory of Portfolio Selection. Theory of Interest Rates. MacMillan.
- Uotshem, T. J. (1999). Quantitative Methods in Finance. Finance, UNITI.
Copyright information

This work is licensed under a Creative Commons Attribution-NonCommercial-NoDerivatives 4.0 International License.
About this article
Publication Date
31 October 2020
Article Doi
eBook ISBN
978-1-80296-091-4
Publisher
European Publisher
Volume
92
Print ISBN (optional)
-
Edition Number
1st Edition
Pages
1-3929
Subjects
Sociolinguistics, linguistics, semantics, discourse analysis, translation, interpretation
Cite this article as:
Gercekovich, D. A., Gorbachevskaya, E. Y., Grigorova, L. E., & Arkhipkin, O. V. (2020). Quantitive Evaluation Of Investment Performance In Real Estate Funds. In D. K. Bataev (Ed.), Social and Cultural Transformations in the Context of Modern Globalism» Dedicated to the 80th Anniversary of Turkayev Hassan Vakhitovich, vol 92. European Proceedings of Social and Behavioural Sciences (pp. 383-390). European Publisher. https://doi.org/10.15405/epsbs.2020.10.05.50