
Integral Modelling Of The Quality Of Life Of The Region’s Population


Abstract
The quality of life has been recognized a key factor in the socio-economic development of a region. The study aims to develop an integral indicator of the people’s quality of life (the case of Kemerovo Region, Russia), to identify and assess its economic determinants. The analytical framework includes 25 socio-economic indicators collected from open data sources for 16 years (2003–2018). For an integral assessment of the quality of life, the authors used the Saaty analytic hierarchy process. To assess the influence of economic factors, the methods of regression and factor analysis were employed. The results obtained allow the authors to identify two pronounced periods of decline in the integral indicator of the quality of life: in 2008–2010 and in 2014–2016, which coincide with the timeframe of the global financial and sanction-related crises in Russia. The factor analysis identified two main (latent) components of the level of economic development. The regression analysis revealed three key control parameters in the impact of indicators of the economic development level on the people’s quality of life: the amount of gross regional product (GRP), fixed capital investments in comparable prices, and the proportion of unprofitable enterprises. The calculations were performed with Statistica software. The research results contain significant information for authorities to be used in the formation of development strategies for regions.
Keywords: Quality of liferegionintegral assessmentmodellingthe level of economic developmentmanagement
Introduction
Improving the quality of life is an indisputable priority, a key strategic task and a development benchmark for any constituent entity in a modern democratic society with a free-market economy (Ivanov, 2015). It is no coincidence that it is the improvement in the living standard and life quality of people that underpins all strategic development plans of any authorities. The authors regard the life quality as a comprehensive assessment of a person’s rate of satisfaction with life support, social and spiritual needs determined by objective characteristics of the current social and economic system and features of a person’s life perceived subjectively (Mukhacheva & Morozova, 2018).
Managing the quality of life at the federal, regional and municipal levels is inconceivable without modern systems of mathematical and economic-statistical modelling employing specialized software products (Okrepilov et al., 2015; Swasthaisong et al., 2019; Zubets, 2014). This allows forming comprehensive and correct views of the authorities and the population on the current development priorities of their region, the results already achieved and the prerequisites for further improvement (Rosenthal & Gabriel, 2000).
Problem Statement
The key problem of the study is the urgency of updating the methodological and procedural apparatus for modelling, specific and integral assessment of the people’s quality of life in a particular region and the identification of its economic determinants to be employed in developing a regional development strategy.
Classification of approaches to studying the life quality
General approaches to studying the quality of life are divided within the essential dichotomy of objective and subjective types. The objective quality of life is studied from the outside and mainly on the basis of open statistical data on various spheres of social life (including the well-known methods of S.A. Ayvazyan, V.V. Kosov, V.V. Drobysheva, and B.I. Gerasimova), the subjective quality is evaluated from the inside as perceived satisfaction with various aspects of life, which is done mainly with sociological tools, various questionnaires (the most popular methods were developed by A.A. Shcherbakova, A.A. Zabavskaya, T.N. Savchenko, G.M. Golovina, S. Lyubomirsky, E. Diener and K. Ryan). There have also been attempts to integrate both approaches undertaken by the members of the Laboratory for studying the quality of life M.N. Alferova, V.P. Babintsev, and A.L. Belov, as well as independent researchers M.Sh. Salimov, E.V. Pankratova, W. Glatzer and J. Mora (as cited in Kuznetsov et al., 2017; Okrepilov & Chudinovskikh, 2018).
Modelling of the systems for managing life quality, of the formation of mechanisms for goal-setting and revision of management criteria, and, finally, the means of supporting strategic decision-making for social economic systems of various levels are highly sophisticated tasks which necessitates the search for new methodological approaches. Today, researchers are increasingly employing optimization in mathematical models of various socio-economic systems, expert assessment and forecasting the people’s quality of life. Universal mathematical and computer-assisted tools and their applications for new spatial development formats are being developed (Richardson et al., 2004).
Economic and statistical models of the quality of life
Most mathematical models of the life quality are based on economic-statistical methods of processing statistical data from open sources (Breuer & Brueser, 2012). For example, a wide range of indicators for assessing life quality is used by the rating agency RIA Rating (Rating of Regions by their Quality of Life, 2014), including 61 indicator grouped into 10 categories: housing condition; income level; environmental and climatic condition; educational attainment and public health; infrastructure facilities; demographic situation; area development; transport infrastructure development; the economic development level; and the small business development level.
Many researchers are trying to determine the relationship between the level of economic development and the quality of life by mathematical methods (Easterlin & Angelescu, 2007). For example, Emtseva et al. (2015) developed a corresponding regression equation, which shows a direct dependence of GRP on the proportion of population employed in organization, marriage rate, the area of the housing stock equipped with water supply and central heating, the average monthly salary, the amount of household services, and the turnover of catering and retail sectors. The reverse dependence on the remaining factors was also noted. The study in question used statistical data for 80 regions processed with STATA package for 2008–2013 (6-year period). The researchers built models for pooled regressions and principal component regressions (Emtseva et al., 2015).
A system of integral assessment of life quality was by proposed Ayvazyan (2000). The author distinguishes 5 of its main areas: the quality of the population (defined as the possibilities of health reproduction, family formation, as well as high levels of culture, education, and qualifications), the welfare of the population (understood conventionally as the level of the household budget, possibility of obtaining private property, infrastructure, and self-sufficiency of the area in economic development), quality of the social sphere (considered in terms of working conditions, safety, signs of social pathology, social and political health), the quality of the ecological niche (the condition of air, water, soil, and the diversity of flora and fauna in ecosystems), environment and climate (defined as the availability and amount of natural resources, climatic conditions, and the number of natural disasters) (Ayvazyan, 2000). While the methodology described above is among the most comprehensive ones and includes a convolution of private indicators available in open sources of statistical data, it is also a very time-consuming procedure requiring special preparation.
It can be concluded that in an array of models for assessing the life quality of the population and its components economic-statistical models relying on open data sources prevail. However, there are no procedures for integrating heterogeneous life quality indicators that meet the requirements of completeness in covering all life spheres, and that do not require from authorities to master advanced mathematical methods of data processing. Moreover, it is essential that such procedures include reasonable and affordable logical tools to determine the weighing factors of particular indicators to account for their unequal effects.
Research Questions
What methods of modelling and assessing the people’s life quality in a region exist currently?
What is the way of conducting an integral assessment of life quality in a region to reflect all of its key spheres logically and lucidly?
Which economic factors and to what extent affect the life quality in a particular region?
What control variables can be identified to improve the quality of people’s life in a particular region?
Purpose of the Study
The paper is aimed at developing an integral indicator of the people’s quality of life (the case of Kemerovo Region), to identify and evaluate its economic determinants.
Research Methods
Formation of the analytical framework
To analyze the quality of life of Kemerovo Region’s population, the study considered the dynamics of 25 socio-economic indicators of the region openly published by statistical services. 16 of these indicators characterize the life quality and 9 deal with economic development level and the amount of social spendings. The final list of indicators was composed according to the principles of completeness and sufficiency, economic feasibility, unambiguity in interpretation and significance for the socio-economic development of the region, predictability, promptness of publication and the time periods for which data are available (for the methodology to be applied in future). Cost indicators were recalculated in comparable prices to ensure that they can be compared.
The analytical framework of the study covers a period of 16 years (2003–2018) and includes the latest available data from federal and regional statistical agencies. Data processing was completed with Statistica (version 10) software.
The analyzed life quality indicators can be grouped into the following blocks for a more detailed consideration of their dynamics: demography (natural increase, ppm; life expectancy, years; migration increase, per 10,000 people; divorce ratio per 1000 marriages); standard of living (real cash income, % of the previous year; poverty incidence, %; R/P ratio (income differentiation), times); education (the number of students enrolled in bachelor’s, long first degree, master's programmes, per 10,000 people; enrollment of children in preschool educational institutions, as a percentage of the number of preschool-age children); health care (number of medical doctors per 10,000 population; general incidence rate, cases per 1000 population); culture (the number of spectators in professional theaters per 1000 people); labour market (unemployment rate, %); ecology (atmospheric emissions from stationary sources, tons per capita); law enforcement (the number of recorded crimes per 100,000 people).
Indicators of economic development level and the amount social spendings include index of physical quantity of GRP per capita, % of the previous year; industrial production index, % of the previous year; number of enterprises and organizations; the number of advanced manufacturing technologies developed; the share of cultural and social events in the total expenditures of the consolidated budget, %; the index of physical amount of fixed investments, % of the previous year; the proportion of unprofitable enterprises; GRP in comparable prices; fixed investment in comparable prices.
To calculate the integral life quality indicator, all specific indicators were divided into two blocks, depending on whether their increase or decrease contributes to changes in resulting indicator (interpreted positively). This enabled us to apply particular formulas to each of the blocks to standardize data and unify their dimension (corresponding calculations were made).
Calculation of an integral indicator of the quality of life
To calculate an integral indicator of the quality of life, the method of Saaty (2008) analytic hierarchy process was used, which belongs to the group of expert and criteria methods. Rather than providing the “correct” solution, this tool enables the management subjects to find the most suitable (optimal) option for them, with regard to their vision of the situation and prioritization. The relative simplicity of the method of Saaty (2008) analytic hierarchy process, which does not require laborious mathematical calculations, and its proven effectiveness contributed to its broadest adoption in managerial practice worldwide.
The method implementation involves passing a series of iterations: determining the key problem and goal; identification and description of basic criteria by means of alternative analysis; the formation of hierarchies by passing from the objective tree to the analyzed alternatives; the analysis of the resulting matrices using a special technique; and the calculation of weighting factors for each alternative within the formed hierarchy system.
In addition to evaluating and choosing alternatives when making decisions, the method contains an effective logical toolkit for aggregating specific features of the studied object with the possibility of constructing its integral value based on weighing factors determined by experts.
To compile the primary matrix, it is necessary to perform pairwise comparison of indicators in terms of their significance for the formation of the integral life quality indicator with subsequent conversion to points. The comparison is performed on the basis of the following pattern: Indifferent, equal = 1; slightly better (worse) = 3 (1/3); better (worse) = 5 (1/5); significantly better (worse) = 7 (1/7); and fundamentally better (worse) = 9 (1/9)
Intermediate position of 2, 4, 6, 8 can also be used in situations where another way of differentiation is difficult. First, it is necessary to compose a matrix of expert estimates obtained on the basis of pairwise comparison of the significance of specific indicators for the formation of the overall quality of life, where is the ratio of criterion i to criterion j; ; =1.
Following that, it is necessary to find the total for the elements in the columns.
At the next stage, all the elements of the original matrix of estimates are divided by the sum in the columns (the matrix is normalized).
The result of the calculations will be the desired weighing factors for specific life quality indicators. The integral indicator of the people’s life quality is calculated as the total of the results of these factors with the value of indicators at a certain moment of time.
Regression analysis of the life quality and the economic development level
At the next stage, the study considered the impact of indicators of the economic development level on the region’s population life quality. We applied the function of regression analysis taking an integral life quality indicator as the dependent variable and indicators of the economic development level and social spendings as the independent variables.
When conducting a regression analysis, it is recommended that the number of observations be at least 7–8 times the number of analyzed variables (Burla et al., 2019). Therefore, for 16 periods (2003–2018) there can be a maximum of two variables. Regression analysis was performed with Statistica software by selecting Stepwise (variable) procedure and activating the function of Stepwise or Ridge Regression.
Findings
The results of integral modelling of the quality of life
The results of applying the Saaty (2008) analytic hierarchy process to identify the weighting factors of variables are summarized in Table
According to the data obtained, the highest weighting factors were found for the indicators of life expectancy (0.17), growth in real cash incomes of the population (0.15), poverty incidence (0.14), and the R/P ratio (0.11). The following indicators affect the resulting value of the quality of life indicator least: the number of spectators in professional theaters (0.02), medical doctors (0.02), recorded crimes (0.02), and atmospheric emissions (0.02) in relation to the number of people, the divorce rate per 1000 marriages (0.02), and enrollment of children in preschool educational institutions (0.01).
The developed weighing factor system for life quality indicators is universal for various regions and time periods. We applied it to the analyzed statistical data on the socio-economic development of Kemerovo Region in 2003–2018.
The data on the value and dynamics of the integral index of the people’s quality of life are presented in Figure
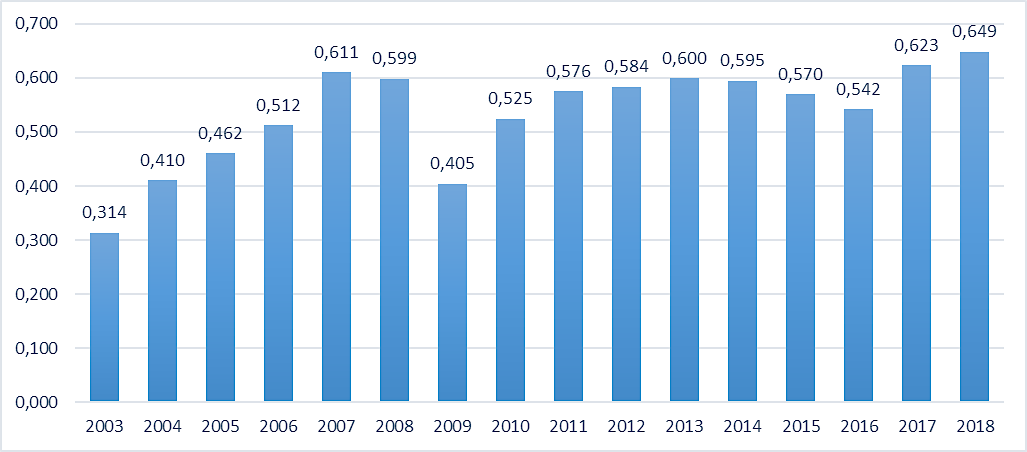
The resulting data reveal two pronounced periods of decrease in the integral index of the people’s quality of life in Kemerovo Region in 2008–2010 and 2014–2016, which coincides with the timeframes of the global financial and sanction-related crises in Russia.
The results of a regression analysis of the impact of economic indicators on the life quality in the region
Using regression analysis, it was possible to form three significant equations of paired regression for the integral life quality indicator ( ), calculated by the method of Saaty (2008) analytic hierarchy process, and for the following indicators of economic development level:
1) the proportion of unprofitable enterprises ( ). The constructed regression equation has an average coefficient of determination ( = 0,375), which means that 37.5% of the variability of the integral life quality indicator is determined by the dynamics of the proportion of unprofitable enterprises, with the inverse relationship.
2) GRP in comparable prices ( ). The constructed regression equation has an average coefficient of determination ( = 0,49), which means that 49% of the variability of the integral life quality indicator is determined by the GRP dynamics in comparable prices.
3) Fixed investments ( ). The constructed regression equation has an average coefficient of determination ( = 0,413), which means that 41.3% of the variability of the integral life quality indicator is determined by the dynamics of fixed investments.
Significant results of multiple regression were also obtained, where the integral life quality indicator ( ) is the independent variable, and the GRP amount in comparable prices ( ) and the share of social and cultural events in the total expenditures ( ) are the dependent variables. The constructed regression equation has a high coefficient of determination ( = 0,696), which means that 69.6% of the variability of the integral life quality indicator is determined by the dynamics of independent variables.
The factor analysis was applied for consideration and economic justification of the relationship between the independent variables represented by indicators of the economic development level and social spendings. The above-mentioned toolkit is aimed at grouping variables and identifying the main (latent) components by evaluating the Euclidean space between them in a graphical expression and using Varimax rotation. The results are summarized in table
From a substantive point of view, the first factor includes basic absolute indicators of economic development (hereinafter referred to as “basic”), the second factor includes index indicators (hereinafter referred to as “index”).
The next stage was an attempt to construct a regression equation for the integral life quality indicator with the two identified factors of economic development, which proved to be successful only for the first basic factor, including substantial parameters of the economic development level (the proportion of unprofitable enterprises, GRP in comparable prices, and fixed investment).
The constructed regression equation has an average coefficient of determination ( = 0,411), which means that 41.1% of the variability of the integral life quality indicator is determined by the dynamics of the indicator in question.
,
where is the basic factor of the economic development level;
is an integral life quality indicator.
The formed regression model once again proves a significant economic determination of the integral quality of life in the region.
Conclusion
Thus, as a result of an empirical analysis of the life quality indicators and the economic development level of Kemerovo Region for 2003–2018 it was possible to construct a series of significant regression equations describing the impact of economic indicators on the integral life quality indicator. The results of factor analysis of the indicators of the economic development level enabled distinguishing between them and identify two factors – a basic and an index one, and to obtain a new regression model of economic determination of the quality of life based on the identified factors.
In the course of economic-statistical and mathematical analysis, the following control factors of the population’s integral life quality were identified represented by independent variables: the volume of GRP in comparable prices (determines a change in the quality of life by 49%), fixed investment (accounts for 41.3% of the life quality dynamics), and the proportion of unprofitable enterprises (accounts for 37.5% of changes in the quality of life).
Managing the life quality of the population in Kemerovo Region supposes regulating these economic development indicators, which is possible with increased support for entrepreneurship, the formation of an appropriate business infrastructure, the promotion of demand for goods and services of regional origin in the Russian and foreign markets (which is especially essential under the conditions of a significant fall in coal prices), and further diversification of the economy of the region.
Summarizing the above, it can be noted that mathematical modelling of the life quality of the region’s population and the identification of its relationship with economic indicators is a powerful, convenient and relatively affordable tool for monitoring the socio-economic situation in the region, which allows obtaining significant meaningful results for the accurate management of “problem areas” in the regional economy. Studying this topic is crucial for the formation of a development strategy for the region, as it allows developing new mechanisms for improving people’s lives, which is a key priority for the development of the region.
Acknowledgments
This paper was supported with an intra-university grant of Kemerovo State University.
References
- Ayvazyan, S. A. (2000). Integral'nyye indikatory kachestva zhizni naseleniya: ikh postroyeniye i ispol'zovaniye v sotsial'no-ekonomicheskom upravlenii i mezhregional'nykh sopostavleniyakh [Integral Indicators of the Quality of Life of the Population: their Formation and Use in Social and Economic Management and Interregional Comparisons]. CEMI RAS [in Rus].
- Burla, M. P., Burla, O. N., & Prodanov, F. P. (2019). Factor Analysis as a Tool for Studying and Developing of Spatial Social and Economic Systems. Bulletin of Transnistrian University. Series: Humanitie, 1-1(61), 190-197. [in Rus]
- Breuer, W., & Brueser, D. (2012). Determining Indicators of Quality of Life Differences in European Cities. EIBURS RWTH Aachen Working Paper,1.
- Easterlin, R. A., & Angelescu, L. (2007). Modern Economic Growth and Quality of Life: Cross Sectional and Time Series Evidence. IEPR Working Paper No. 07.4; IZA Discussion Paper No. 2755; USC CLEO Research Paper No. C07-7.
- Emtseva, E. D., Morozov, V. O., & Cherkasova, E. Z. (2015). Econometric Studies of the Relationship of GRP and Indicators of the Quality of Life. Basic Research, 11-6, 1175-1179. [in Rus]
- Ivanov, V. V. (2015). Innovatsionnaya paradigma XXI. [Innovative Paradigm XXI]. Nauka [in Rus]
- Kuznetsov, S. V., Rastova, Yu. I., & Rastov, M. A. (2017). Rating Assessment of the Quality of Life in Russian Regions. The economy of region, 13(1), 137-146. [in Rus]
- Mukhacheva, A. V., & Morozova, E. A. (2018). Living level: regional differences (by example of Siberian federal district). European Proceedings of Social and Behavioural Sciences, XXXV(35). https://dx.doi.org/10.15.405/epsbs.2018.02.112
- Okrepilov, V. V., Makarov, V. L., Bakhtizin, A. R., & Kuzmina, S. N. (2015). The Use of Supercomputer Technologies for Modelling Social and Economic Systems. The economy of region, 2, 301–312. [in Rus]
- Okrepilov, V. V., & Chudinovskikh, I. V. (2018). Formation of Approaches to the Standardization for Assessing the Quality of Life. Petersburg Journal of Economics, 1, 6-15 [in Rus].
- Reyting regionov po kachestvu zhizni [Rating of Regions by their Quality of Life] (2014). RIA Rating. [in Rus]
- Richardson, J., Atherton Day, N., Peacock, S., & Iezzi, A. (2004) Measurement of the Quality of Life for Economic Evaluation and the Assessment of Quality of Life (Aqol) Mark 2 Instrument. Australian Economic Review, 37, 62-88.
- Rosenthal, S. S., & Gabriel, S. A. (2000). Quality of the Business Environment Versus Quality of Life in a Dynamic Model of Urban Composition and Growth Do Firms and Households Like the Same Cities. USC Finance & Business Econ. Working Paper, 01-23.
- Saaty, L. L. (2008). Prinyatiye resheniy pri zavisimostyakh i obratnykh svyazyakh: Analiticheskiye seti [Decision Making with Dependencies and Reverse relationships: Analytical Networks]. LKI [in Rus]
- Swasthaisong, S., Romyen, L., Swasthaisong, P., Chomphunut, P., & Romyen, L. (2019). Problems, Needs, Quality of Life and the Development Model of Production Efficiency and Value Creation of Agricultural Products of Community Enterprises. Journal of Interdisciplinary Research: Graduate Studies, 2(8).
- Zubets, A. N. (2014). Issledovaniye kachestva zhizni v rossiyskikh gorodakh: otchet o NIR. [A Study of the Quality of Life in Russian Cities: a report of the study led by Zubets, A.N.]. Financial University at the Government of the Russian Federation. [in Rus]
Copyright information

This work is licensed under a Creative Commons Attribution-NonCommercial-NoDerivatives 4.0 International License.
About this article
Publication Date
20 October 2020
Article Doi
eBook ISBN
978-1-80296-089-1
Publisher
European Publisher
Volume
90
Print ISBN (optional)
-
Edition Number
1st Edition
Pages
1-1677
Subjects
Economics, social trends, sustainability, modern society, behavioural sciences, education
Cite this article as:
Morozova, E. A., Mukhacheva, A. V., Kiryukhina, A. N., & Egorova, N. M. (2020). Integral Modelling Of The Quality Of Life Of The Region’s Population. In I. V. Kovalev, A. A. Voroshilova, G. Herwig, U. Umbetov, A. S. Budagov, & Y. Y. Bocharova (Eds.), Economic and Social Trends for Sustainability of Modern Society (ICEST 2020), vol 90. European Proceedings of Social and Behavioural Sciences (pp. 269-278). European Publisher. https://doi.org/10.15405/epsbs.2020.10.03.31