
Analytical Research Of Statistical Information About Road Traffic Accidents In Yakutsk


Abstract
The development of the urban environment is directly related to the ratio of vehicles to population, due to the increase in distances. Practice shows that the growth rate of the number of cars exceeds the rate of increase in traffic capacity of roads. Today, there is congestion in roads and an increase in road accidents, environmental degradation, which is a security threat and affects the comfort of the urban environment. The number of cars in Yakutsk increased by 65% over 11 years (since 2005). The purpose of the article is to establish statistical trends in traffic accidents in Yakutsk by examining statistical information about them. In the study of information about traffic accidents in Yakutsk for 16 years (since 2004), statistical and analytical methods of analysis were used. As a result of mathematical processing of statistical information about road accidents in Yakutsk, it was found that: their number is seasonal; their number increases from March to September; their number in the warm season is 2.5 times greater than in the winter season; their number tends to increase; the number of victims and those killed in them tends to decrease; the number of deaths in traffic accidents over the past 5 years has decreased by 3 times.
Keywords: Road traffic accidentsnumberdistributionstatistical informationrelationshiptrend
Introduction
The process of urban growth is inevitably associated with an increase in the level of the ratio of vehicles to population. An analysis of the population of Yakutsk urban district according to state statistics from 2004 to 2019 inclusively showed an increase of more than 40% (Official statistics of the Federal state statistics service for the Republic of Sakha (Yakutia), 2020), which indicates active urbanization. The number of cars in Yakutsk over 11 years (since 2005) increased by 65% (Osipova & Vinokurova, 2017), which shows the active ratio of vehicles to population.
Active ratio of vehicles to population has led to congestion in roads and increased accident rates on roads, environmental degradation, which is a security risk and affects the comfort of the urban environment (Hossain & Faruque, 2019; Ishkov et al., 2017; Ishkov et al., 2018).
Problem Statement
Yakutsk is the capital of the Republic of Sakha (Yakutia). According to statistics, traffic accidents can be associated with careless behavior, inattention of drivers, poor road conditions, lack of road markings, high traffic density, climatic conditions, cosmic effects on a person’s condition, and poor driver training (Babkov, 1993; Boyarshinov et al., 2014; Chizhevskij, 1976; Cornelissen et al., 1994; Favour, 2016; Goswami & Sonowal, 2011; Johns, 1979; Kuryanova, 2014; Samsonov et al., 2014; Strekalovskaya et al., 2018; Tefft, 2017). The quality of the road conditions is influenced by climatic conditions. The main feature of the climatic conditions of Yakutsk is a clear division into seasons. With year-round operation of cars, drivers are forced to prepare their cars for use for a certain time of the year. At low climatic temperatures, some drivers are forced to stop using cars. Because of what, the number of cars on the road varies seasonally. Therefore, the number of traffic accidents varies.
The problem of road safety with active automobilization in the Nordic conditions was the main reason for this study.
Research Questions
This study addressed the following questions have been considered in this article:
What is the dynamics of the number of traffic accidents in Yakutsk?
Does seasonality influence the number of traffic accidents?
How has the number of people injured in traffic accidents changed?
How has the mortality rate in road traffic crashes changed?
What affects the number of traffic accidents?
Purpose of the Study
The purpose of the study is to establish statistical trends in traffic accidents in Yakutsk by examining the statistical information about them.
The answers to the questions posed in the study helped to achieve the goal and make it possible to contribute to understanding the overall picture in the statistics of road accidents.
Research Methods
In the study of information about traffic accidents in Yakutsk, statistical and analytical methods of analysis were used. An analysis of statistical information on road traffic accidents in Yakutsk over 16 years (since 2004) was performed.
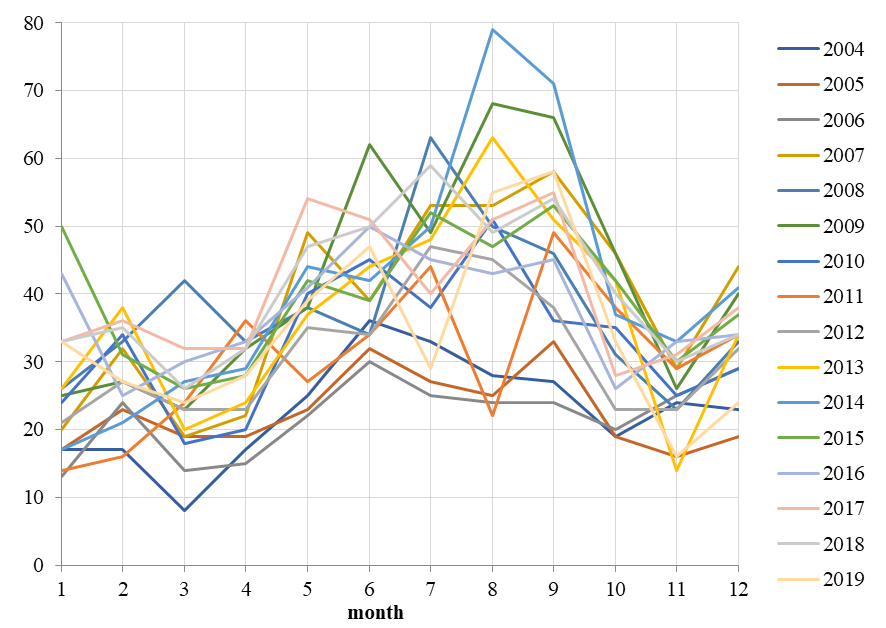
To establish indicators characterizing statistical trends in traffic accidents in Yakutsk, statistical information on their number over 16 years was used. Data of government statistics (Official statistics of the state road safety Inspectorate of the Ministry of internal Affairs of the Russian Federation for the Republic of Sakha (Yakutia), 2020; Road accident map project, 2020) on the number of accidents for the period from 2004 to 2019 are presented in graphs (Figure
Findings
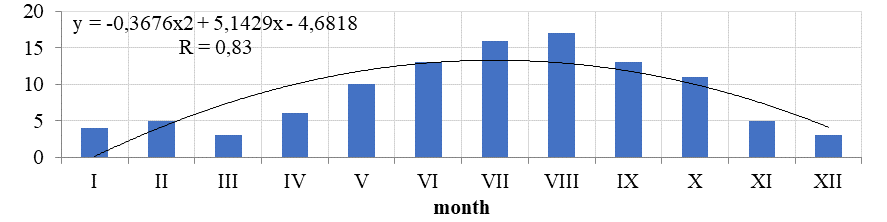
To establish the type of trend, the number of accidents is summarized by the months of the year and presented as a histogram in Figure
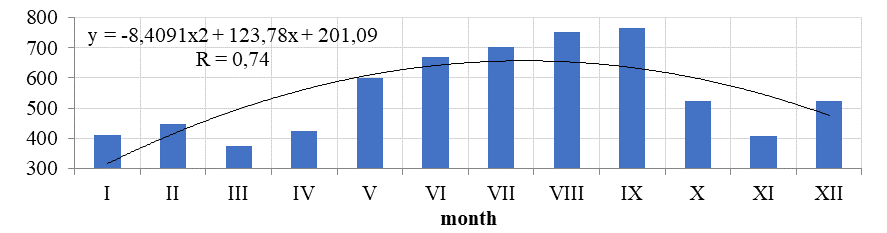
The nonlinear correlation coefficient R=0.74 indicates the presence of a certain dispersion, as well as the dependence of the number of accidents on the time of year. The graph shows that there is an increasing trend in the number of accidents before the beginning of autumn season. The increase in the number of accidents occurs from March to September, due to an increase in the number of cars on the roads due to car owners operating their cars in the warm season and the emergence of new car owners on the roads who have completed driving courses. The sharp decline is due to the onset of the autumn-winter period of the year with low temperatures, when car owners without warm garages and warm parking spaces are forced to stop using cars. A slight variation in the number of accidents from November to February is explained by the adaptation of drivers to poor road conditions (fog, ice, short daylight hours).
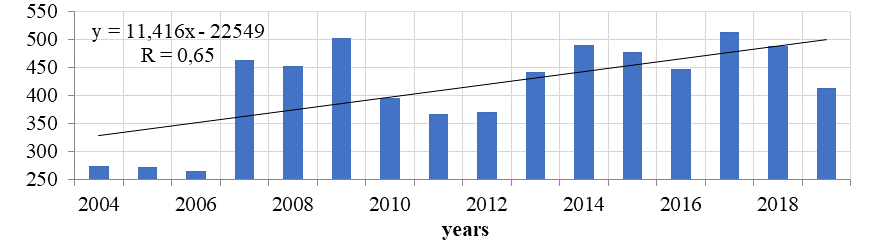
To establish the overall dynamics of road accidents over 16 years, we constructed a histogram shown in Figure
Traffic accidents are usually associated with injured and deceased people; therefore, to determine the level of safety, diagrams of the number of victims and fatalities in traffic accidents were constructed (Figures
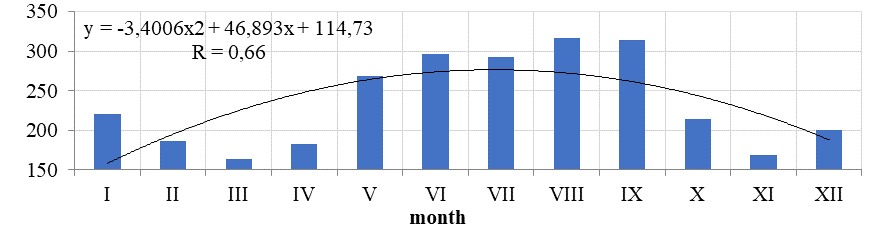
The correlation coefficients R=0.66 and R=0.83 indicate the presence of a nonlinear dependence of the number of victims and deaths in road accidents on the time of year. It can be seen that the peaks and decays of the diagrams coincide with the diagram in Figure
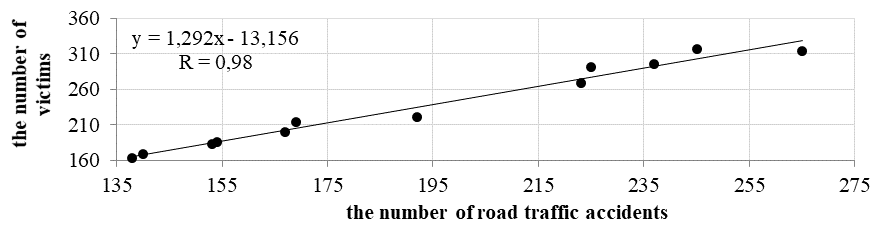
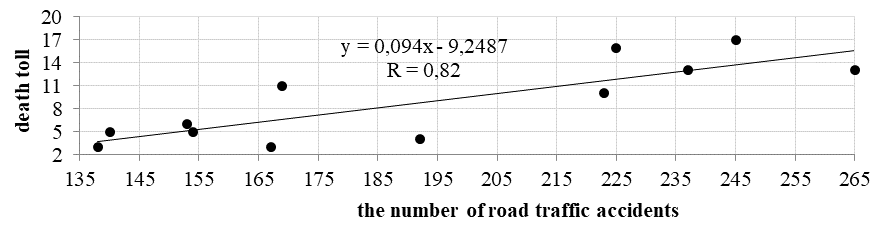
The values of the obtained correlation coefficients R=0.98 and R=0.82 indicate the presence of a significant relationship between the number of accidents and the number of injured and killed in them. It can be seen that with an increase in the number of accidents, the number of victims and those killed in them increases. Therefore, to verify this fact and establish a trend in the statistics of victims and fatalities in road accidents, the graphs shown in Figures
From the graph in Figure
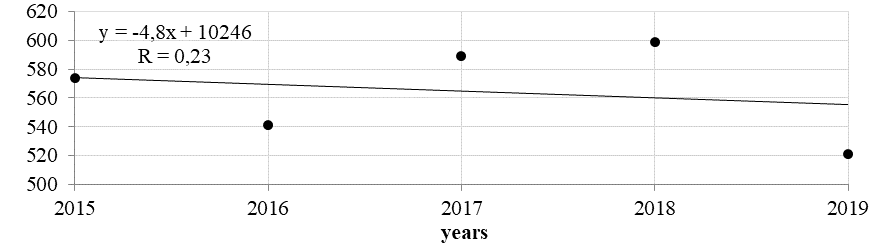
From the graph in Figure
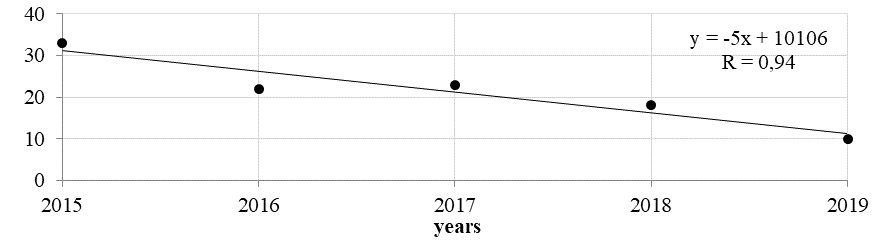
The data obtained indicate that an increase in the number of accidents does not always lead to an increase in mortality. This is due to the fact that the number of cars increased, but the traffic capacity of the roads did not change during this time, which led to a decrease in the speed of automobile flow. In addition, in 2012, in the territory of the city district of Yakutsk, a center for automated fixing of administrative offenses of the rules of the road began to function, and since 2017 there has been an annual increase in the number of complexes of fixing violations in the field of traffic rules. The overall increase in the number of accidents is associated with an increase in the number of small accidents at low speeds due to non-compliance with the distance, etc.
Conclusion
As a result of an analytical study of statistical information about accidents in the urban district of Yakutsk for 16 years (since 2004), we were able to establish that:
The number of accidents is seasonal. The number of accidents increases from March to September. The number of accidents in the warm season is 2.5 times more than in the winter season.
The number of accidents has a tendency to increase, but at the same time over the past three years the number of accidents has decreased by 20%.
The numbers of victims and fatalities in road accidents tend to decrease. The number of deaths in road accidents over the past 5 years has decreased by 3 times.
Based on the foregoing, it should be noted that in the warm season, road patrol services should be maximized.
References
- Babkov, V. F. (1993). Dorozhnyye usloviya i bezopasnost' dvizheniya [Road conditions and traffic safety.] Transport. [in Rus.]
- Boyarshinov, A. L., Ishkov, A. M., & Reshetnikov, A. P. (2014). Osobennosti pokazateley i prichin DTP na Severe. [Features of indicators and causes of road accidents in the North]. Motor transport enterprise, 12, 13-16. [in Rus.]
- Chizhevskij, A. L. (1976) Zemnoye ekho solnechnykh bur. [Terrestrial echo of solar storms. Second edition]. Mysl'. [in Rus.]
- Cornelissen, G., Wendt, H. W., Guillaume, F., Bingham, C., Halberg, F., Breus, T. K., Rapoport, S., & Komarov F. (1994). Disturbances of the interplanetary magnetic field and human pathology. Chronobiologia, 21, 151-154.
- Favour, O. (2016). Statistical Analysis of Pattern on Monthly Reported Road Accidents in Nigeria. Science Journal of Applied Mathematics and Statistics. https://doi.org/10.11648/j.sjams.20160404.11
- Goswami, A., & Sonowal, R. (2011). A statistical analysis of road traffic accidents in Dibrugarh city, Assam, India. Interstat.
- Hossain, M., & Faruque, O. (2019). Road Traffic Accident Scenario, Pattern and Forecasting in Bangladesh. Journal of Data Analysis and Information Processing, 7, 29-45. https://doi.org/10.4236/jdaip.2019.72003
- Ishkov, A. M., Boyarshinov, A. L., & Reshetnikov, A. P. (2018). Vliyaniye magnitnykh bur' na bezopasnost' dorozhnogo dvizheniya na severe. [The impact of magnetic storms on road safety in the North]. Vestnik IrGTU, 22(7), 193-200. [in Rus.]
- Ishkov, A. M., Reshetnikov, A. P., & Boyarshinov, A. L. (2017). Ekspluatatsionnaya nadezhnost' transporta, yeye vliyaniye na dorozhno-transportnyye proisshestviya na Severe. [Operational reliability of the transport, its impact on road trafiic accidents in the North]. Vestnik IrGTU, 21(7), 164-170. [in Rus.]
- Johns, I. S. (1979). Vliyaniye parametrov avtomobilya na DTP. [The effect of vehicle parameters on traffic accidents]. Mashinostroenie. [in Rus.]
- Kuryanova, O. E. (2014). Povysheniye bezopasnosti dorozhnogo dvizheniya metodami izmeneniya sistemy podgotovki voditeley transportnykh sredstv. [Improving road safety by methods of changing the system of training drivers of vehicles]. Motor transport enterprise, 6, 12-16. [in Rus.]
- Official statistics of the Federal state statistics service for the Republic of Sakha (Yakutia) (2020). https://sakha.gks.ru/folder/32348
- Official statistics of the state road safety Inspectorate of the Ministry of internal Affairs of the Russian Federation for the Republic of Sakha (Yakutia) (2020). http://stat.gibdd.ru/
- Osipova, M. E., & Vinokurova, U. A. (2017). Motorizatsiya naseleniya kak sotsial'naya problema v Yakutii. [Motorization of the population as a social problem in Yakutia]. Theories and problems of political research, 6(1A), 252-261. [in Rus.]
- Road accident map project (2020). Retrieved April 17, 2020, from https://dtp-stat.ru/respublika-sakha-iakutiia_iakutsk/
- Samsonov, S. N., Kleimenova, N. G., & Kozyreva, O. V. (2014) The effect of space weather on human heart diseases in subauroral latitudes. Izv. Atmos. Ocean. Phys., 50, 719-727. https://doi.org/10.1134/S0001433814040057
- Strekalovskaya, A., Petrova, P., Komzin, K., Malysheva, L., Samsonov, S., Parshina, S., & Andreeva, A. (2018). Assessment of the Space Weather Effect on Human Health in the Arctic Zone Using the Example of Tiksi Settlement. International Journal of Biomedicine, 8, 56-59. https://doi.org/10.21103/Article8(1)_OA9
- Tefft, B. C. (2017). Rates of Motor Vehicle Crashes, Injuries and Deaths in Relation to Driver Age, United States, 2014-2015. AAA Foundation for Traffic Safety.
- Tyotushkin, V. A. (2016). Marketing analysis of the car market in the context of the economic crisis. Financial analytics: problems and solutions, 32(314), 2-22.
Copyright information

This work is licensed under a Creative Commons Attribution-NonCommercial-NoDerivatives 4.0 International License.
About this article
Publication Date
21 October 2020
Article Doi
eBook ISBN
978-1-80296-089-1
Publisher
European Publisher
Volume
90
Print ISBN (optional)
-
Edition Number
1st Edition
Pages
1-1677
Subjects
Economics, social trends, sustainability, modern society, behavioural sciences, education
Cite this article as:
Bochkaryov, Y. S., Ishkov, A. M., & Boyarshinov, A. L. (2020). Analytical Research Of Statistical Information About Road Traffic Accidents In Yakutsk. In I. V. Kovalev, A. A. Voroshilova, G. Herwig, U. Umbetov, A. S. Budagov, & Y. Y. Bocharova (Eds.), Economic and Social Trends for Sustainability of Modern Society (ICEST 2020), vol 90. European Proceedings of Social and Behavioural Sciences (pp. 1654-1661). European Publisher. https://doi.org/10.15405/epsbs.2020.10.03.190