
Does MATK, TRNH-PSBA, TRNL-F And Its1 Identification Mirror Morphological Identification in Hibisceae?


Abstract
DNA barcoding applied to conservation, and food authentication contributes to attaining the United Nations goals for sustainability. However, congruence between morphological and molecular data in plant species identification needs further study in specific taxons sampled in particular areas. Malaysian samples were used to test congruence between morphologically identified Hibisceae species with their identification based on
Keywords: HibisceaetrnL-Fmaturase KtrnH-psbAITS1species identification
Introduction
Species within the tribe Hibisceae such as Hibiscus sabdariffa L., Hibiscus rosa-sinensis and Malvaviscus arboreus (formerly known as Hibiscus arboreus) are valuable as sources of medicine or food in society (Chen et al., 2010). Correct identification of these species ensures the safety and efficacy of their products.
Morphology based identification, while the gold standard for species identification (Chan et al., 2014), is not straightforward. H. rosa-sinensis has many forms (Bates,1965; Singh & Khoshoo, 1989), perhaps due to the mixed ancestry of H. rosa-sinensis, which involved mating’s of many species including H. kokio, and H. arnottianus (Palmer & Palmer, 1954; Wilcox & Holt, 1913). In the case of M. arboreus, the Malvaviscus penduliflorus is very similar and sometimes regarded as a variety of that species (M. arboreus var. penduliflorus; Schery, 1942). Species delimitation within the Furcaria section to which H. sabdariffa belongs is also difficult due to overlapping morphologies (Sivarajan & Pradeep 1996).
The difficulties and arising errors in morphological identification and taxonomy may be overcome by combining it with molecular identification (Batovska et al., 2016). While molecular based studies (RAPD-PCR, ISSR-PCR or AFLP) have been used in identifying Hibiscus species (Kadve et al., 2012; Khafaga, 2013; Omalsaad et al., 2014; Tang et al., 2003), DNA barcoding has not been widely used. Loci such as atpB, rbcL, and ndhF, have focused on phylogeny at higher taxonomic levels (Pfeil et al., 2002; Pfeil & Crisp, 2005; Tate & Simpson, 2003). Only two studies specifically on Hibisceae and DNA barcoding were found in November of 2019, that is, the studies of Poovitha et al., (2016) and Liu et al. (2014).
DNA barcoding is an easy method (Kress & Erickson, 2008) which uses one or a few short, standardised DNA region(s) and checks this query against a database (Hebert et al., 2003). As such, DNA barcoding is widely used (Kress, 2017), and could help overcome the problems with identification of Hibisceae using morphology.
Among the barcoding loci recommended for species-level identification are the maturase K gene (matK) (Hollingsworth et al., 2011), intergenic spacer trnH-psbA (Kress et al., 2005), internal transcribed spacer, ITS1 (Wang et al., 2015) and intergenic spacer trnL-F (Hao et al., 2009). These loci, however, do not perform well across all plants (Dong et al., 2015). The matK locus exhibits low amplification and sequencing rates due to lack of universality of primers and the presence of mononucleotide repeats (Yu et al., 2011). The trnH-psbA marker often poses a problem in sequencing due to homopolymer tails resulting in stutter peaks (Shinde et al., 2003). The ITS locus is a multicopy marker, where homogenisation may be incomplete (Harpke & Peterson, 2006), leading to poor sequence quality. The trnL-F locus, in turn, poses a problem because it may have mononucleotide repeats, duplicated copies of the trnF gene as in Brassicaceae, or lost the intergenic spacer as in some taxa (Hollingsworth et al., 2011).
Problem Statement
Correct species identification is essential in all fields of biology (Tosh et al., 2016). As expertise for species identification is often unavailable (Coissac et al., 2012), molecular identification has been proposed (Hebert et al., 2003). However, molecular identification too has its problems (Hollingsworth et al., 2011) and optimising these molecular tools has the potential to make species identification more accessible and accurate. The success of species identification using DNA barcoding depends very much on the taxa in question, as much as the utilised marker (Amandita et al., 2019). For example, in Hibiscus, including
Research Questions
The question is, whether there is congruence between DNA based identification using ITS1,
Purpose of the Study
This study aims to:
1) identify three Hibisceae species in Malaysia, using morphology, and
2) test if the loci (ITS1,
Research Methods
Morphological identification, followed by molecular identification, are described below.
Sample Collection and Morphological Identification
Three individuals from each of the three morphologically distinct taxons within the Tribe Hibisceae were obtained and characterised using the morphology of flowers and leaves. Ten replicates were observed or measured for each species.
Molecular Identification
Molecular identification involved obtaining sequences, checking for noise and evaluating these sequences using two sequence analysis methods for better reliability.
DNA Extraction, Amplification, and Sequencing
A modified CTAB protocol (Doyle & Doyle, 1987) was used to extract DNA. The modification involved the addition of 0.04g polyvinylpyrrolidone and 5.0µl -mercaptoethanol per ml of buffer. Polymerase Chain Reactions (PCR) using My Taq™ Mix (Bioline, USA) were performed according to the manufacturer’s protocol using primers and conditions listed in Table
Sequence Analysis
DNA Sequence Assembler v4 software (2013) was used to obtain the quality of sequences, generate consensus sequences, remove low-quality sequence ends and trim out primer sequences. Further analysis, used consensus sequences or if not produced, used single reads, having a Phred score > 30, which indicated moderate to high quality (Ratnasingham & Hebert, 2007).
The assignment to a species used the final (query) sequence to compare against the NCBI database using BLAST (Altschul et al., 1990) for the best match. The lower E-value, higher score, and percentage identity indicated the most probable species (Fassler & Cooper, 2011). Additionally, a phylogenetic tree to determine discrimination between the taxons was drawn using sequences from this study and sequences retrieved from GenBank from the same and closely related species. Sequences were aligned with T-coffee (Di Tommaso et al., 2011). Then the maximum likelihood phylogenetic tree was generated using the best-fitting model of nucleotide substitution for each locus data as indicated by the Akaike Information Criterion (AIC). Mega X software was used to calculate AIC and generate the tree (Kumar et al., 2018). One thousand bootstrap replicates maintained adequate sampling (Pattengale et al., 2009), and bootstrap support was categorised as weak (50 - 70%), moderate (70 - 85%) and strong (>85%), according to Kress et al. (2002). Loci were analysed independently, to accommodate the potentially different histories and rates of change among loci (Maddison, 1997; Kubatko & Degnan, 2007). Monophyly was used to infer species discrimination and true identity.
Detecting Possible Noise
Fragment length and GC content determined using MEGA X (Kumar et al., 2018), when similar to previously reported values indicated the authenticity of DNA loci amplified (Buckler & Holtsford, 1996). Authenticity in the coding locus
Findings
Morphological and molecular characterisation are presented individually, followed by the comparison of species identification by the two methods.
Morphology
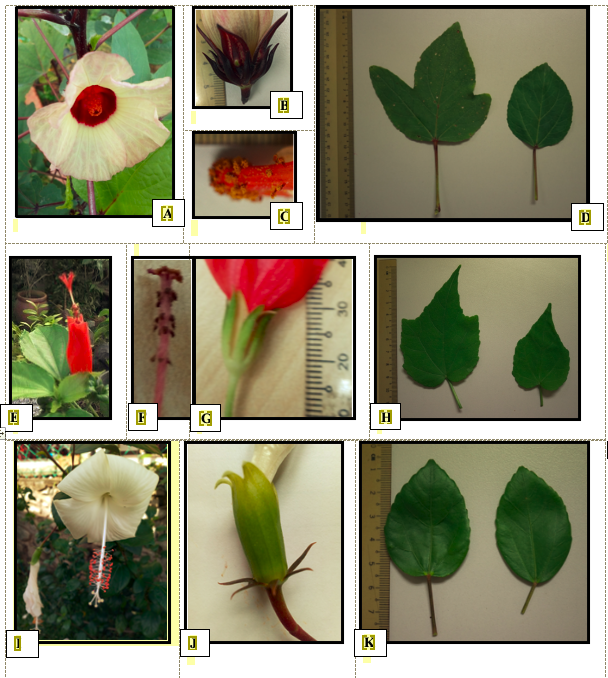
Gross morphology differentiated the three species and identified them as members of the tribe Hibisceae. The three species were identified as Hibiscus rosa-sinensis (HRS-W), Hibiscus sabdariffa (HS) and Malvaviscus arboreus (MA).
H. sabdariffa was identified mainly by the thickened midribs and marginal ribs of the calyx (Figure 01B) as reported by Ross (2003). Additional characters supported this identification such as the bell-shaped corolla of pale pink colour with dark red centre (Figure 01A), the five obovate petals, 0.9 ± 1 cm long staminal column, and bell-shaped calyx (Figure 01B, C), with five triangular lobes of 2.0 ± 0.1 cm length, all of which approximate the values and descriptions reported for H. sabdariffa (Monaco Nature Encyclopaedia, n.d.). The size of the flower (3.4 ± 0.4 cm in width), number of bracts (8–10) and presence of alternate, lobed leaves with toothed margins, 9 ± 1.2 cm long also tally with the characteristics of this species described by Morton (1987). Additional characteristics recorded in this study that is petal length, and width, with means of 2.8 ± 0.4 cm, and 2.1 ± 0.1 cm respectively, as well as peduncle length of mean 0.7 ± 0.3 cm, are smaller than reported in the Monaco Nature Encyclopaedia, (n. d.) but could be due to the different varieties of H. sabdariffa with different characteristics (Torres-Morán, et al., 2011).
M. arboreus was identified to the genus Malvaviscus by it leaf shape (Figure 01H) and floral architecture (Figure 01E) of never opening fully but remaining as a contorted tube, each auriculate petal overlapping the next as reported in Turner and Mendenhall (1993). Naskar and Mandal (2014) recorded ten style branches, with a staminal tube approximately 2 cm long (Figure 01F, G), which tally with the results of this study and differentiate this Malvaviscus species from the other two Hibiscus species used in this study. M. arboreus was distinguished from Malvaviscus pendiliflorus, by the size of its corollas and calyces which have mean lengths of 2.5 ± 0.3 cm and 1.1 ± 0.1cm respectively. These lengths are in the range exhibited by M. arboreus and not M. pendiliflorus (Turner & Mendenhall,1993).
Samples identified as H. rosa-sinensis had characters comparable to that reported for this species by El Sayed, Ateya, and Fekry (2012) as well as other researchers. For example, the leaf was simple, ovate to oblong-lanceolate in shape having an acuminate apex, entire margin in the lower half part and dentate margin in the upper half as in Figure 01K (El Sayed et al., 2012; Salamah, Prihatiningsih, Rostina, & Dwiranti, 2018). El Sayed et al. (2012) also described the epicalyx (Figure 01J) as consisting of green bracts forming a whorl outside the calyx, 6–8 in number, linear-lanceolate shaped, and measuring 0.8–1.2 cm in length, similar to our results. The H. rosa-sinensis bracteoles are also free, unlike in H. sabdariffa (Ayanbamiji, Ogundipe, & Olowokudejo, 2012). The structure of the calyx (Figure 01J) also conformed to that expected in H. rosa-sinensis, that is united near to its half-length, oblong-lanceolate in shape, green in colour and 2.1 ± 0.2 cm in length. Each flower is 5 to7 cm in length and has five free petals as reported by El Sayed et al. (2012). And the number of stigmas is five, as reported by Salamah et al. (2018), as well as Naskar and Mandal (2014) (see Figure
DNA Sequences
The four DNA loci were successfully amplified and sequenced for all the nine samples in the three species studied. Absence of stop codons in the reading frame of the matK sequences, as well as the conformity of length and percentage GC (Table
According to the best match in BLAST, only
BLAST analysis of ITS1 (Table
The BLAST analysis based on the
The BLAST analysis of
The
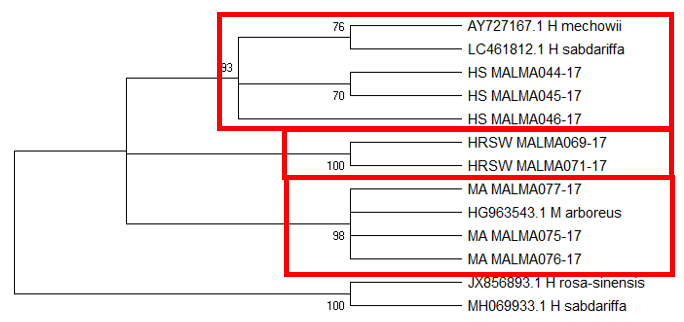
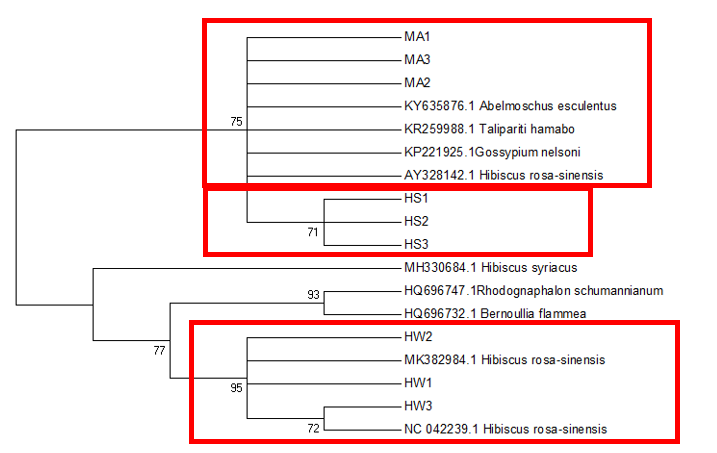
Tree topology of ITS1 (Figure
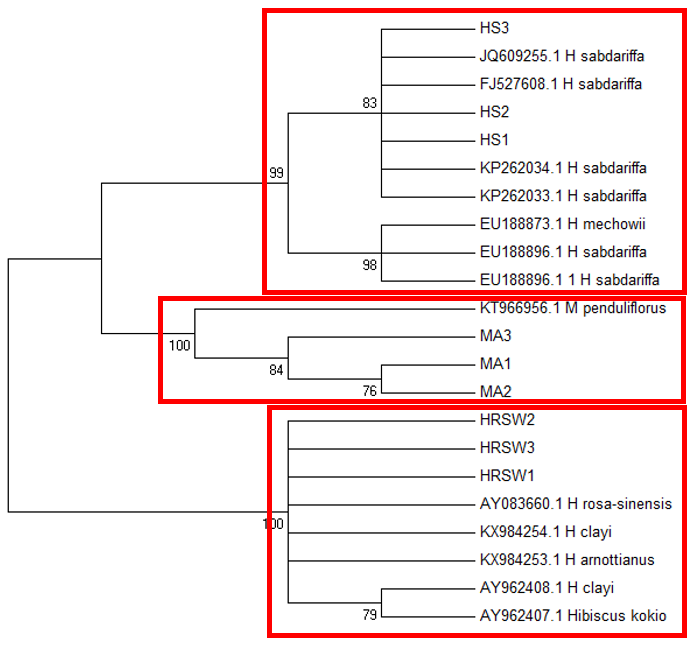
The
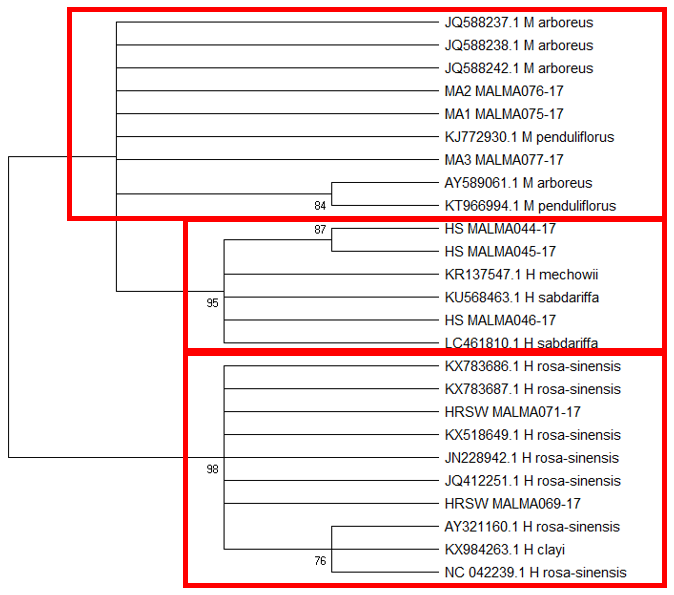
Tree topology unlike BLAST of
Limitations of Barcoding and Revisiting Morphology
The difficulty in identifying M. arboreus lies mainly in the lack of sequences of this species in the database. However, also contributing to the challenge is the lack of agreement on whether they are separate species or sub-species, the name M. arboreus variety penduliflorus is also being used (Turner & Mendenhall, 1993). Besides, occasional hybridisation between M. arboreus and M. penduliflorus is likely (Turner & Mendenhall, 1993), exacerbating the confusion between the two species. The clustering of H. sabdariffa with H. mechowii in three of the loci could be because there is a possibility that H. mechowii is the primitive form of H. sabdariffa (Edmonds, 1991). The ambiguous identification of H. rosa-sinesis, prompted us to make further morphological comparisons. The H. rosa-sinensis leaf morphology (Figure 01K), did not correspond to the leaf morphology of the white-flowered H. arnottianus which was described by Bhat (1995) to be elliptic, with an apex and base which is obtuse and an entire margin. The white petal colour found in our samples is not the reported colour of flowers of H. clayi nor H. kokio (Native Plants of Hawaii, n.d.). Unlike the leaves of the H. rosa-sinensis samples, leaves of H. clayi are smooth, or occasionally toothed near the tip (Native Plants of Haiwaii, n.d.). However, with its hybrid origins, H. rosa-sinensis may be a composite of characters from different ancestors, making it challenging to identify with certainty.
Conclusion
DNA based species identification in this study was not consistent or clear-cut. BLAST analysis of trnH-psbA and morphology-based identification was consistent; however, the tree topology showed ambiguities. ITS1 and matK identified all three species correctly to genus level, though trnL-F could not identify the M. arboreus even to genus level. In H. rosa-sinensis and H. sabdariffa the inconsistencies in identification may be due to their hybrid or evolutionary origins. A different problem exists in identifying the M. arboreus, that is, an incomplete database, combined with different taxonomist having different preferences in the naming of the species. While problems exist, DNA barcoding still has a role in identification. It directed us to review carefully related species and look for morphological characters which could negate or confirm the identification. It highlighted taxons that may be hybrids. And it also directed attention to species whose naming needs to be reviewed by taxonomist. In earth populated by some 391,000 species of vascular plants, this is no small contribution. Additionally, it is useful in cases which do not require species-level resolution, for example, knowing that food or drink contain something other than what is on the label is sufficient warning of danger. The importance of increased sampling within and across all species as well as geographical regions cannot be overstated. Sequence data analysis methods should also be explored to obtain ways which are not impacted by say non-homogeneity of sequences.
Acknowledgments
INTI International University funded this project but had no role in study design, data collection, analysis, or preparation of the manuscript.
References
- Altschul, S. F., Gish, W., Miller, W., Myers, E. W., & Lipman, D. J. (1990). Basic local alignment search tool. Journal of Molecular Biology, 215(3), 403-410.
- Amandita, F. Y., Rembold, K., Vornam, B., Rahayu, S., Siregar, I. Z., Kreft, H., & Finkeldey, R. (2019). DNA barcoding of flowering plants in Sumatra, Indonesia. Ecology and Evolution, 9(4), 1858–1868. https://doi.org/10.1002/ece3.4875
- Ayanbamiji, T. A., Ogundipe, O. T., & Olowokudejo, J. D. (2012). Taxonomic significance of the epicalyx in the genus Hibiscus (Malvaceae). Phytologia Balcanica, 18(2), 135–140.
- Bates, D. M. (1965). Notes on the cultivated Malvaceae. 1. Hibiscus. Baileya, 13, 57–130.
- Batovska, J., Blacket, M. J., Brown, K., & Lynch, S. E. (2016). Molecular identification of mosquitoes (Diptera: Culicidae) in southeastern Australia. Ecological Evolution, 6(9), 3001–3011. https://doi.org/10.1002/ece3.2095
- Bergsten, J., Bilton, D., Fujisawa, T., Elliott, M., Monaghan, M., Balke, M… Vogle, A. P.(2012). The effect of geographical scale of sampling on DNA Barcoding. Systematic Biology, 61(5), 851–869. https://doi.org/10.1093/sysbio/sys037
- Bhat, R. B. (1995). Taxonomic implications of leaf architecture in the genus Hibiscus. South African Journal of Botany, 61(4), 209–214.
- Buckler, E. S. & Holtsford. T. P. (1996). Zea systematics: Ribosomal ITS evidence. Molecular Biology and Evolution, 13(4), 612–622.
- Castro, C., Hernandez, A., Alvarado, L., & Flores, D. (2015). DNA barcodes in fig cultivars (Ficus carica L.) using ITS regions of ribosomal DNA, the psbA-trnH spacer and the matK coding sequence. American Journal of Plant Sciences, 6, 95-102. https://doi.org/10.4236/ajps.2015.61011
- Chan, A., Chiang, L. P., Hapuarachchi, H. C., Tan, C. H., Pang, S. C., Lee, R., & Lam-Phua, S. G. (2014). DNA barcoding: complementing morphological identification of mosquito species in Singapore. Parasites & Vectors, 7, 569. https://doi.org/10.1186/s13071-014-0569-4
- Chen, S., Yao, H., Han, J., Liu, C., Song, J., & Leon, C. (2010). Validation of the ITS2 region as a novel DNA barcode for identifying medicinal plant species. PLoS One, 5(1), e8613. https://doi.org/10.1371/journal.pone.0008613
- Cheng, T., Xu, C., Lei, L., Li, C., Zhang, Y., & Zhou, S. (2016). Barcoding the kingdom Plantae: new PCR primers for ITS regions of plants with improved universality and specificity. Molecular Ecological Resources, 16(1), 138–49. https://doi.org/10.1111/1755-0998.12438
- Clerc‐Blain, J. L., Starr, J. R., Bull, R. D., & Saarela, J. M. (2010). A regional approach to plant DNA barcoding provides high species resolution of sedges (Carex and Kobresia, Cyperaceae) in the Canadian Arctic Archipelago. Molecular Ecology Resources, 10, 69-91. https://doi.org/10.1111/j.1755-0998.2009.02725.x
- Coissac, E., Riaz, T., & Puillandre, N. (2012). Bioinformatic challenges for DNA metabarcoding of plants and animals. Molecular Ecology, 21, 1834–1847.
- DeSalle, R., & Goldstein, P. (2019). Review and interpretation of trends in DNA Barcoding. Frontiers in Ecology and Evolution, 7, 302, 1–11. https://doi.org/10.3389/fevo.2019.00302
- Di Tommaso, P., Moretti, S., Xenarios, I., Orobitg, M., Montanyola, A., Chang, J.-M., & Notredame, C. (2011). T-Coffee: a web server for the multiple sequence alignment of protein and RNA sequences using structural information and homology extension. Nucleic Acids Research, 39 (Web Server issue), W13 – W17. http://doi.org/10.1093/nar/gkr245
- DNA Sequence Assembler v4. (2013). Heracle BioSoft, www.DnaBaser.com
- Dong, W., Xu, C., Li, C., Sun, J., Zuo, Y., Shi, S., Cheng, T., Guo, J., & Zhou, S. (2015). ycf1, the most promising plastid DNA barcode of land plants. Scientific Reports, 5, 8348.
- Doyle, J. J., & Doyle, J. L. (1987). A rapid DNA isolation procedure for small quantities of fresh leaf tissue. Phytochemical Bulletin, 19, 11–15.
- Edmonds, J. M. (1991). The distribution of Hibiscus L. section Furcaria in tropical East Africa. Systematic and Ecogeographic Studies on Crop Genepools, 6. International Board for Plant Genetic Resources, Rome. https://www.bioversityinternational.org/fileadmin/bioversity/publications/Web_version/ 270/begin.htm
- El Sayed, Z. I., Ateya, A-M., & Fekry, M. (2012). Macro- and micromorphological study of the leaf, stem, flower and root of Hibiscus rosa-sinensis L. Journal of Applied Sciences Research, 8(1), 34-56.
- El-Bakatoushi, R. (2015). Intra-specific genetic differentiation shaping three Portulaca oleracea l. micro-species. Pakistan Journal of Botany, 47(6), 2309–2320. https://www.pakbs.org/pjbot/PDFs/47(6)/33.pdf
- Fassler, J., & Cooper, P. (2011). BLAST Glossary. In: BLAST® Help [Internet]. Bethesda (MD): National Center for Biotechnology Information (US); 2008-https://www.ncbi.nlm.nih.gov/books/NBK62051/
- Hao, D. C., Huang, B. L., Chen, S. L., & Mu, J. (2009). Evolution of the chloroplast trnL-trnF region in the gymnosperm lineages Taxaceae and Cephalotaxaceae. Biochemical Genetics, 47, 351–369. https://doi.org/10.1007/s10528-009-9233-7
- Harpke, D., & Peterson, A. (2006). Non-concerted ITS evolution in Mammillaria (Cactaceae). Molecular Phylogenetics and Evolution, 41, 579–593. https://doi.org/10.1016/j.ympev.2006.05.036
- Hebert, P. D. N., Cywinska, A., Ball, S. L., & deWaard, J. R. (2003). Biological identifications through DNA barcodes. Proceedings of the Royal Society B, 270(1512), 313–321.
- Hillis, D. M. (1991). Discriminating between phylogenetic signal and random noise in DNA sequences. In M. M. Miyamoto, & J. Cracraft (Eds.), Phylogenetic Analysis of DNA Sequences (pp. 278–294). Oxford University Press.
- Hollingsworth, P. M., Graham, S. W., & Little, D. P. (2011). Choosing and using a plant DNA barcode. PLoS ONE 6(5), e19254. https://doi.org/10.1371/journal.pone.0019254
- Jukes, T. H., & Cantor, C. R. (1969). Evolution of protein molecules. In Mammalian Protein Metabolism, ed. H. W. Munro, pp. 21–120. Academic Press.
- Kadve, S., Yadav, M., & Tiwari, A. (2012). Genetic variation on hibiscus species by using RAPD markers Advanced research in Pharmaceuticals and Biologicals International, 2(1), 9–21.
- Khafaga, A. F. A. (2013). Molecular genetic identification of some Egyptian Hibiscus samples. Journal of American Science, 9(10s), 28–35.
- Kress, J. W. (2017). Plant DNA barcodes: Applications today and in the future. Journal of Systematics and Evolution, 55(4), 291–307. https://doi.org/10.1111/jse.1225
- Kress, W. J., & Erickson, D. L. (2008). DNA barcodes: Genes, genomics, and bioinformatics. Proceedings of the National Academy of Sciences of the United States of America PNAS, 105(8), 2761–2762. https://doi.org/10.1073/pnas.0800476105
- Kress, W. J., Prince, L. M., & Williams, K. J. (2002). The phylogeny and a new classification of the gingers (Zingiberaceae): Evidence from molecular data. American Journal of Botany, 89, 1682–1696.
- Kress, W. J., Wurdack, K. J., Zimmer, E. A., Weigt, L. A., & Janzen, D. H. (2005). Use of DNA barcodes to identify flowering plants. Proceedings of the National Academy of Science USA, 102(23), 8369–8374. https://doi.org/10.1073/pnas.0503123102
- Kreuzer, M., Howard, C., Adhikari, B., Pendry, C. A., & Hawkins, J. A. (2019). Phylogenomic approaches to DNA barcoding of herbal medicines: Developing clade-specific diagnostic characters for Berberis. Frontiers of Plant Science, 10, 586. https://doi.org/10.3389/fpls.2019.00586
- Kubatko, L. S., & Degnan, J. H. (2007). Inconsistency of phylogenetic estimates from concatenated data under coalescence. Systematic Biology, 56, 17–24.
- Kumar, S., & Gadagkar, S. R. (2001). Disparity index: A simple statistic to measure and test the homogeneity of substitution patterns between molecular sequences. Genetics, 158, 1321–1327.
- Kumar, S., Stecher, G., Li, M., Knyaz, C., & Tamura, K. (2018). MEGA X: Molecular Evolutionary Genetics Analysis across computing platforms. Molecular Biology and Evolution, 35, 1547–1549.
- Kuzmina, M. L., Johnson, K. L., Barron, H. R., & Herbert, P. D. N. (2012). Identification of the vascular plants of Churchill, Manitoba, using a DNA barcode library. BMC Ecology, 12, 25. https://doi.org/10.1186/1472-6785-12-25
- Liu, Y. M., Jin, L. N., Xiong, Y. X., Wu, L., & Chen, K. L. (2014). Molecular identification of Hibiscus syriacus and its adulterants using ITS2 barcode. Zhong Yao Cai, 37(3), 408–410.
- Maddison, W. P. (1997). Gene trees in species trees. Systematic Biology, 46, 523–536.
- Monaco Nature Encyclopaedia (n.d.). Retrieved 20 November, 2019, from https://www.monaconatureencyclopedia.com/hibiscus-sabdariffa/?lang=en
- Morton, J. F. (1987). Roselle. In: Fruits of warm climates (pp. 281–286). Miami, Florida Flair Books.
- Naskar, S., & Mandal, R. (2014). Characterization of some common members of the family Malvaceae s.s on the basis of morphology of selective attributes; epicalyx, staminal tube, stigmatic head and trichome. Indian Journal of Plant Science, 4(3), 79–86.
- Native Plants Hawaii (n.d.). Retrieved from: http://nativeplants.hawaii.edu/plant/view/Hibiscus_clayi
- Omalsaad, A. K. M., Islam, A., Jahan, M. A., Yaakob, Z., & Osman, M. (2014). Genetic relationship between roselle (Hibiscus sabdariffa L.) and kenaf (Hibiscus cannabinus L.) accessions through optimization of PCR based RAPD method. Emirates Journal of Food Agriculture, 26(3), 247–258 https://doi.org/10.9755/ejfa.v26i3.16498
- Palmer, K., & Palmer, M. (1954). Hibiscus unlimited and how to know them. Creative Press Inc.
- Pang, X., Liu, C., Shi, L., Liu, R., Liang, D., Li, H., ... & Chen, S. (2012). Utility of the trnH–psbA intergenic spacer region and its combinations as plant DNA barcodes: A meta-analysis. PLoS One, 7(11), e48833.
- Papadopoulou, A., Chesters, D., Coronado, I., De la Cadena, G., Cardoso, A., Reyes, J. C., Maes, J. M., Rueda, R. M., & Gómez-Zurita, J. (2015). Automated DNA-based plant identification for large-scale biodiversity assessment. Molecular Ecology Resources, 15(1), 136–152. https://doi.org/10.1111/1755-0998.12256
- Pattengale, N. D., Alipour, M., Bininda-Emonds, O. R. P., Moret, B. M. E., & Stamatakis, A. (2009). How many bootstrap replicates are necessary? In: Batzoglou S. (eds) Research in Computational Molecular Biology. RECOMB 2009. Lecture Notes in Computer Science (vol 5541). Berlin: Heidelberg, Springer.
- Pfeil, B., & Crisp, M. (2005). What to do with Hibiscus? A proposed nomenclatural resolution for a large and well known genus of Malvaceae and comments on paraphyly. Australian Systematic Botany, 18, 49–60.
- Pfeil, B., Brubaker, C., Craven, L., & Crisp, M. (2002). Phylogeny of Hibiscus and the Tribe Hibisceae (Malvaceae) using chloroplast DNA sequences of ndhF and the rpl16 intron. Systematic Botany, 27, 333–350.
- Poovitha, S., Stalin, N., Balaji, R., & Parani, M. (2016). Multi-locus DNA barcoding identifies matK as suitable marker for species identification in Hibiscus L. Genome, 59(12), 1150–1156. https://doi.org/10.1139/gen-2015 – 2025
- Ratnasingham, S., & Hebert, P. D. N. (2007). BOLD: The Barcode of Life Data System (http://www.barcodinglife.org). Molecular Ecology Notes, 7(3), 355–364. https://doi.org/10.1111/j.1471-8286.2007.01678.x
- Ross, I. A. (2003). Hibiscus rosa-sinensis. In: Medicinal Plants of the World, Volume 1: New York, NY: Humana Press, Springer Science+Business Media, 253–254.
- Salamah, A., Prihatiningsih, R., Rostina, I., & Dwiranti, A. (2018). Comparative morphology of single and double flowers in Hibiscus rosa-sinensis L. (Malvaceae): A homeosis study AIP Conference Proceedings 2023, 020136. https://doi.org/10.1063/1.5064133
- Sang, T., Crawford, D. J., & Stuessy, T. F. (1997). Chloroplast DNA phylogeny, reticulate evolution and biogeography of Paeonia (Paeoniaceae). American Journal of Botany, 84, 1120–1136.
- Schery, R. W. (1942). Monograph of Malvaviscus. Annals of the Missouri Botanical Garden, 29(3), 183–244.
- Shinde, D., Lai, Y., Sun, F., & Arnheim, N. (2003). Taq DNA polymerase slippage mutation rates measured by PCR and quasi-likelihood analysis: (CA/GT)n and (A/T)n microsatellites. Nucleic Acids Research, 31(3), 974–980.
- Singh, F., & Khoshoo, T. N. (1989). Cytogenetic basis of evolution in garden Hibiscus. Nucleus, 32, 62–67.
- Sivarajan, V. V., & Pradeep, A. K. (1996). Malvaceae of Southern Peninsular India: A taxonomic Monograph. Delhi: Daya Publishing House.
- Spies, J. J., & Spies, P. (2018). Assessing Clivia taxonomy using the core DNA barcode regions, matK and rbcLa. Bothalia, 48(1), a2025. https://doi.org/10.4102/abc.v48i1.2025
- Sukrong, S., Phadungcharoen, T., & Tungphatthong, C. (2019). Direct submission. GenBank: LC461812.1 https://www.ncbi.nlm.nih.gov/search/all/?term=GenBank:%20LC461812.1
- Taberlet, P., Gielly, L., Pautou, G., & Bouvet, J. (1991). Universal primers for amplification of three non-coding regions of chloroplast DNA. Plant Molecular Biology, 17(5), 1105–1109.
- Tamura, K. (1992). Estimation of the number of nucleotide substitutions when there are strong transition-transversion and G + C-content biases. Molecular Biology and Evolution, 9, 678–687.
- Tamura, K., Stecher, G., Peterson, D., & Filipski, A. (2013). Molecular Biology and Evolution, 30(12), 2725–2729. https://doi.org/10.1093/molbev/mst197
- Tang, T., Zhong, Y., Jian, S., & Shi, S. (2003). Genetic diversity of Hibiscus tiliaceus (Malvaceae) in China assessed using AFLP markers. Annals of Botany (London), 92, 409–414. https://doi.org/10.1093/aob/mcg156
- Tate, J. A., & Simpson, B. B. (2003). Paraphyly of Tarasa (Malvaceae) and diverse origins of the polyploid species. Systematic Botany, 28(4), 723–737.
- Torres-Morán, M. I., Escoto-Delgadillo, M., Ron-Parra, J., Parra-Tovar, G., Mena-Munguía, S., Rodríguez-García, A., Rodríguez-Sahagún, A., & Castellanos-Hernández, O. (2011). Relationships among twelve genotypes of roselle (Hibiscus sabdariffa L.) cultivated in western Mexico. Industrial Crops and Products, 34(1), 1079–1083.
- Tosh, J., James, K., Rumsey, F., Crookshank, A., Dyer, R., & Hopkins, D. (2016). Is DNA barcoding child’s play? Science education and the utility of DNA barcoding for the discrimination of UK tree species Botanical Journal of the Linnean Society, 181, 711-722.
- Turner, B. L., & Mendenhall, M. G., (1993). A revision of Malvaviscus (Malvaceae). Annals of the Missouri Botanical Garden, 1, 439-457.
- Udensi, O. U., Ita, E. E., Ikpeme, E. V., Ubi, G., & Emeagi, L. I. (2017). Sequence analysis of maturase K (matK): A chloroplast-encoding gene in some selected pulses. Global Journal of Pure and Applied Sciences, 23, 213–230. https://doi.org/10.4314/gjpas.v23i2.2
- Wang, X., Liu, C., Huang, L., Bengtsson‐Palme, J., Chen, H., Zhang, J., Cai, D., & Li, J. (2015). ITS1: A DNA barcode better than ITS2 in eukaryotes? Molecular Ecology Resources, 15, 573–586. https://doi.org/10.1111/1755-0998.12325
- Wilcox, E. V. & Holt, V. S., (1913). Ornamental Hibiscus in Hawaii. Hawaii Agricultural Experimental Station Buletin, 29, 60. Paradise of the Pacific Press.
- Xia, X., & Xie, Z. (2001). DAMBE: Software package for data analysis in molecular biology and evolution, Journal of Heredity, 92(4), 371–373. https://doi.org/10.1093/jhered/92.4.371
- Xia, X. (2016). PhyPA: Phylogenetic method with pairwise sequence alignment outperforms likelihood methods in phylogenetics involving highly diverged sequences. Molecular Phylogenetics and Evolution, 102, 331–343. https://doi.org/10.1016/j.ympev.2016.07.001
- Yan, H-F., Hao, G., Hu, C-M., & Ge, X-J. (2011). DNA barcoding in closely related species: A case study of Primula L. sect. Proliferae Pax (Primulaceae) in China. Journal of Systematics and Evolution, 49(3), 225–236. https://doi.org/10.1111/j.1759–6831.2011.00115.x
- Yang, J., Zhang, X., Zhang, W., Sun, J., Xie, Y., Zhang, Y., … Yu, H. (2017). Indigenous species barcode database improves the identification of zooplankton. PLoS ONE, 12(10), e0185697. https://doi.org/10.1371/journal.pone.0185697
- Yu, J., Xue, J-H., & Zhou, S. L. (2011). New universal matK primers for DNA barcoding angiosperms Journal of Systematics and Evolution, 49(3), 176–181. https://doi.org/10.1111/j.1759-6831.2011.00134.x
- Zhang, J-Q., Meng, S-Y., Wen, J., & Rao, G-Y. (2015). DNA Barcoding of Rhodiola (Crassulaceae): A case study on a group of recently diversified medicinal plants from the Qinghai-Tibetan Plateau. PLoS ONE, 10(3), e0119921. https://doi.org/10.1371/journal. pone.011992
Copyright information

This work is licensed under a Creative Commons Attribution-NonCommercial-NoDerivatives 4.0 International License.
About this article
Publication Date
12 October 2020
Article Doi
eBook ISBN
978-1-80296-088-4
Publisher
European Publisher
Volume
89
Print ISBN (optional)
-
Edition Number
1st Edition
Pages
1-796
Subjects
Business, innovation, sustainability, environment, green business, environmental issues, urban planning, municipal planning, disasters, social impact of disasters
Cite this article as:
Rock, K., Xian, Y. L., & Selvarajah, G. (2020). Does MATK, TRNH-PSBA, TRNL-F And Its1 Identification Mirror Morphological Identification in Hibisceae?. In N. Samat, J. Sulong, M. Pourya Asl, P. Keikhosrokiani, Y. Azam, & S. T. K. Leng (Eds.), Innovation and Transformation in Humanities for a Sustainable Tomorrow, vol 89. European Proceedings of Social and Behavioural Sciences (pp. 374-390). European Publisher. https://doi.org/10.15405/epsbs.2020.10.02.34