
Marine Macro-and Microplastic Litter Along The Coastal Area of Kuala Perlis


Abstract
Marine litter along the coastal area has long been a threat to the ecosystem and one of the crucial issues repeatedly in debates. Since the study of marine litter is at its infant stage in Malaysia, this research took the initiative to focus on coastal pollution with the objective to ascertain the amount of different categories of macro marine litter, to determine the amount of microplastic in the sediment layer, and to determine the possible correlation between macroplastic abundance and microplastic amount in the sediment layer. The study area is the coastal region of Kuala Perlis, Malaysia. Macro marine litter is collected at four sampling sites along the shoreline stretching 100 m in length and divided by four sections in width. A quadrat of 50 cm x 50 cm is used to collect sediment from surface to 5 cm depth for microplastic analysing. The total weight of macroplastics collected is 27.79 kg with highest amount being plastic weighing 20.1 kg, fabric (6.96 kg), glass (0.53 kg) and rubber (0.2 kg), while wood and metal were unfound. The amount of macroplastic, being the most collected, proved the reason it becomes a major threat. This study found the amount of microplastics ranged between 0.000096 to 0.000160 kg/m3, while macroplastics ranged between 0.00167 to 0.00402 kg/m2. Result shows a significant relationship (R2 of 0.9328) between macro and microplastic at 95% significance level. The linear regression equation computed is y = 26.388x + 0.051, with y representing microplastic (kg/m2) while x represents macroplastic (kg/m2).
Keywords: Marine litterplasticmicroplasticmicroplasticcoastal pollution
Introduction
Malaysia is an oceanic nation with attractive shorelines that fascinated both local visitors and foreign tourists. The surrounding coastal waters also represent highly productive ecosystems such as mangrove, coral reefs, sea grasses and marine ecosystem. The complexity and rich coastal areas triggered an integrated approach required to handle the challenging environmental issues of achieving a well conserved and sustainable region. As a result, from development and rapid urbanization, these coastal resources are under pressure based on the account of anthropogenic activities within the areas.
Rapid urbanization also leads to more people using plastic every day and changes in land use cover will affect the coastal water quality and plastic pollution along the coast (Robertson, 2018). This research is mooted based on the global phenomenon of the coast, particularly the marine litter issue. Research on marine litter issues is not widely conducted in Malaysia although it appears to be a major problem in the country. Some of related studies are found to be inadequate to illustrate the level of marine pollution within the Malaysian coast. The most intensive paper about marine litter for Malaysia is probably the International Beach Cleaning Report by the International Coastal Cleanup published in 2010.
It is very challenging to describe the level of marine litter in the coastal area as the area is very large. In addition, the marine litter has many categories and sorting these categories is laborious and even perplexing. The floating plastic that is presently the general abundant marine item also indirectly threatens marine biodiversity and food chains. On the other hand, the effects of fragility are mainly underestimated as most of the victims are not found in large areas of the sea when sunk or eaten by predators (Thevenon et al., 2014). Some of the macroplastic also undergo degradation process in the marine environment by the exposure to sun radiation, hydrolysis and microorganisms into smaller and smaller pieces of plastic and fragments, which then can be harmful and deleterious to the environment and organisms.
Literature Review
Plastic litter pollution has advanced in terms of its research since its realization to such a level until now and is displayed almost in every surrounding environment and every location of the globe (Bergmann et al., 2015). It is a global environmental threat that is in rising concern (Rochman et al., 2016) and causing a risk to seabirds (Wilcox et al., 2015), fish, turtles (Mrosovsky et al., 2009) and marine creatures. Direct pollution of plastics at the coastlines which originate from both land- and sea-based activities has primarily disrupted the coastal environment. The major threats of plastic litters are causing the death of excessive number of marine creatures, serious harms to the ecosystem functions, possible human health and disrupting activities such as eco-tourism, fishing, swimming or leisure activities at the beaches. The most essential part of plastic pollution is plastic cannot degrade naturally but breaks into tinier sizes (hence, microplastics) over time which then resulted in multiplications of their abundance and finally interfered with the food chains in coastal ecosystems, bioaccumulated in organisms consuming these microplastics and lead to health issues in human. In addition, plastic litter pollution also impedes and degrades the aesthetic value and sustainability of an area.
Tackling marine plastic litter is a very challenging issue because there are many different categories of plastics used commercially and disposed of into the coastal environment without proper disposal procedures globally. This is principally because how manufactured plastics degrade was poorly understood or had never thought of when it was manufactured in the first place. Now that we realized these plastics do not biodegrade naturally but resulted in smaller and tinier pieces over time, the real task of solving this ‘minute’ problems is now critical to the extent that it threatens us through food chains. The range of these minutes called microplastics can be as small as nano- or pico-scales. The severity of microplastic pollution is seen from significant findings of microplastic occurring in the ocean (Barnes et al., 2009) and as far as even in the Antarctic waters (Zarfl & Matthies, 2010). Microplastic originates from two sources - primary source being from virgin resin pellets or plastic beads, and secondary source being fragmentations from larger plastic debris under the exposure of continuous radiation.
Problem Statement
According to Lindeque (2017), the effect of larger plastic debris on aquatic life is well documented. However, microplastic litter has become more noticeable in recent years that may pose equal threat to marine life and human health is not well document either due to lack of research (Jahnke et al., 2017) or lack of awareness to the potential problem itself. Based on a recent study, global production of plastic has escalated from 5 million tons in 1950 to 322 million tons in 2015 (Plastic - The Fact 2015, 2015). Another perspective leading to the possible lack of awareness in microplastic pollution is perhaps the visibility of plastic pollution compared to its production. This is mainly because plastics break down in to smaller pieces over time through exposure to sun radiation, hydrolysis and microbial activity (Gewert et al., 2015). In addition, plastics have high durability and can either be floating on sea surface if light enough or prone to sink and became more appealing to ingest by benthic organism. Therefore, it is crucial to study the relationship between both macroplastic and microplastic litter. At the moment this relationship has not been established within the local context and will be imperative to further studies relating pollution to sustainable environment, natural coastal resources, food security, biodiversity and human health. Establishing the relationship between macro- and microplastic is also necessary in managing plastic pollution problem either locally, regionally or globally.
Research Questions
Primary research question for this study is whether there is a positive correlation between macroplastic abundance and the microplastic amount found in the sediment layer of the study area. The hypothesis is there is a positive correlation between macroplastic abundance and the amount of microplastic within the sediment layer. This means it is anticipated that the higher the abundance of macroplastic collected, the higher the amount of microplastic is in the sediment layer.
The second research question is what is the proportion of macroplastic found amongst the macro marine litter collected in the study area. The hypothesis is macroplastic will constitute the largest proportion of all macro marine litter types identified.
Purpose of the Study
The main objectives of this study are:
to ascertain the amount of different categories of macro marine litter;
to determine the amount of microplastic present in the sediment layer, and
to determine the possible correlation between macroplastic abundance and microplastic amount in the sediment layer.
Research Methods
Study Area
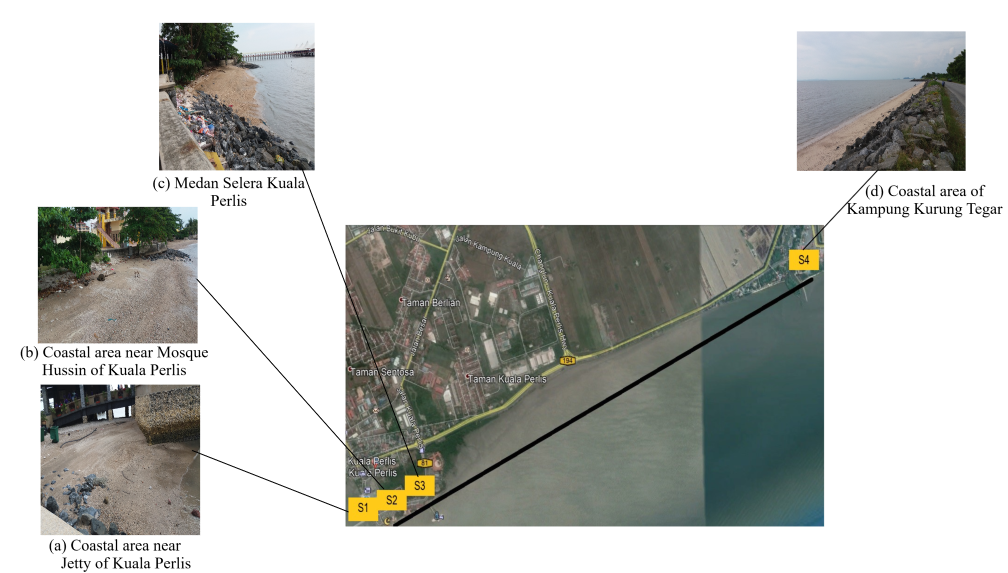
The sampling area identified for the purpose of this study is along Kuala Perlis coastal region, located on the northwest coast of Peninsular Malaysia bordering with south Thailand. The sampling area’s major socio-economic activity is represented mainly by fishery both using traditional and modern vessels. Naturally it becomes a seafood hub for the locals. The famous Kuala Perlis fishing jetty is also one of the major routes for northern Malaysia’s tourism industry where local visitors and foreigners enroute to Pulau Langkawi which is a major tourism spot. Four sampling sites identified which is labelled as S1, S2, S3 and S4 are located near the busy Kuala Perlis Jetty and Kampung Kurung Tengar (Figure
Characterization of Marine Macro Litter
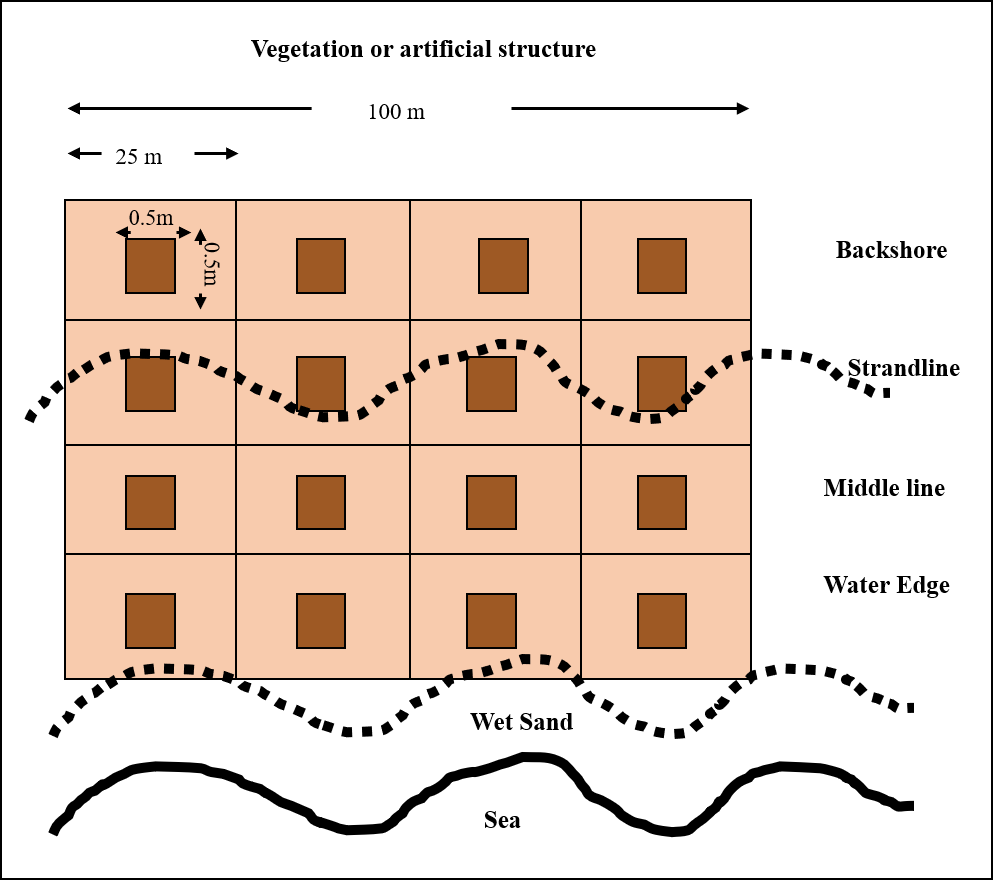
Marine litter data are measured based on the amount of macro litter that are larger than 5 mm along the shoreline and coastal areas using transect in wrack line areas to the vegetation line which stretches 100 m in length. The transect is then divided into four sections which are backshore, strandline, middle line and water edge for all four sampling sites. The marine litter samples collected will then be classified into six categories which are plastic, rubber, metal, glass, wood and fabric. The mass of each category is weighted and measured.
Microplastic in Sediment
The same transect line for macro litter collection is used for microplastic (plastic that are less than 5 mm) in sediment sample collections. Quadrats of 0.5m x 0.5m are used to collect microplastic sediment samples. Surface sediment is collected to a depth of 0.05m within the quadrats. Sediment samples are then dry sieved through a 5mm sieve to collect macroplastics of ≥ 5mm size and at the same time separating microplastic < 5mm sizes. Density separation between floating and settled solids are carried out for further analyses to obtain microplastic. Collected microplastics are then weighted and computed based on per unit area (kg/m2). Sampling design used for each station is shown in Figure
Relationship between Macroplastic and Microplastic
Statistical analysis is carried out to determine the possibility of significant correlation between macroplastic abundance and microplastic amount in the sediment layer using Linear Regression in the SPSS software.
Findings
Marine Litter Categories
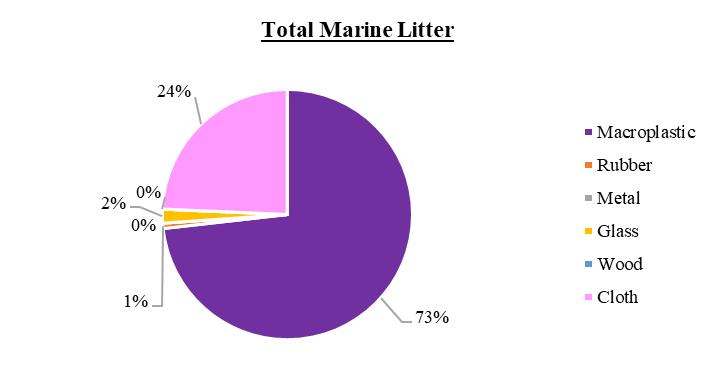
The marine litter collected is categorized into six types of material which are, plastics, fabric, rubber, wood, glass and metal. Total weight of macro marine litter collected in this study is 27.78 kg. Figure
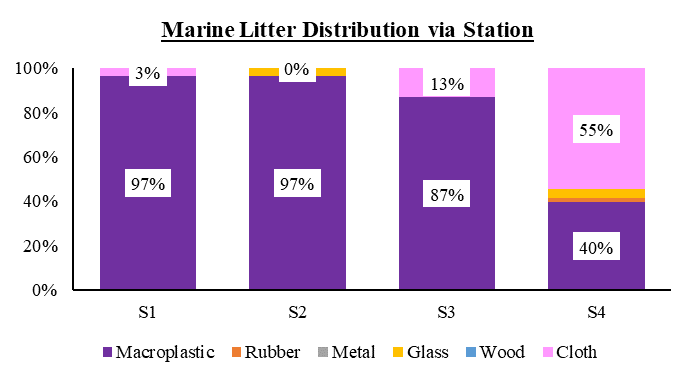
Results of marine litter collected for each sampling station is given in Table
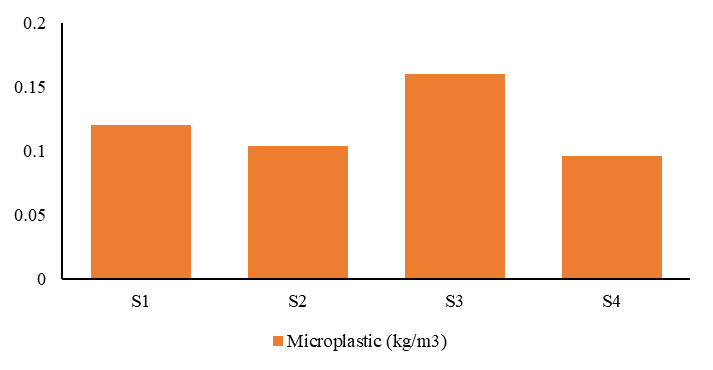
Microplastic in Sediment
S1 and S2 are representing the recreational and tourist areas that are located at jetty and mosque of Kuala Perlis, S3 is a local restaurant area at Medan Selera Kuala Perlis and S4 at Kurung Tengar representing residential area. With the type of landuse observed within the study area, it is obvious that areas with restaurants, residential and recreational area have high exposure to human activities. This leads to exposure of anthropogenic pressure via recreational activities such as fishing and picnicking. Additionally, these sampling sites (S1, S2 and S3) are within close proximity to the busy Kuala Perlis Jetty – focus spot for local fish landings and ferry terminals transporting local visitors and foreign tourists from mainland Peninsular Malaysia to Pulau Langkawi in the northern region. The abundance of microplastic collected are shown in Figure
Relationship between Macroplastic and Microplastic
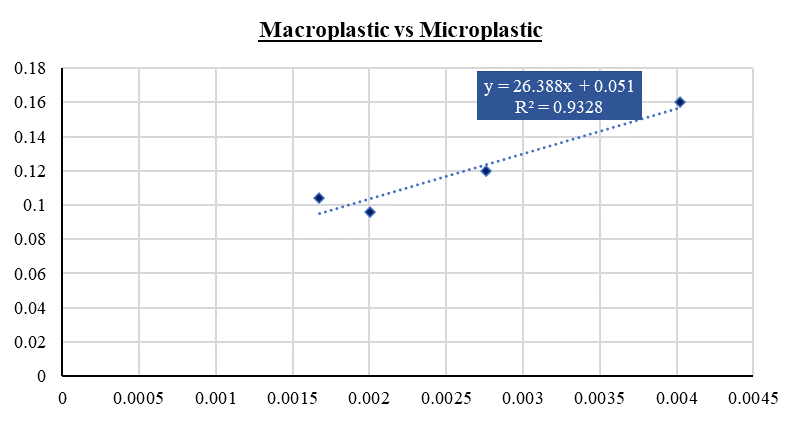
Based on statistical analysis, results showed a strong correlation between the amount of macroplastic litter on the beach and the abundance of microplastic in the sediment in this study. Computed value of R2 is 0.9328 and this means high amount of macroplastic litter on the beach will lead to the high amount of microplastic in the sediment layer. This significant relationship is shown in Figure
y = 26.388x + 0.051
where, y = microplastic (kg/m3)
x = macroplastic (kg/m2)
Summary of regression analysis between these components for all 4 sampling stations of S1, S2, S3 and S4 is given in Table
Conclusion
Results in this study showed that out of the six categories of marine macro litter, four types are observed which are macroplastics, fabric/cloth, rubber and glass, while metal and wood debris are not found. Highest amount of macroplastic per unit area (0.00402 kg/m2) is found to be at S3, where restaurants are located. S2 has the lowest amount of macroplastic which is 0.00167 kg/m2. The amount of microplastic present in the sediment layer fall within the range of 0.000096 to 0.000160 kg/m3 with the highest being from S3 too. There is a significant relationship at 95% significance level between macroplastic abundance on the surface and microplastic amount in the sediment layer. The linear regression equation computed is y = 26.388x + 0.051, with y representing microplastic (kg/m2) while x represents macroplastic (kg/m2). The R2 calculated is 0.9328 meaning strong correlation between macroplastic on the surface with microplastic in the sediment.
References
- Barnes, D. K. A., Galgani, F., Thompson, R. C., & Barlaz, M. (2009). Accumulation and fragmentation of plastic debris in global environments. Philosophical Transactions of the Royal Society B: Biological Sciences, 364(1526), 1985–1998. https://doi.org/10.1098/rstb.2008.0205
- Bergmann, M., Gutow, L., & Klages, M. (2015). Marine anthropogenic litter. Marine Anthropogenic Litter, (June), 1-447.
- Cole, M., Lindeque, P., Halsband, C., & Galloway, T. S. (2011). Microplastics as contaminants in the marine environment: A review. Marine Pollution Bulletin, 62(12), 2588–2597. https://doi.org/10.1016/j.marpolbul.2011.09.025
- Gewert, B., Plassmann, M. M., & Macleod, M. (2015). Pathways for degradation of plastic polymers floating in the marine environment. Environmental Sciences: Processes and Impacts, 17(9), 1513-1521. https://doi.org/10.1039/C5EM00207A
- Gregory, M. L., & Andrady, A. L. (2003). Plastic in The Marine Environment. John Wiley and Sons.
- Jahnke, A., Arp, H. P. H., Escher, B. I., Gewert, B., Gorokhova, E., Kühnel, D., Ogonowski, M., Potthoff, A., Rummel, C., Schmitt-Jansen, M., Toorman, E., & MacLeod, M. (2017). Reducing Uncertainty and Confronting Ignorance about the Possible Impacts of Weathering Plastic in the Marine Environment. Environmental Science and Technology Letters, 4(3), 85–90. https://doi.org/10.1021/acs.estlett.7b00008
- Lindeque, P. (2017). The Problem of Microplastics in Our Marine Environment. Science in Parliament, 73(2), 3-5.
- Mrosovsky, N., Ryan, G. D., & James, M. C. (2009). Leatherback turtles: The menace of plastic. Marine Pollution Bulletin, 58(2), 287–289. https://doi.org/10.1016/j.marpolbul.2008.10.018
- Plastics - The Facts 2015. (2015). An Analysis of European Plastics Production, Demand and Waste Data. https://www.plasticseurope.org/application/files/3715/1689/8308/2015plastics_the_facts_ 14122015.pdf
- Robertson, R. (2018). Are Microplastics in Food a Threat to Your Health?. Retrieved on November 15, 2018 from https://www.healthline.com/nutrition/microplastics.
- Rochman, C. M., Browne, M. A., Underwood, A. J., Van Franeker, J. A., Thompson, R. C., & Amaral-Zettler, L. A. (2016). The ecological impacts of marine debris: Unraveling the demonstrated evidence from what is perceived. Ecology, 97(2), 302–312. https://doi.org/10.1890/14-2070.1
- Thevenon, F., Caroll, C., & Sousa, J. (2014). Plastic Debris in the Ocean. The Characterization of Marine Plastics and their Environmental Impacts. Situation Analysis Report. Gland, Switzerland: IUCN. https://doi.org/10.2305/IUCN.CH.2014.03.en
- Wilcox, C., Van Sebille, E., Hardesty, B. D., & Estes, J. A. (2015). Threat of plastic pollution to seabirds is global, pervasive, and increasing. Proceedings of the National Academy of Sciences of the United States of America, 112(38), 11899-11904. https://doi.org/10.1073/pnas.1502108112
- Zarfl, C., & Matthies, M. (2010). Are marine plastic particles transport vectors for organic pollutants to the Arctic? Marine Pollution Bulletin, 60(10), 1810–1814. https://doi.org/10.1016/j.marpolbul.2010.05.026
Copyright information

This work is licensed under a Creative Commons Attribution-NonCommercial-NoDerivatives 4.0 International License.
About this article
Publication Date
12 October 2020
Article Doi
eBook ISBN
978-1-80296-088-4
Publisher
European Publisher
Volume
89
Print ISBN (optional)
-
Edition Number
1st Edition
Pages
1-796
Subjects
Business, innovation, sustainability, environment, green business, environmental issues, urban planning, municipal planning, disasters, social impact of disasters
Cite this article as:
Odli, Z. S. M., Lee, A. J., & Asari, M. A. (2020). Marine Macro-and Microplastic Litter Along The Coastal Area of Kuala Perlis. In N. Samat, J. Sulong, M. Pourya Asl, P. Keikhosrokiani, Y. Azam, & S. T. K. Leng (Eds.), Innovation and Transformation in Humanities for a Sustainable Tomorrow, vol 89. European Proceedings of Social and Behavioural Sciences (pp. 303-312). European Publisher. https://doi.org/10.15405/epsbs.2020.10.02.28