
Public Perception on Water Pricing in Penang


Abstract
Increasing demand and consumption in water threatens water security and is a hindrance to achieve the Sustainable Development Goal (SDG) 6 – Clean Water and Sanitation. As a developing country, Malaysia is still highly dependent on water resources to support economic growth for agriculture, industry and domestic consumption. Penang state records the highest domestic water consumption in the country although it is considered a water-stressed state. The state government has employed integrated water management to sustain the water supply and reduce consumption. Water pricing is one of the approaches that can be used for both supply management and the control of demand management. This paper aims to examine the relationship between the demographic characteristic as factors affecting the water consumption of the Penangites with the perception of water price through a questionnaire survey. A total of 341 respondents from the north-eastern part of George Town, Penang, were randomly selected in this research. The analysis was carried out using SPSS to run the Chi-square test, whereby the p-value is used to indicate the relationship between each demographic variable with Penangites' perception of water tariff. The results show that only age and gender have a significant relationship with the perception of water price. Besides that, there is no significant relationship among education level, income and ethnicity on perception of water price. The research concludes that Penang’s water tariff could be reviewed and increased in terms of different block tariff as one of the mechanisms to reduce domestic demand and consumption.
Keywords: Water demandperceptionwater tariffwater pricingPenangMalaysia
Introduction
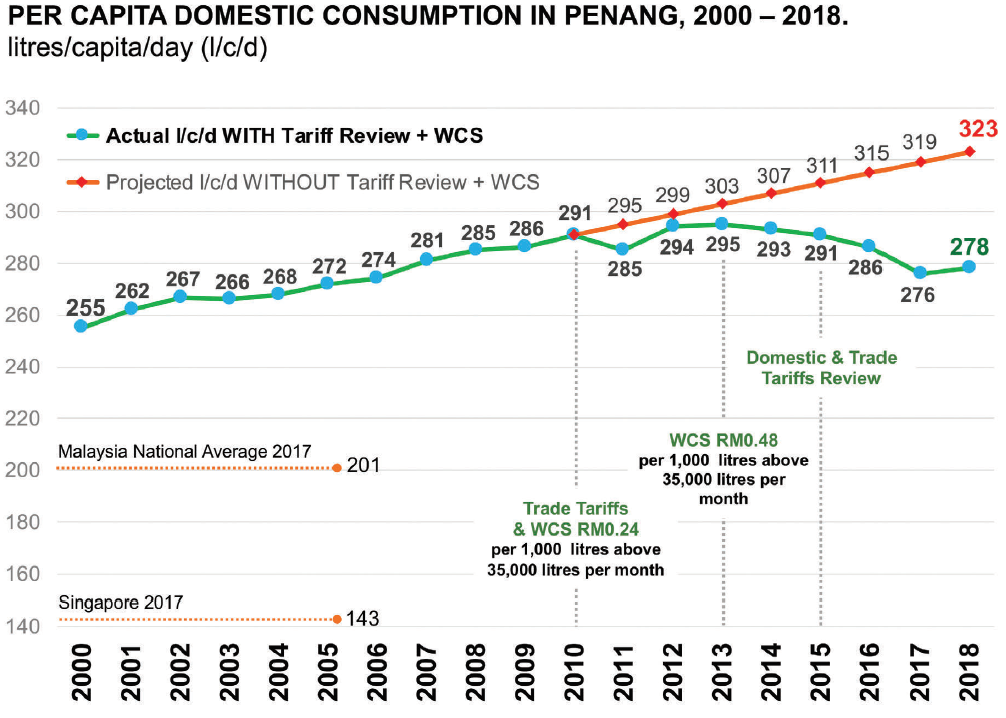
Clean and accessible water for all by 2030 is one of the targets in UN Sustainable Development Goal (SDG) 6. As a tropical country, Malaysia is very rich in water resources as it receives a high amount of rainfall each year. Penang, one of the most urbanized states in Malaysia, has achieved the SDG 6 where clean water is available to almost 100% of local citizen (Jaseni, 2014). They also enjoy the lowest tariff compared to other states in Malaysia, which is USD 0.052 (RM0.22) for the first 20,000 liters. This tariff is relatively low and cheap if compared to other countries like Thailand, Singapore, and Vietnam. However, the highest domestic water consumption in Malaysia was recorded in Penang, which is average 276 liters per capita per day (l/c/d). The amount is much higher than the national average of 201 l/c/d in 2017.
Penang is a water-stressed state because about 80% of its raw water withdraw from Muda River that originates from Ulu Muda in Kedah (Chong, 2018). Ulu Muda is a tropical rainforest that provides tons of ecosystem services to the northern region of Malaysia (Penang, Kedah, and Perlis). One of the most important ecosystem services is freshwater for agriculture, industry and domestic consumption. However, this forest is facing degradation due to human activities. Massive logging and commercial plantation activities in Ulu Muda have affected the quantity and quality of Muda River, harming the water supply in northern Peninsular Malaysia (Mok, 2019). Besides that, Tan et al. (2019) reported that monthly precipitation over the Muda River Basin inclined to decrement during the southwest monsoon (dry season). Moreover, surface temperature at the Muda Dam has been incremented at magnitudes of 0.22~0.32 oC/decade during the 1985-2015 period. Consequently, water scarcity issue might be occurred in the future if no climate adaptation strategies been implemented.
Problem Statement
Penang is highly dependent on Muda River for freshwater supply. Therefore, degradation of Ulu Muda along with high water consumption might lead to water security issue in the future. In order to sustain the water supply, Penang government implemented several water management strategies, mainly top-down approach and emphasis on supply-side management (Chan, 2004).
Domestic consumer in Malaysia is less price-sensitive. Nevertheless, water price could be a tool of demand management to deliver the message on important of water to consumer. Figure
Demographic factor such as age, gender, marital status, income, family background, education, occupation, and family size will affect consumer behaviour and water demand (Kumar, 2014). For example, woman is often the primary water user in domestic consumption. Chen et al. (2012) in their survey found that education level also one of the main factors that affect the pattern of water consumption. However, research on the relationship between water price and demography is still rarely reported.
Research Questions
Is there any significant relationship between the demography variables (age, gender, ethnic education level, and income) and the perception on water price among the Penangites?
Purpose of the Study
The purpose of this study is to investigate the perception of domestic consumer in Penang on water pricing, focusing on the demographic pattern analysis. This study also investigates the perception of local citizen on the awareness of water issue in Penang.
Research Methods
Questionnaire Survey
This research was conducted using a quantitative questionnaire survey, focusing in the north-eastern part of Penang Island. This region was selected because the source of water supply is mainly from Muda River. A total of 341 respondents was selected using random sampling method. The population of the north-eastern part of George Town is 395,714, hence the sample size is 341 people based on the Krejcie and Morgan (1970) sample size table. Some questions within the questionnaire were formulated by referring to the Toolkit for Ecosystem Services Site-based Assessment (TESSA) questionnaire template (Peh et al., 2013). Data collection was started from March 2019 to June 2019.
Statistical Package for Social Science (SPSS) Analysis
Statistical Package for Social Science 20 (SPSS) by IBM software was used to investigate the collected data. Chi-Square test was used to identify the relation among demography variable and perception of respondent to water tariff. A significance level of 95% confidence level was used in this research. Hence, P-value less than 0.05 indicates there is a significant relationship, and vice versa.
Findings
Demography characteristic
Statistical Package for Social Science 20 (SPSS) by IBM software was used to investigate the collected data. Chi-Square test was used to identify the relation among demography variable and perception of respondent to water tariff. A significance level of 95% confidence level was used in this study. Hence, P-value less than 0.05 indicates there is a significant relationship, and vice versa.
This study focused on age, gender, ethnic, education level, and income analysis. Table
Relationship between the demography variable (age, gender, ethnic education level, and income) and the perception on water price
This paper set a hypothesis that demography variable (age, gender, ethnic, education level, and income) have a significant relationship with the perception of water pricing. Table
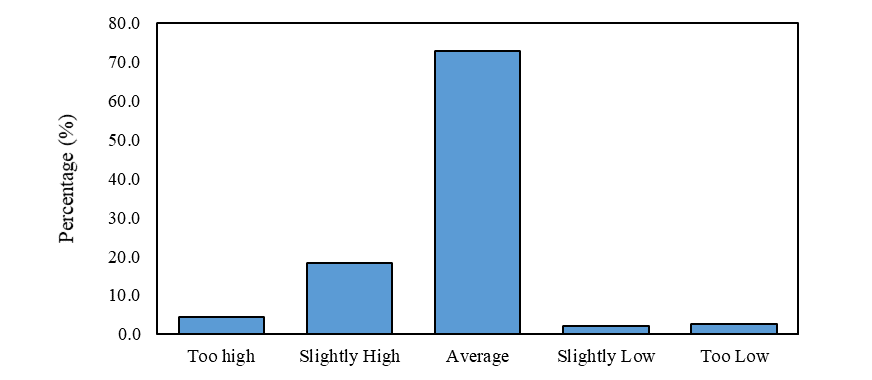
Figure
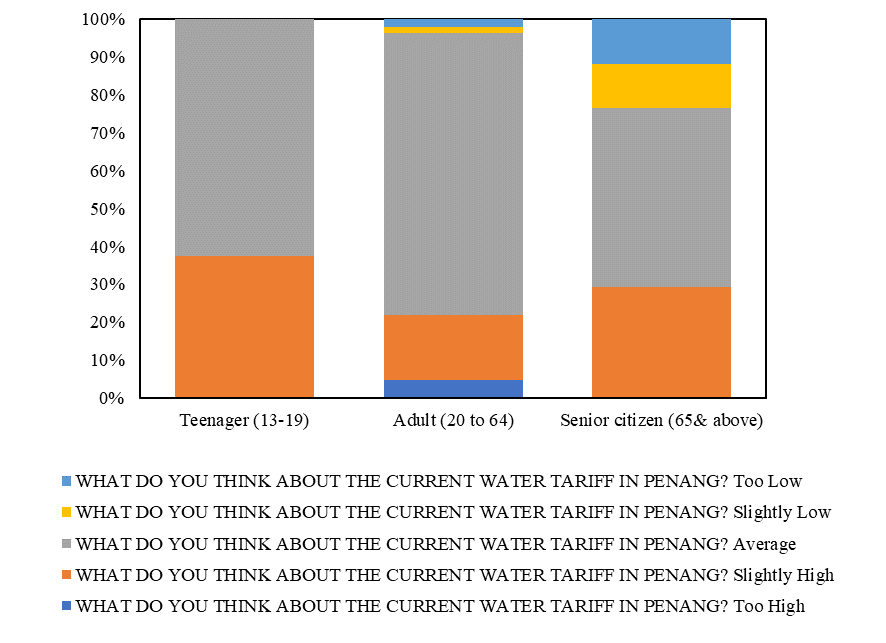
Figure
Conclusion
Climate change and human activities could lead to water security issue in any parts of the world. Water consumer should play their role to increase water use efficiently in the domestic sector, and to ensure sustainable water supply to achieve the sustainable development goal. Undeniable, water price is an effective mechanism to reduce the demand and consumption. The purpose of this research is to examine the relationship between the demographic characteristic as factors affecting the water consumption with the perception of water price in Penang. A total of 341 respondents were randomly selected in this research and the analysis was carried out using Chi-square test. The results show that only age and gender have a significant relationship with the perception of water price. Further study might focus on the willingness of Penangites to pay such as payment for ecosystem services (PES) in order to protect the water catchment area or invest on the water-saving device at their household. This could contribute to ensure water security especially when the state facing the water deficit from time to time.
Acknowledgments
This research funded by the Ministry of Education Malaysia under Fundamental Research Grant Scheme (203.PHUMANITI.6711695), University Sains Malaysia via short-term grant (304/PHUMANITI/6315166) and the South East Asia Rainforest Research Partnership (SEARRP) via Toolkit for Ecosystem Services Site-based Assessment (TESSA) small grant.
References
- Chan, N. W. (2004). A citical review of Malaysia’s accomplishment on water resources management under AGENDA 21. Malaysian Journal of Environmental Management, 5, 55-78.
- Chen, H., Zhang, H., Ma, L., Liu, F., Xheng, W., Shen, Q., Xhang, H., Wei, X., Tian, D., He, G., & Qu, W. (2012). Chang of water consumption and its potential influential factors in Shanghai: a cross-sectional study. BMC Public Health, 18, 450.
- Chong, K. Y. (2018). Move to Gazette Ulu Muda. Star Online. https://www.thestar.com.my/metro/metro-news/2018/05/22/move-to-gazette-ulu-muda-penang-to-renew-talks-with-kedah-to-resolve-logging-issue/
- Department of Statistic Malaysia. (2017). Report of household income and basic amenities survey 2016. https://www.dosm.gov.my/v1/index.php?r=column/pdfPrev&id=RUZ5REwve U1ra1hGL21JWVl PRmU2Zz09
- Jaseni, M. (2014). The road to corporatisation, public listing and beyond. The Ingenieur, 54-65.
- Krejcie, R. V., & Morgan, D. W. (1970). Determining sample size for research activities. Educational and Psychological Measurement, 30, 607-610.
- Kumar, R. (2014). Impact of Demographic Factors on Consumer Behaviour - A Consumer Behaviour Survey in Himachal Pradesh. Global Journal of Enterprise Information System, 6(2), 35-47.
- Mok, O. (2019). No protection for Ulu Muda rainforests water catchment area yet, says Penang Water Supply Corporation. Malay Mail. https://www.malaymail.com/news/malaysia/2019/07/11/no-protection-for-ulu-muda-rainforests-water-catchment-area-yet-says-penang/1770421
- PBA. (2018). Perbadanan Bekalan Air (PBA) Pulau Pinang annual report 2018. http://www.pbahb.com.my/?page_id=564
- Peh, K. S. H., Balmford, A., Bradbury, R. B., Brown, C., Butchart, S. H. M., Hughes, F. M. R., & Birch, J. C. (2013). TESSA: A toolkit for rapid assessment of ecosystem services at sites of biodiversity conservation importance. Ecosystem Services, 5, 51-57.
- Soto Rios, P. C., Deen, T. A., Nagabhatla, N., & Ayala, G. (2018). Explaining water pricing through a water security lens. Water, 10(9), 1173.
- Tan, M. L., Samat, N., Chan, N. W., Lee, A. J., & Li, C. (2019). Analysis of Precipitation and Temperature Extremes over the Muda River Basin, Malaysia. Water, 11(2), 283. https://doi.org/10.3390/w11020283
Copyright information

This work is licensed under a Creative Commons Attribution-NonCommercial-NoDerivatives 4.0 International License.
About this article
Publication Date
12 October 2020
Article Doi
eBook ISBN
978-1-80296-088-4
Publisher
European Publisher
Volume
89
Print ISBN (optional)
-
Edition Number
1st Edition
Pages
1-796
Subjects
Business, innovation, sustainability, environment, green business, environmental issues, urban planning, municipal planning, disasters, social impact of disasters
Cite this article as:
Navamney, L., Tan, M. L., Chan, N. W., & Phang, W. L. (2020). Public Perception on Water Pricing in Penang. In N. Samat, J. Sulong, M. Pourya Asl, P. Keikhosrokiani, Y. Azam, & S. T. K. Leng (Eds.), Innovation and Transformation in Humanities for a Sustainable Tomorrow, vol 89. European Proceedings of Social and Behavioural Sciences (pp. 232-238). European Publisher. https://doi.org/10.15405/epsbs.2020.10.02.22