
Low Socio-Economic Status Among Coastal Fishing Families in Southern Sri Lanka


Abstract
People have fished since the beginning of human history and it was expanded rapidly. Although, fisheries industry is an important sector in the Sri Lankan economy and large number of fishing families are engaging it, they have low socio-economic status affecting industry related causes and income related causes. According to that the study will focus on investigating socio-economic status of the fishing families in the southern coastal region. The main objective is to examine the socio-economic status of the coastal fishing families in the southern coastal region. The study area consisted of coastal DS Divisions from Devinuwara to Ambalangoda and it was carried out in 2014. 10 percent sample (482 households) was used to collect primary data by using random sampling. Primary data were collected through questionnaires while secondary information was collected from the Fisheries offices. Both quantitative and qualitative methods were used to analyse the data. Findings indicate that main occupation was fishery and day income was over Rs. 1000 (43.8%). 62.3% of fishermen’ education level was between grade 1 to10. Population of fishing families has increased by 223 percent and 258 percent in Matara and Galle districts from 1980 to 2014 respectively. Due to the study findings, many coastal householders live on fish industry and earn very low incomes. With the increasing of coastal population their family economies collapse. Thus, an introduction of income generating alternative ways is very important to uplift their economy.
Keywords: Active fisherscoastalemploymentfisheryincome
Introduction
Around the world millions of people have been engaged in fishing and fish trading beginning of human history. Among the coastal livelihood options, fishery is the oldest and most important one of the coastal dwellers in Sri Lanka since ancient times. The coastal areas of Sri Lanka are generally wealthy in their natural resources that offer great opportunities for the livelihood activities, particularly resource-based economic activities such as fishing, tourism and recreation. Coastal fishery sector in Sri Lanka is mainly depends on small-scale fishing. It also supplies a major source of protein for our peoples but it is also a main social and economic contributor of the country. It was during the 20th century that fishing expanded rapidly to the global scale.
The fisheries sector is an important sector in the Sri Lankan economy. It can be divided into three sub sectors such as coastal, offshore and inland fisheries and aquaculture. This study is mainly concern coastal fishery.
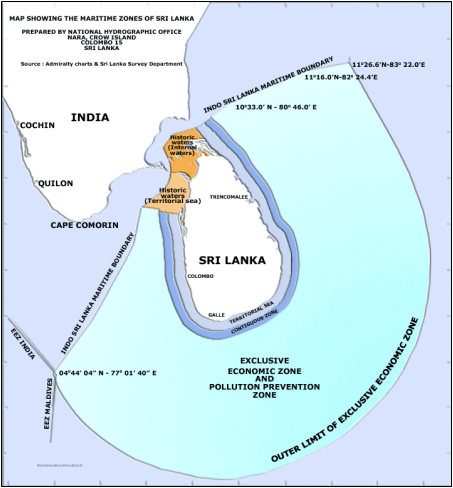
The marine fisheries resource base of Sri Lanka comprises a territorial sea of 21,500 sq. km, an EEZ of 517,000 sq. km. The country has a narrow continental shelf with an average width of 22 km. Its extent is 30,000 km2, which is 5.8 percent of the country’s ocean area. The maritime boundary of Sri Lanka is given in Figure
The annual fishing activity in the coastal fishery determined by a seasonal factor (monsoon) in Sri Lanka. It is in-line with monsoon rainfall pattern of the country which are South-west monsoon (May to September) and North-east monsoon (December to January). Fisheries sector in Sri Lanka accounted for 1.8% of GDP in 2014 (Ministry of Fisheries and Aquatic Resources Development, 2016).
Although, fishing activities increased coastal fishing families are living with low socio-economic status in Southern Sri Lanka. Asian Development Bank (2002); BOBLME (2011) indicate that coastal fishing family’s livelihood consist low socio-economic status. However, there is a lack of study based on this theme especially in Southern Sri Lanka. Therefore, the present study aims to narrow down this gap to the important livelihood sector of coastal area peoples in the study area.
Problem Statement
Population growth in coastal areas has been a worldwide phenomenon since the end of the 20th century. With the prime objective of using the coastal resources for their living, the coastal areas have become habitats for millions of people. Likewise, in Sri Lanka many people have been residing in coastal areas for their living.
The island of Sri Lanka has a coastline of 1585km. Its population is growing rapidly in the coastal regions. The high concentration of people in coastal regions has produced many economic benefits, including improved transportation links, industrial and urban development, and revenue from tourism and food production. Not only the attractive environment for living people, but also the coastal environment offers many socio-economic opportunities. Creel (2003) shows that the socio-economic factors interact with coastal population changes and it affect natural environment. Several studies have attempted to show that the coastal area’s population living with low socio-economic status (Berwick, 2006; Kummu et al., 2016).
The coastal districts in Sri Lanka had a population of 8,189,961 in 1981 and 11,707,636 in 2012 (Department of Census and Statistics, 2015). It has increased by 42.9% within this period. Also, fishing population has increased in the past few decades. Problematic situation is they have been living with poor condition due to their age, low education level, low income and high expenditure, large number of family members, increased the active fishermen and fishery is their main occupation. Further, these fishing families faced industry related causes, mainly income.
In view of the above discussions, main goal of this study on investigating the causes of low socio-economic status of the fishing families in the southern coastal region from Devinuwara (Matara District) to Ambalangoda (Galle District).
Research Questions
The following research questions address the objective of the study:
Has the fishing population of the southern coastal areas in Sri Lanka increased in last decades?
What are the socio - economic factors that affect the livelihood of the fishing families?
What are the socio- economic factors that affect the degradation of fishing resources?
Are existing coastal zone laws and regulations adhered by the fishing people in Sri Lanka
Purpose of the Study
Main aim of the present study is to analysis the socio-economic factors contributing to the livelihood of coastal fishermen in the southern coastal region of Sri Lanka.
Specific objectives:
To examine the income and expenditure contribute to their livelihood
To study the causes that contribute to fish resource degradation
To examine the contribution that increasing number of active fishermen affect coastal fishing families livelihood
To study some socio and demographic factors such as age, education level, main occupation, number of family contribute to their livelihood
To identify the shortcomings of existing laws issued by the government.
Research Methods
Data sampling procedure
Data collection
Primary data, both quantitative and qualitative were collected during the period of January to March 2014. The main method to gather quantitative data was a questionnaire survey. The FGD is used to bring out insights and understandings in ways, which cannot be captured by questionnaire.
Method of Data Analysis
Data analysis consists of both quantitative and qualitative methods. Quantitative analysis was done in terms of frequencies, cross tabulations as well as calculations of statistical indicators. The data set generated four kinds of variables: interval/ratio, ordinal, nominal, and dichotomous; however, interval/ratio level data were few compared to the other variables. Pearson’s Chi square test may be used for examining the reduction of fish resources dependent on the fishing season or period and other factors.
Study area
This section provides brief background on the study areas. As shows in table
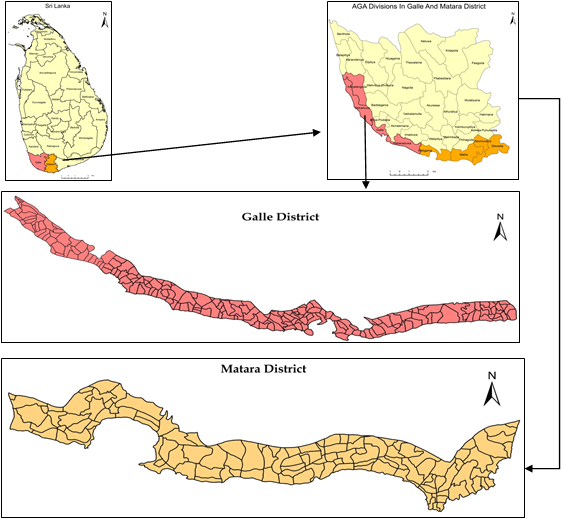
Due to the location of the study area, within the tropics between 050, 55ʹ, 15ʹʹ to 060, 15ʹ North latitude and between 800, 02ʹ, 57ʹʹ to 800, 43ʹ, 7ʹʹ East longitude, the climate of the Sri Lanka could be characterized as tropical. Accordingly, the area stretches from Ambalangoda to Devinuwara topographic sheets (1:63,360) and its’ length of the study area is 112Km (Matara 46km, Galle 66km).
Majority of the population in both districts is engaged in fishery for income generation while agriculture occupies the second place in livelihood activities. Other occupations include industrial activities and employment in the government, corporate and private sectors. High potential development sectors are tourism development and fisheries expansion in the both districts.
Findings
According to coastal fishing population socio-economic status, they utilize the coastal area for many purposes. They used the coast basically for living and other benefits such as engaging in fishing, tourism industry and recreation.
Livelihoods of coastal householders are mainly carried on with coastal resources available in the area. Among the households, 34.2% are engaged in coast related activities and 54.1% are engaged in other (government and private) employment. 11.7% are engaged in both these sectors.
Basic information of fishery
There is some basic information relevant to fishery, which are fishing places and seasons of the fishermen, and family members’ contribution to the fishery. Study area people mainly engage in fishing in near shore (coastal) area. Fishing season varied due to the fishing place. Family members’ contribution to fishery have varied according to their socio-economic status. The findings are shown in Table
According to the fishing seasons about 75% of fishermen engage in fishery throughout the year and 23% of fishermen engage in fishery from November to April (haraya season). Throughout the year fishing means, that there is no specific time (month) for fishing. According to the FGDs it has been convinced. They say that, they engage in fishery the whole year. Due to this long duration of fishing period, a large quantity of fish yield has been caught by the fishermen. Among the family members, the main contributor of the fish industry is a father (73.2 %) and sons’ contribution is very low (22.6 %).
This study examined the reduction of fish resources dependent on the fishing season or period and other reason (Table
Hypothesis,
H0 – There is no significant relationship between the quantity of fish reduction and fishing season.
H1 – There is a significant relationship between the quantity of fish reduction and fishing season.
Pearson’s Chi-Square test analyzing quantity of fish reduction and fishing season yielded a Chi-Square value of 12.36 (Table
E 12.36 (Calculated Chi Square)
H1 - Accepted Χ2 (df = 4) = 12.36 P = 9.48
Calculate Χ2 value is greater than the critical value, so, rejected the null hypothesis and accepted H1.
Fishermen’ education
In this study, with regard to the socio-economic status, the fishermen’s education in the coastal area was given attention. According to the study findings, majority of fishermen’ (62.3%) education level were between grades 1 to10. The results indicate that many fishermen have a low education level and it showed their low socio-economic stat status.
Fishermen’ age
Age of fishing population is an important factor for degradation of fish resources, so here the main attention is given for ages of the fishermen. Due to the study results, the majority of fishermen (25.9 %) were in the 30-39 age group. Further, small numbers of fishermen were in the older age, which is between 50-59 and more than 60.
In the fishing Industry, fishermen acquire much experience as they engage in fishing for a long time in their life time. When they acquire fishing experience, education becomes helpful to them, e.g. they want to know weather and climate situation, fish habit in the sea, about rain, sea current behavior in the sea. Then, the study examines the relationship between the fishermen’ age and their education level. Figure
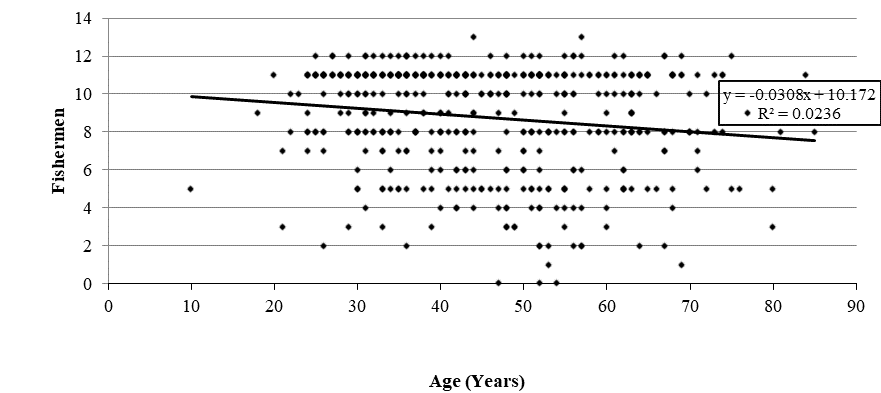
The Figure
Further, the reason for did not present the considerable relationship, some educational changes of the higher cohorts. Thus, the figure represents a cohort effect of fishermen’ age and education level.
Using fishing crafts and fishing methods
Long-lining, Gill netting /Drift gill nets are the most common fishing gears used in Sri Lanka followed by the long line. Out of all fishermen, 37.3% of fishermen used fiber glass reinforced plastic boats (FRP) and 27.6% of fishermen used non- motorized traditional crafts such as vallam, teppam, catamarans.
Due to the fishing place fishermen’ use different fishing methods. Most common methods of cast net and karamal dal are used 44.2% of fishermen (Table
Income of fishermen
Every fishing boat, before going to the sea carries away fuel, ice, foods, drinking water, medicine and other necessary things for their use. Some boat owners have taken loan for the supply of these necessary things to the boat and will be paying them after coming back from their fishing trip. According to the opinion of the FGDs, participants (fishermen) in Dondra, Galle, Hikkaduwa and Mirissa indicate that oftentimes their expenses exceed their income. Sometimes they faced losses in some fishing trips. They couldn’t save money, because there was no remaining money.
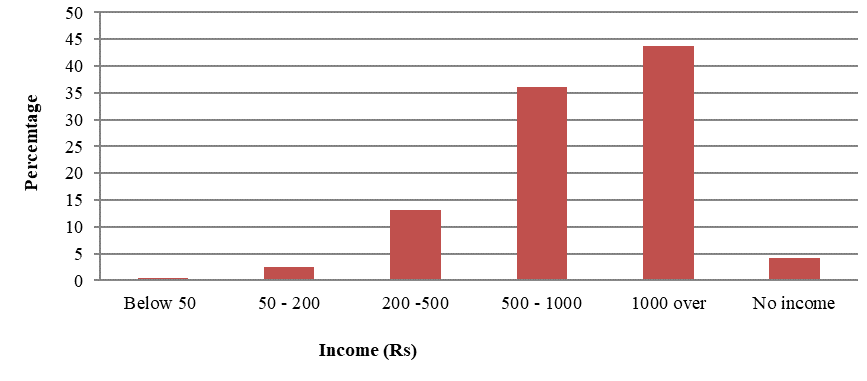
Fishermen said that in most fishing trips they could not catch enough fish harvest. They could not earn enough money on many fishing trips. In most situations, a large portion of the total income was given to the boat owner, and the remainder was divided among other fishermen. As a result, 36.1% of fishermen earn Rs. 500-1000 a day and only 43.8% of fishermen earn over Rs. 1000 a day (Figure
Fishermen’ monthly income and expenditure
Many coastal people are poor and they live on coastal resources like fish. The poor are most affected by environmental damage and live in most degraded areas (Nawarathna Banda, 2006). The monthly income of many fishermen varied from Rs. 10,000 to Rs. 19,999 and from Rs. 20,000 to Rs. 29,999 with a percentage of 32.6 and 31.6 respectively. Although, majority of fishermen’ expenditure exceeded more than their monthly income in the same income category with a percentage of 32.56 and 34.16 respectively. By this it reveals that coastal fishing people are live in poor conditions.
Coastal fishing people face economic problems due to low income and high expenditure. This contradictory relationship between monthly income and expenditure is examined statistically using Pearson correlation. Figure
H0; There is no relation between the monthly income and expenditure.
H1; There is a relation between the monthly income and expenditure
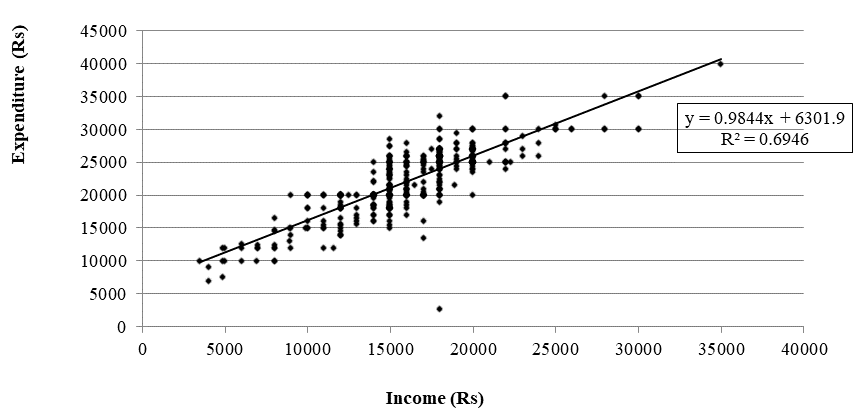
(Source: Field Survey, 2014)
In figure
Diversification fishermen’ activities
As fishermen depend on nature for their occupation, they are compelled to undergo many difficulties, such as risks and shocks, which would obviously negatively affect for the well-being of poor coastal communities. In that respect, the activity diversification would reduce the risk of dependency on one income source. The surveyed households had adapted different activities to lessen the dependency from fisheries as the sole income was generated in the household.
In the absence of fishing or fishing, related activities, 9.5% of fishermen work as labourers and 7.3% were involved in businesses such as petty trading, hiring three wheelers, and school hires. However, still about 66 percent is entirely depend only on the fisheries. They are more vulnerable to shocks rather than those who engage in other income generating activities (Table
Fish production and excessive fishing
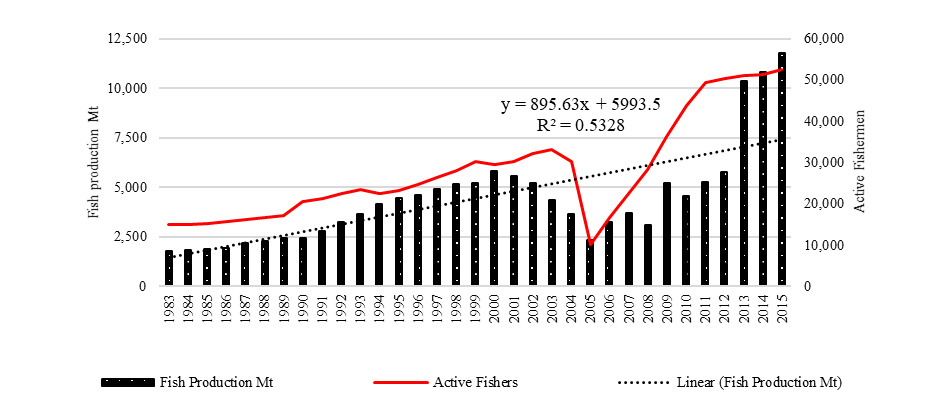
Matara District fishing area consists of Gandara, Gandara west, Dewinuwara, Matara, Mirissa, Weligama, and Kapparatota. Also, fishing areas of Galle District consists of Bentota, Balapitiya, Ambalangoda, Hikkaduwa, Peraliya, Dodandoowa, Galle, Unawatuna, and Kataluwa. In Matara and Galle fisheries Districts fish production have increased considerable level from 1983 to 2015, but after the tsunami it exhibits a slight decrease. After the tsunami it depicts a massive increase of fish production up to now, which has mostly been due to the rapid increase of new vessels with modern technology. Fishing vessels used are Multi-day boats (IMUL), Day boats (1DAY), Fiberglass Crafts (OFRD), Traditional motorized Crafts (MTRB), and Traditional - none motorized Crafts (NTRB). Also, all type of fishing crafts has increased since 2001. The increasing production reveals that both Districts have an excessive fish harvest.
Increase of fishing population
Since the 1980s, population of Matara and Galle district fishing families have increased. It increased from 17263 to 38430 in Matara district from 1980 to 2015 and from 18694 to 48260 in Galle district during the same period. As a result of increases, they needed more incomes which compelled them to catch large quantities of fish yield. Consequently, coastal fishery represents a high level fish yield. However, according to the views of the FGDs participants in Galle, Dondra, Hikkaduwa and Weligama mentioned that as recently more fishermen have joined fisheries, degradation of fish resources has increased severely.
Relationship between the increase of fish production and active fishermen
Fish production as well as active fishermen increased timely in the coastal fishery. This figure clearly represents it after 1990s. The increases of these two variables make high level degradation of fish resources. For understanding the relationship, the increase of active fishermen and the increase of fish production, Pearson’s correlation coefficient test is used. The Figures
H0 -There is no relationship between theincrease of fish production and increase of active fishermen.
H1 - There is a relationship between theincrease of fish production and increase of active fishermen.
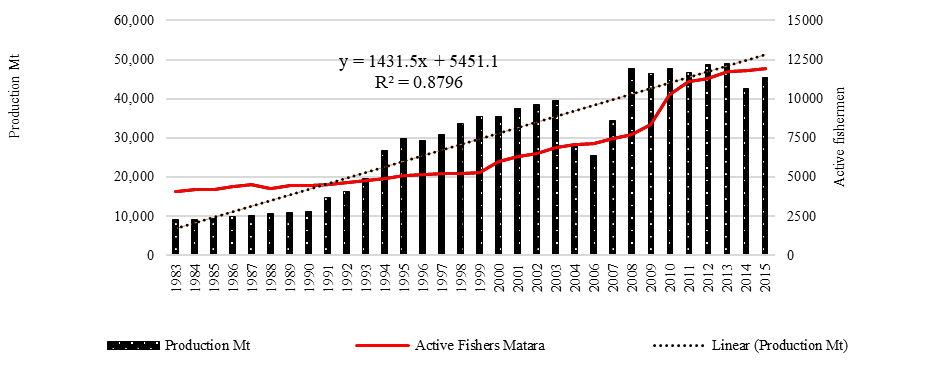
Correlation coefficient value is R² = 0.87. This indicates that there is positive relationship between the increase of fish production and increase
Correlation coefficient value is R² = 0.53. According to the result, there is positive relationship between the increase of fish production and increase of active fishermen in Galle District. According to the above analysis, it makes a clear idea, that a large amount of fish resources has been caught from the sea by the fishermen for a long period.
Conclusion
A majority of household’s is lived in the coastal area and use the coast for fisheries industry. Many fishermen engaging fishery throughout the year, reason for it their income was not enough. Due to the long duration of the fishing period, a large quantity of fish yield has been caught by the fishermen, although, income was divided among the all fishermen. 36.1% of fishermen earn Rs. 500-1000 a day and only 43.8% of fishermen earn over Rs. 1000 a day, this income was not enough for their livelihood. They used harmful fishing methods and instruments such as dynamite and cyanide fishing, light course and Moxy net, course nets, surukku nets and Lila nets. By using these bad methods, they caught a large harvest, and the total fish production from 1983 to 2015 period rose higher, and, using fishing crafts and number of fishermen have increased from 2001 to 2015. Although, fish production increased, parallelly increase the number of fishermen that was a big problem for their income level. Although the sea is rough, stormy and aggressive in the warakan season, fishing activity was high this both periods. As in understanding the study, fish production has risen high, fish yield has been decreased by 50 percent.
Majority of fishermen did not have alternatives. Alternative ways of generating income have to be introduced. Many coastal householders live on fish industry and earn very low incomes. With the increasing of coastal population, especially number of fishermen, their family economies collapse. Thus, an introduction of income generating alternative ways is very important to uplift their economy.
References
- Asian Development Bank, IUCN Sri Lanka (2002). Regional Technical Assistance for coastal and marine resources management and poverty reduction in South Asia (ADB RETA 5974). Situation Analysis Report- Sri Lanka Component.
- BOBLME (2011). Review of community-based ICM: Best practices and lessons learned in the Bay of Bengal - South Asia.
- Berwick, M. (2006). Growth pressures on coastal communities, Chapter 6. The Challenge of Coastal Governance. Hawards Ltd.
- CCD (1990). Coastal Zone Management Plan, Sri Lanka. Coast Conservation Department, Colombo.
- Creel, L. (2003). Ripple effects: population and coastal regions. Population Reference Bureau, Measure Communication (pp. 1-7). Washington, DC.
- Department of Fisheries & Aquatic Resources. (2016). Fisheries statistics, Statistics Division, Colombo.
- Department of Census and Statistics (2015). Summary information of the Census of Population and Housing 2012, Ministry of Policy Planning and Economic Affairs, ‘Sankyana Mandiraya’, 306/71, Polduwa road, Battaramulla.
- Kummu, M., De Moel, H., Salvucci, G., Viviroli, D., Ward, P. J., & Varis, V. (2016). Over the hills and further away from coast: global geospatial patterns of human and environment over the 20th–21st centuries. Environmental Research Letters, 11(3), 034010.
- Ministry of Fisheries and Aquatic Resources (2016). Statistics, Fisheries industry in Sri Lanka, Colombo.
- Nawarathna Banda, H. M. (2006). Coastal Poverty and Environmental Degradation in Sri Lanka. Proceedings of the Annual Research Symposium 2006 - Faculty of Graduate Studies, University of Kelaniya, Sri Lanka.
Copyright information

This work is licensed under a Creative Commons Attribution-NonCommercial-NoDerivatives 4.0 International License.
About this article
Publication Date
12 October 2020
Article Doi
eBook ISBN
978-1-80296-088-4
Publisher
European Publisher
Volume
89
Print ISBN (optional)
-
Edition Number
1st Edition
Pages
1-796
Subjects
Business, innovation, sustainability, environment, green business, environmental issues, urban planning, municipal planning, disasters, social impact of disasters
Cite this article as:
Dayalatha, W. K. V. (2020). Low Socio-Economic Status Among Coastal Fishing Families in Southern Sri Lanka. In N. Samat, J. Sulong, M. Pourya Asl, P. Keikhosrokiani, Y. Azam, & S. T. K. Leng (Eds.), Innovation and Transformation in Humanities for a Sustainable Tomorrow, vol 89. European Proceedings of Social and Behavioural Sciences (pp. 139-151). European Publisher. https://doi.org/10.15405/epsbs.2020.10.02.13