
Labour Underutilization In The Russian Federation: Economic And Statistical Aspect

Abstract
Due to the implementation of new international standards into labour activity statistics in the Russian Federation, study, variable-based evaluation, and identification of labour underutilization trends is important. Labour underutilization is the main category at labour market, and it influences both the social and economic, and political environment in the country. This paper considers the issues of statistical evaluation of labour underutilization in the Russian Federation. The purpose of the study is to provide a statistical analysis of the dynamics, structure and spacial features of the main indexes of labour underutilization in the Russian Federation. The methods of statistical modeling and forecasting of temporal series, nonparametric statistical multivariable estimation (the method of multivariate L1-mean), and analysis of structural changes were used. The main attention was paid to underemployment study, which is characterized by three statistical values. The analysis of temporal series was carried out, point and interval forecast of the main underemployment values were made, and structural changes in the context of economic activities were analyzed. The regions of the Russian Federation were ranked according to the underemployment indexes, and the territorial regularity in their distribution was revealed on the basis of the method of multivariate L1-mean. The results obtained allow to characterize the regions of the country in the terms of labour underutilization, as well as to develop regional strategic programs for labour market regulations.
Keywords: Forecastlabourstatisticsunderemployment
Introduction
Labour is the basis of the people’s life and society. The role of labour consists not only in meeting people's needs, but also in development of workers, who acquire skills and competence, develop their talents, and increase their knowledge in the labour process. This leads to new demands and the need to satisfy them. The purpose of statistics is to develop methodological methods of labour accounting and identify problems in this area. The fundamental difference between the updated international standards on labour statistics, adopted by the International Labour Organization (ILO) in October 2013 (CLS-Resolution-I-[STATI-131114-1]–Ru), is that the concept of labour participation and labour underutilization (LU) have been introduced instead of the concept of economic activity. Labour underutilization is a macroeconomic problem that has a significant impact on both the individual and society as a whole. In addition, it can be considered as an immediate cause of the decrease in the standard of living in the country and reducing its production and raw materials potential. Thereby, the LU problem is considered in depth by the State. Numerous discussions and researches are conducted, and various programs to increase employment are developed and implemented.
Problem Statement
The analysis made by the authors showed that today the problem under consideration, on the one hand, is very popular in scientific researches, but on the other hand, there is a shortage of researches based on statistical methods.
Most researchers focus on the macroeconomic and microeconomic consequences of labour underutilization. Ashurkina (2017) believes that inefficient use of productive forces leads to under exploitation of production capacity, incomplete use of community resources, and a decrease in the potential gross national product and income. In the study (Chekmareva & Rossoshanskii, 2017) this problem is considered in the context of underutilization of the labour potential quality in the region. The authors developed a methodology for its evaluation and tested it on statistical materials of Vologda region. At the same time, many researchers accept the key role of the State to increase labour utilization, and they link this with the possibility to develop the country's human potential (Bakanach, Proskurina, Karyshev, & Tokarev, 2015).
Among the studies with statistical orientation, we can distinguish the following. The work of Zainullina (2017) is of great practical importance, which deals with the application aspects to implement International Labour Organization standards in statistical practice, including those of evaluation of labour underutilization. Chernykh (2019) offers the author's interpretation of the term "potential labour", which includes all those of working age who during a short accounting period were neither employed nor unemployed. In addition, the author introduces the "consolidated figures of labour underutilization", based on the expanded concept.
A large amount of scientific papers is devoted to the research results on a particular territory. These researches deal with particular aspects of labour underutilization.
Aydede and Dar (2016) developed a "mismatch measure" of offer and demand in the Canadian labour market. Taking into account a large amount of migrants with a high level of education in this country, the authors believe that they can be actively involved in employment, including positions that are not in demand by the indigenous people of Canada.
Several European researchers have examined the problem of labour underutilization among young people. According to the results of the panel study of UK households, Green and Henseke (2016) made an analysis of labour market trends and introduced a new statistical value of graduate jobs, based on the requirements for skills in "digital" (3D) professions. They concluded that it was difficult to achieve a combined balance between the number of University graduates and jobs. The identical study was completed in Catalonia by Turmo-Garuz, Bartual-Figueras and Sierra-Martinez (2019). The authors used logit and probit statistical models to determine the probability that a graduate would need to retrain for a new profession in order to become competitive in a changing labour market, and how all this depends on the chosen field of knowledge.
Another group of researchers focused on the issues of "excessive education", that is to say, the discrepancy between the education level and availability of work. Meliciani and Radicchia (2016), using probit models with self-selection, studied the issues of labour spatial mobility in Italy, caused by the discrepancy between work and education. In Europe, similar studies were conducted by Mateos-Romero and Salinas-Jiménez (2018), Flisi, Goglio, Meroni and Vera-Toscano (2017).
At the Russian level, we distinguished a comprehensive study of Sibirskaya and Mikheykina (2019), the authors conducted a statistical evaluation of labour underutilization in the regions and also offered recommendations to expand labour market monitoring.
Research Questions
The following questions were asked in the course of the study:
What quantitative characteristics can describe labour underutilization;
What is the peculiarity of changes in LU measures;
What kind of structural changes have occurred in underemployment by economic activities over the past two years;
How are the regions of the Russian Federation divided by LU values and are there any geographical regularities?
Purpose of the Study
The purpose of the study is to provide a statistical analysis of the dynamics, structure and spacial features of the main indexes of labour underutilization in the Russian Federation. The information base is official Rosstat data and scientific works on the subject. The object of study is the labour market in the Russian Federation. The subject of the study is the quantitative features and regularities of labour underutilization in Russia. The results obtained will provide a scientific basis to apply statistical methods to evaluate labour underutilization of the territory.
Research Methods
The following research methods were applied in this study:
1. Time series modeling.
The peculiarity of building time series models is that the modeling object is temporary data, the effective variable is the levels (Y) of the series, and the factorial variables can be either "time" (t), or levels related to other moments of time. Temporary data models, which represent the dependence of an effective feature on time, are divided into several types, for example, trend models, seasonality models, or trend and seasonality models.
Analysis tools of our study were trend models based on quarterly data. This allowed the authors not only to mathematically record the main development trend, but also take into account possible intra-annual fluctuations in the levels of the series, which are related to the change of seasons. The key category in statistical modeling of temporal series is "trend". This is the main trend of development, that is to say, a steady systematic change in the process over a long period of time. Trend estimation is made by various methods, in particular, parametric. It consists in selecting a functional relation that would describe the trend of a series: straight-line, parabolical, exponential, etc.
2. Methods of statistical forecasting.
Forecasting is one of the main parts of the management process. If we cannot imagine the expected event, we will not be able to make effective management decisions.
There are several ways to develop specific forecasts in statistics. The most common method is extrapolation. It represents an extension of the identified trend into the future.
An important issue in forecasting temporal series is the selection of a mathematical function to calculate theoretical levels. Conclusions about the regularities of the phenomena under study depend on the solution of this issue. If the type of chosen mathematical function is adequate to the main development trend of the phenomenon over time, then the model, synthesized on this basis, can be useful for forecasting and other practical purposes. The function is selected both on the basis of visual analysis of the graphic presentation of the series and special measures.
3. Method of structural changes analysis.
The important purpose of statistical analysis is not only to establish the fact of differences between two (or several) structures, but also quantify and evaluate these differences. At the simplest level, the method of problem solving is to evaluate the changes in the proportion of particular parts of the total. In a broader and more complex statistical analysis, interest is more often directed not only to differences in the specific gravity of particular parts, but also to the difference in the compared structures as a whole. A generalizing characteristics is important when it is necessary to compare and evaluate structural changes that have occurred over two or more periods.
Various measures have been developed in statistics to evaluate structural changes: integral coefficients by K. Gatev and A. Salai, indexes of structural changes by L.S. Kazints, and others. We used the Index of Ryabtsev (IR) in our study as the most theoretically sound measure:
,
where
The meaning of the Index of Ryabtsev is correlation between the true measure of deviation of the component values of two structures and their maximum possible value. Another advantage of the coefficient is the standardization of values from 0 to 1, where 0 means the identity of the structures and 1 means the complete opposite of the structures.
4. Multivariate L1-mean method.
To determine the territorial differences in the underemployment level in the regions of the country, a nonparametric method of comparative analysis was used, that is to say, a multivariate L1-mean method. It is about to obtain a generalizing expression of different-scale characteristics of a multiple phenomenon, taking into account the differences which are common to natural values of features. For this purpose, natural values of indexes are transferred into standardized values of indexes by a ratio of true values with the mean observations of features:
On the basis of particular standardized values of indexes for each region, a generalized multivariate L1-mean score is calculated using the formula:
According the result of the calculation, the regions can be arranged in order of size (from smaller to larger or vice versa), and relevant conclusions can be made. This method is convenient because it allows grouping by several variables (in our case, by three), and it is not related to a specific random distribution. This shows its nonparametric nature.
Findings
Labour underutilized (LU) is a mismatch between the offer of labour and the demand for it. The presence of LU leads to the situation in the society where people have an unmet need for jobs, and it does not matter whether these positions are optimal for people and how they correspond to their desires.
Rosstat collects various information on the LU size but we should understand that this phenomenon is complex, and it is characterized by more than one index. We can say that LU is a system that consists of three components:
Part-time employment. This is a situation when the working hours of a person have duration less than those which were originally provided and he or she was ready for;
Potential labour. This is a situation that is characterized by the presence of people who are ready to participate in labour activities, but there are a number of conditions that hinder or restrict their ability to become employed;
Unemployment. A situation that reflects an active search for work (employment) by a person.
Taking into consideration the complexity of the LU concept, we consider it necessary to focus our scientific attention on one component – underemployment of the Russian population. The source data is a temporal series with a quarterly dividing from the first quarter of 2013 to the first quarter of 2019. The length of the temporal series was 24 periods. This is a long series enough to make forecast calculations. Quarterly detailing allows the authors to take into account such an element of the temporal series as a seasonal component.
To make an analysis, the following measures were taken. They reflect underemployment in its various manifestations (in brackets, we indicate their conventional signs):
Number of employees who worked part-time on the initiative of the employer, thousand people (Y1),
Number of employees who worked part-time under an agreement between the employee and the employer, thousand people (Y2),
Number of employees who were inactive due to the fault of the employer and for reasons beyond the control of the employer and the employee, thousand people (Y3).
According to the Y1 value, we received almost a twofold decrease for the period 2013-2019 from 107.1 to 60.5 thousand people. However, the dynamics does not have a clear-cut trend. Thus, in 2015-2016, there was a small increase in the number of employees who worked part-time on the initiative of the employer, which was replaced by a prolonged decline since the beginning of 2017. In the third quarter of 2018, the minimum value of 47.9 thousand people was reached.
In terms of Y2, the upward trend is very noticeable. A small decline in 2017 only shaded the common pattern. However, the peculiarity of this dynamics is that the index reached its maximum in the second quarter of 2016 (811.6 thousand people) and since then has not surpassed it, getting close to the marker "800".
According to the Y3 index, there is a noticeable fluctuation in the levels of the series. Consequently, the straight-line trend is determined with a sufficiently large complexity.
Figure
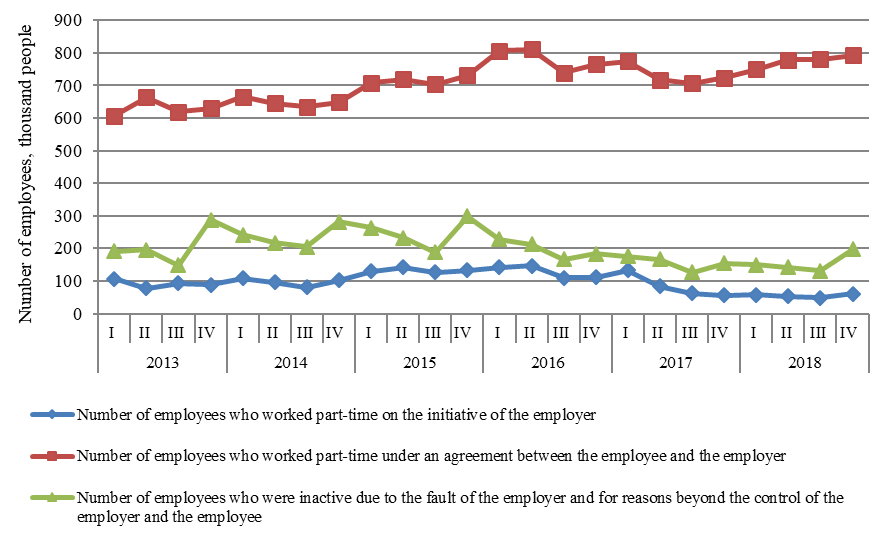
Source: authors based on (Federal State Statistic Service, 2019).
A logical continuation of the temporal series analysis is the forecasting of economic measures. The type of model that best approximates the actual process was determined for each of the measures. In terms of Y1, it is a parabolical model (quadric polynome), and Y2 and Y3 it is a straight-line trend with quarterly seasonality. The authors of the paper have calculated point and interval forecasts of underemployment measures for several quarters (including the first quarter of 2020). The results are shown in Table
Thus, according to the forecast until the end of the forecast period, the index "number of employees who worked part-time on the initiative of the employer" in Russia will have a decreasing trend. For the first quarter of 2020, the forecast value will be formally negative, which does not make economic sense. Two other underemployment measures will have an increase in forecast values in connection with the rising trend.
We will complement the analysis of the dynamics of statistical underemployment indexes with the calculation of structural changes indexes (Index of Ryabtsev, IR). The compared periods are the first quarters of 2017 and 2019. The analysis is made in the context of economic activities.
The IR value for Y1 is 0.029. This value is in the range from 0.000 to 0.030 and means "structures identity". The IR value for Y2 is 0.042 and for Y3 is 0.039. These values are in the range from 0.031 to 0.070 and characterize "a very low level of structural differences".
Therefore, the differences in the structure of underemployment indexes for the first quarters of 2017 and 2019 are insignificant and indicate that there are no significant changes. Owing to the comparative analysis by the multivariate L1-mean method, the group members of Russian regions were determined according to the generalizing evaluation of the underemployment level (Figure
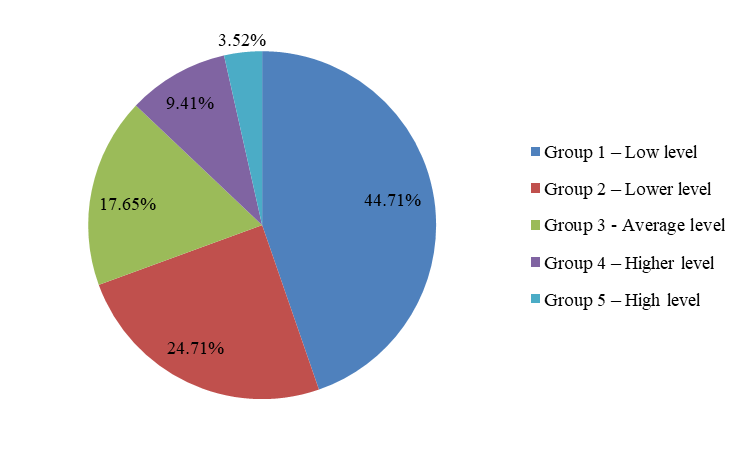
Source: authors.
The first group, which has the lowest level of underemployment multivariate value, includes 38 regions of the Russian Federation. These are mainly Northern and Eastern territories, such as Magadan region, Nenets Autonomous Area, and the Republic of Tyva, but other parts of the country are also represented (Komi, Tambov region, Sevastopol, etc.). The second group has relatively low underemployment indexes by the territorial entities of the Federation. This group includes 21 regions, which mainly belong to the European part of the Russian Federation. The third group with an average level of underemployment includes 15 regions. They are representatives of almost all federal districts and have a good level of socio-economic development. Underemployment indexes are relatively high in the fourth group. It includes 8 regions that are leaders in a particular economic area: Saratov and Chelyabinsk regions, the Republic of Bashkortostan, Sverdlovsk and Nizhny Novgorod regions, Perm region, St. Petersburg, and Samara region. The fifth group has the highest level of underemployment among the regions of the Russian Federation. This group includes only 3 regions: Moscow, the Republic of Tatarstan and Moscow region. Thus, there is a certain territorial regularity in labour underutilization in Russia. Its level is quite low in regions with severe climatic condition, and the highest in the economically developed regions of the European part of the country.
Conclusion
-
The phenomenon of labour underutilization was considered from the standpoint of statistics, that is to say, its qualitative content was determined, and a system of measures for quantitative evaluation was offered. These measures include "number of employees who worked part-time on the initiative of the employer, thousand people" (Y1), "number of employees who worked part-time under an agreement between the employee and the employer, thousand people" (Y2), "number of employees who were inactive due to the fault of the employer and for reasons beyond the control of the employer and the employee, thousand people" (Y3). They are calculated by Rosstat and have a quarterly frequency;
-
The dynamics of these indexes in Russia has a various trends and seasonal components, which are reflected on their forecast values. There is a decrease in Y1values, a slight but noticeable increase in Y2, and noticeable fluctuations but overall growth in Y3;
-
Structural changes in the context of economic activities over the past 2 years (in quarterly dynamics) were almost imperceptible;
-
In the framework of the nonparametric multivariate L1-mean method, a comprehensive evaluation was made, and the regions of the Russian Federation were ranked according to the underemployment indexes. It is established that the regions with a high level of socio-economic development have the highest values of labour underutilization.
References
- Ashurkina, A. V. (2017). The problem of employment and unemployment in the Russian Federation. New Science: Experience, Traditions, Innovations, 1-1(123), 17-19. [in Rus.].
- Aydede, Y., & Dar, A. (2016). The cost of immigrants’ occupational mismatch and the effectiveness of postarrival policies in Canada. IZA J Migration, 5, 9. DOI: 10.1186/s40176-016-0057-z
- Bakanach, O. V., Proskurina, N. V., Karyshev, M. Y., & Tokarev, Y. A. (2015). The development of human potential in the countries of the European Union. Mediterranean Journal of Social Science, 6(6), 351-359. DOI: 10.5901/mjss.2015.v6n6s3p351
- Chekmareva, E. A., & Rossoshanskii, A. I. (2017). Untapped potential: An assessment of underutilization of qualitative characteristics of the working population. Voprosy Territorial'nogo Razvitiya, 3(38), 1-10. [in Rus.].
- Chernykh, Y. A. (2019). Underutilization of labour force: Methodological approaches to measurement and statistical analysis. Living Standarts of the Population in the Regions of Russia, 2(212), 52-62. [in Rus.]. DOI: 10.24411/1999-9836-2019-10064
- Federal State Statistic Service (2019). Labor market, employment, and salaries. Retrieved from https://www.gks.ru/labour_force Accessed: 05.10.2019. [in Rus.].
- Flisi, S., Goglio, V., Meroni, E. C., & Vera-Toscano, E. (2017). Measuring occupational mismatch: Overeducation and overskill in Europe—Evidence from PIAAC. Social Indicators Research, 131(3), 1211–1249. DOI: 10.1007/s11205-016-1292-7
- Green, F., & Henseke, G. (2016). The changing graduate labour market: Analysis using a new indicator of graduate jobs. IZA Journal Labor Policy, 5, 14. DOI: 10.1186/s40173-016-0070-0
- Mateos-Romero, L., & Salinas-Jiménez, M. M. (2018). Labor mismatches: Effects on wages and on job satisfaction in 17 OECD countries. Social Indicators Research, 140(1), 369–391. DOI: 10.1007/s11205-017-1830-y
- Meliciani, V., & Radicchia, D. (2016). Informal networks, spatial mobility and overeducation in the Italian labour market. The Annals of Regional Science, 56(2), 513–535. DOI: 10.1007/s00168-016-0752-y
- CLS-Resolution-I-[STATI-131114-1]–Ru. Resolution concerning statistics of work, employment and labour underutilization. Retrieved from https://www.ilo.org/global/statistics-and-databases/ standards-and-guidelines/resolutions-adopted-by-international-conferences-of-labour-statisticians/WCMS_230304/lang--en/index.htm Accessed: 05.10.2019.
- Sibirskaya, E. V., & Mikheykina, L. A. (2019). The assessment of underutilization of labour force in the Russian Federation regions. Federalism, 1(93), 24-37. [in Rus.].
- Turmo-Garuz, J., Bartual-Figueras, M., & Sierra-Martinez, F. (2019). Factors associated with overeducation among recent graduates during labour market integration: The case of Catalonia (Spain). Social Indicators Research, 144(3), 1273–1301. DOI: 10.1007/s11205-019-02086-z
- Zainullina, Z. Z. (2017). On the introduction of the updated ILO standards in line with the resolution on statistics of work, employment and labour underutilization into the statistical practice. Voprosy Statistiki, 3, 9-12. [in Rus.].
Copyright information

This work is licensed under a Creative Commons Attribution-NonCommercial-NoDerivatives 4.0 International License.
About this article
Publication Date
01 April 2020
Article Doi
eBook ISBN
978-1-80296-081-5
Publisher
European Publisher
Volume
82
Print ISBN (optional)
-
Edition Number
1st Edition
Pages
1-1004
Subjects
Business, innovation, management, management techniques, development studies
Cite this article as:
Proskurina, N. V., Tokarev, Y. A., & Bakanach, O. V. (2020). Labour Underutilization In The Russian Federation: Economic And Statistical Aspect. In V. V. Mantulenko (Ed.), Problems of Enterprise Development: Theory and Practice, vol 82. European Proceedings of Social and Behavioural Sciences (pp. 606-615). European Publisher. https://doi.org/10.15405/epsbs.2020.04.77