
The Influence Of The Population Distribution System On Regional Development

Abstract
The population distribution system of a particular territory can be uniform or concentrated. Concentrated settlement leads to an increase in the agglomeration effect and accelerate the development of the region. However, excessive concentration can cause a disruption effect, which is the opposite of the agglomeration effect. This article assesses the balance of the population distribution system in accordance with Zipf's law. The research object selected 37 municipalities in one of the regions of Russia – Samara’s region. These municipalities cover 100% of the region’s population. It was revealed that for the period 2010-2018 the region’s population distribution system has become more unbalanced: the share of high-ranking municipalities has increased, the deviation of the actual share from the ideal has increased in 30 of 37 municipalities. The hypothesis about the relationship between the pace of development of the region and the balance of the population distribution system was tested. The annual growth rate of Gross Regional Product per capita at the prices of the previous year was used as an estimated indicator of the region's development rates. It was revealed that there is a negative functional and statistical relationship: the greater the imbalance of the population distribution system relative to the Zipf’s law, the lower the pace of development of the region. It is possible to explain this dependence through the effect of agglomeration diseconomies: the development of the largest municipalities in the Samara’s region has reached its limit, therefore, conditions must be created for the development of medium, small municipalities.
Keywords: Zipf’s lawpopulation distribution systemterritorial distributionrank size distributionagglomeration effectagglomeration diseconomies
Introduction
The population of a certain territory is settled in the settlements that form the population distribution system. There are two main groups of models of the population distribution system:
A concentrated model in which the population is unevenly distributed across settlements;
A smoothed model in which the population is distributed relatively evenly across settlements.
Typically, population distribution systems develop according to a concentrated model. Various economic theories are known that describe the optimal distribution of the population by population centers, for example, the theories of Christaller, Losch, Zipf, etc. The actual distribution of the population may differ from the ideal values calculated according to one or another theory. There is an imbalance in the population distribution system, which can have a positive or negative impact on the socio-economic development of the region.
This article assesses the degree of balance of the region's population distribution system according to Zipf's law. One of the regions of the European part of Russia, the Samara Region, was taken as an object of study. The following is an assessment of the impact of the degree of balance of the population distribution systems according to Zipf's law on the pace of development of the Samara region.
Review of previous studies
Zipf proposed a formalized theory using the ratio “rank-size”, which shows the optimal distribution of the population by settlements (Zipf, 1949). His formula found application in the analysis of population distribution systems at the global, national, regional and even intracity levels (Friesen, Taubenböck, Wurm, & Pelz, 2018). Using Zipf’s law, an analysis was made of the population distribution system of many states, for example, Russia (Rusanovskiy, Markov, & Brovkova, 2018), Poland (Cieslik & Teresiński, 2017), USA (Devadoss, & Luckstead, 2016), Brazil (Chauvin, Glaeser, Ma, & Tobio, 2017), Mexico (Pérez-Campuzano, Guzmán-Vargas, & Angulo-Brown, 2015), China (Farrell & Nijkamp, 2019), India (Luckstead & Devadoss, 2014), Pakistan (Arshad, Hu, & Ashraf, 2019) and others.
In some works, it was found that Zipf's law works best when studying objects distinguished not by administrative, but by functional boundaries (Veneri, 2016). The “rank-size” pattern is used when analyzing the distribution of not only the population, but also other indicators, for example, employment (Tsekeris, 2019), firms (Bee, Riccaboni, & Schiavo, 2017), etc.
Alternative approaches to assessing the degree of balance of the population distribution system
As an approach to revealing the spatial balance of the population distribution system, not only Zipf's law can be applied, but also the Lorentz curve, Gini coefficient (Farrell & Nijkamp, 2019), the Herfindahl-Hirschman index, the calculations of Christaller, Losch, etc. Zipf's law can be used in combination with other spatial patterns, for example, the distance between cities (González-Val, 2019).
Problem Statement
Research hypothesis
The hypothesis of the study is the connection between the pace of development of the region and the balance of the population distribution system. The annual growth rate of GRP (Gross Regional Product) per capita at the prices of the previous year is used as an indicator characterizing the economy of the region. The Zipf's coefficient is used to characterize the degree of balance of the population distribution system.
The concentration of the population can have both positive and negative effects. For example, with concentration, an agglomeration effect occurs, which accelerates development compared to a uniform distribution of the population. However, excessive concentration can lead to the emergence of a agglomeration diseconomies, which is the opposite of the agglomeration effect, which will ultimately undermine the competitive advantages over the even distribution of the population. Of course, the balance of the population distribution system does not determine the development of the region by 100%, because there are many other factors. In addition, the degree of influence of the population distribution system is due to the geographical and economic connectivity of the settlements within this system.
Study Assumptions
The following assumptions were made as part of the study:
Cities or another settlements are usually accepted as elements of a population distribution system. In this study, instead of settlements, local administrative unit (which called municipalities) of the first level (they are not included in other municipalities) were investigated: urban districts and municipal areas. Within municipal areas there are several lower-level municipalities (e.g. urban settlements, rural settlements). In this study, such a high level of detail of the population distribution system was not carried out, confining itself to first-level municipalities.
Municipalities were considered within their administrative boundaries. However, in reality, some administrative units form a single socio-economic system, their built-up territories are combined, as a result of which an agglomeration is formed. Therefore, it would be more logical to consider some integrated municipalities as a single municipality (as an agglomeration). However, in Russia there are no statistics on agglomerations.
As an indicator characterizing the development of the region, the annual growth rate of GRP per capita at the prices of the previous year was taken. An alternative indicator could be labor productivity, average monthly wages, etc.
Research Questions
The study posed the following questions:
Does the degree of balance of the population distribution system affect the pace of development of the region?
If the degree of balance of the population distribution system has an effect, is it positive or negative?
Purpose of the Study
In accordance with the research questions, the following goals were set:
Find the deviation of the region’s population distribution system from the ideal value according to Zipf’s law;
To study the relationship between the indicator of the balance of the population distribution system and the annual growth rate of GRP per capita at the prices of the previous year;
Draw conclusions.
The practical significance of this research is expressed in the fact that the revealed dependencies will show the advisability of choosing one or another policy in the formation of a population distribution system (population concentration; the policy of "unloading" of large municipalities).
Research Methods
Zipf’s law, other methods and data sources
Zipf's law is described by the formula (1):
(1)
where Pn– optimal population of a city with a rank “n”; P1 – population of the largest city of this population distribution system.
Note that there are more complex interpretations of Zipf's law, for example, in the form of constructing a linear regression dependence between the decimal logarithm of the actual population and the logarithm of rank (Zipf, 1949; Andreev, Lukiyanova, & Kadyshev, 2018):
(2)
where N – population of a city with a rank “R”; R – rank; a – Zipf's coefficient; A – constant.
If , then there is a concentration of the population in large cities. If , then there is a concentration of the population in medium and small cities. The constant “A” shows the target population of the largest city to approximate the distribution according to Zipf's law (when “a” equals “-1”).
The study uses regression, correlation and comparative analyzes. The source of statistical information was the website of the Federal State Statistic Service of Russia (Federal State Statistic Servi…, 2018).
Object of study
In Russia, it is possible to distinguish the following population distribution systems: at the local level, subregional (part of the region), regional, at the level of the federal district (several regions), at the state. However, within the state and the federal district, the institutional conditions are uneven: regional policy, the volume of transfers from the federal center, and so on are different. Therefore, it would be logical to conduct an assessment at the regional level. The object of research is the Samara region. The analyzed period: 2010-2018.
It is important to answer the question about the sample of settlements within the region. In paragraph 2.2. it has already been said that first level municipalities were taken. When applying the Zipf's law, there are different approaches to sampling:
A mixed sample of first-level municipalities (urban districts) and second-level municipalities (urban settlements). Those. those municipalities that are conditionally referred to as “cities” are selected. Sometimes a selection is added according to the criterion “population” (for example, cities with 100 thousand people are selected);
A mixed sample of first-level municipalities (urban districts) and second-level municipalities (urban settlements, rural settlements);
In this study, an alternative approach is used: only the municipalities of the first level (urban districts and municipal areas) are analyzed. Such a sample will cover 100% of the region’s population, and it is not necessary to collect statistics on small rural settlements in municipal areas.
In the Samara's region there are 37 first-level municipalities (which are not included in any other municipalities): 10 urban districts, one of which is an urban district with intracity division, 27 municipal districts. Samara as an urban district with intracity division includes 9 intracity districts (municipalities of the second level). Within 27 municipal districts there are 296 municipalities of the second level: 12 urban settlements and 284 rural settlements. I.e. total 305 municipalities of the second level (Government of the Samara's region, 2018).
Findings
Description of the research object
The population of the Samara's region at the beginning of 2018 is 3193514 people who are accomodate in 37 first-level municipalities (Table
Perfect share according to Zipf's law, actual share of municipalities in the region’s population
It is necessary to compare the actual distribution with the perfect. The perfect share was found as follows (Table
It is suggested that a city with a rank “1” already has a perfect population (in step 5, this assumption is reviewed);
Perfect population can be found for all other municipalities: the rank is known for all municipalities, so formula (1) can be used;
The total perfect population of all municipalities is found (through summation);
The perfect share of each municipality from the total perfect population is found;
Based on the actual total population of all municipalities and the known perfect share of each municipality, we can find the perfect population of each municipality (taking into account of the actual total population).
All 37 municipalities of the Samara's region are divided into 3 approximately equal groups (12, 12, 13 municipalities). Each group can be conditionally classified taking into account the population as relatively large, relatively medium, relatively small. For a real example of the Samara's region, the perfect shares are shown in Table
Table
Thus, the actual share of large municipalities in 2018 is 83.26% (Table
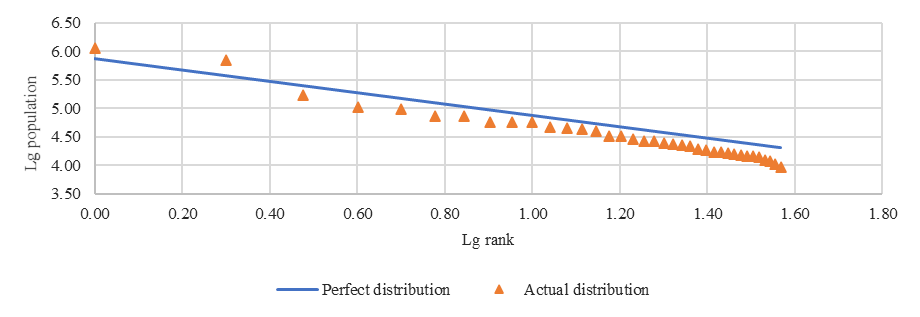
From Figure
Figure
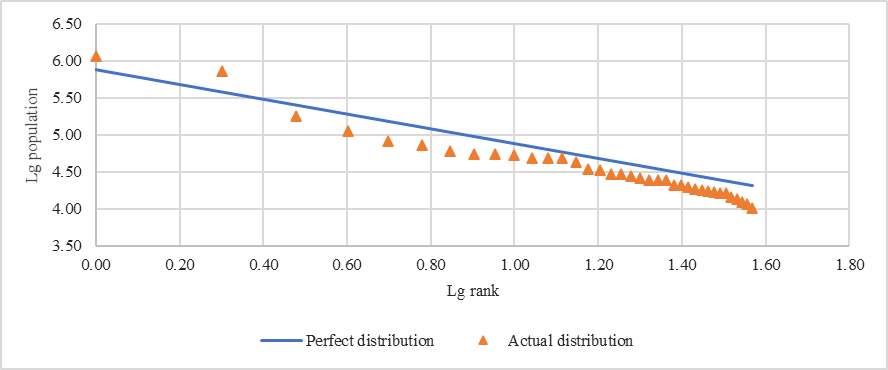
We apply formula (2) to find the parameters of the regression equation that reflects the population distribution according to Zipf's law for the Samara region (Table
The regression equation is obtained according to the Zipf’s law for 2018 (3):
(3)
The dynamics of the Zipf's coefficient “a” for the period 2010-2018 years shows its growth, which suggests that relatively large municipalities have increased their share in the population. This is consistent with the data in Table
The visual analysis of Figures
The impact of the population distribution system balance on the pace of development of the region
It is necessary to find out whether there is a functional relationship between the balance of the population distribution system and the annual growth rate of GRP per capita in the prices of the previous year. The Zipf coefficient “a” acts as a factor variable, and the rate of change in GRP as the resulting variable (Table
The obtained linear regression equation is shown in formula (4):
(4)
The p-value criterion shows that the equation is significant with a probability of more than 99%. The determination coefficient R2 is 0.81; 81% of the variation in the rate of development depends on the variation of the population distribution system.
There is a negative functional relationship: the greater the imbalance in the population distribution system according to Zipf's law, the lower the growth rate of GRP per capita per year.
Evaluation of the statistical relationship gives similar results: the correlation coefficient “r” is 0.90; the statistical relationship is strong (in the range of 0.7-0.9); with (8-2) = 6 degrees of freedom, the actual value of the correlation exceeds the critical value of 0.834 with a significance level of 99%. The connection is negative: the stronger the unbalanced system, the lower the pace of development of the region.
Conclusion
The analysis showed that the population distribution system of the Samara's region for the period 2010-2018 increased its imbalance in accordance with Zipf's law. The municipalities with high rank have increased their share in the region’s population. However, an increase in population concentration did not lead to the expected effect of agglomeration. On the contrary, the pace of development of the region began to decline. Accordingly, regional policy should take into account that in the context of the intensive development of “growth points” and the achievement of the agglomeration effect, it is important not to upset the balance of the existing population distribution system. The revealed dependence can be explained by the influence of agglomeration diseconomies: pulling an excessive amount of resources into one “growth point” leads to their inefficient use, which can slow down the development of the region. To reduce imbalances in the population distribution system, it is necessary to create comfortable conditions for work and life in medium and small municipalities of the Samara's region. The development of this research is possible by comparing estimates of the balance of the population distribution system according to Zipf’s law with estimates by other theories.
References
- Andreev, V. V., Lukiyanova, V. Y., & Kadyshev, E. N. (2018). Analysis of people territorial distribution in regions of the Volga Federal District on the base of Zipf and Gibrat laws. Applied Econometrics, 48, 97–121. [in Rus.].
- Arshad, S., Hu, S., & Ashraf, B. N. (2019). Zipf’s law, the coherence of the urban system and city size distribution: Evidence from Pakistan. Physica A: Statistical Mechanics and its Applications, 513, 87-103.
- Bee, M., & Riccaboni, M., & Schiavo, S. (2017). Where Gibrat meets Zipf: Scale and scope of French firms. Physica A: Statistical Mechanics and its Applications, 481, 265-275.
- Chauvin, J. P., Glaeser, E., Ma, Y., & Tobio, K. (2017). What is different about urbanization in rich and poor countries? Cities in Brazil, China, India and the United States. Journal of Urban Economics, 98, 17-49.
- Cieslik, A., & Teresiński, J. (2017). Does Zipf’s law hold for Polish cities? Miscellanea Geographica, 20 (4), 5-10.
- Devadoss, S., & Luckstead, J. (2016). Size distribution of U.S. lower tail cities. Physica A: Statistical Mechanics and its Applications, 444, 158-162.
- Farrell, K., & Nijkamp, P. (2019). The evolution of national urban systems in China, Nigeria and India. Journal of Urban Management, 8(3), 408-419.
- Federal State Statistic Service of Russia (2018). Database of indicators of municipalities. As of the beginning of 2018. Retrieved from https://www.gks.ru/storage/mediabank/munst.htm
- Friesen, J., Taubenböck, H., Wurm, M., & Pelz, P. F. (2018). The similar size of slums. Habitat International, 73, 79-88.
- González-Val, R. (2019). The spatial distribution of US cities. Cities, 91, 157-164.
- Government of the Samara's region (2018). Local government. As of the beginning of 2018. Retrieved from https://www.samregion.ru/cities_regions/
- Luckstead, J., & Devadoss, S. (2014). A nonparametric analysis of the growth process of Indian cities. Economics Letters, 124(3), 516-519.
- Pérez-Campuzano, E., Guzmán-Vargas, L., & Angulo-Brown, F. (2015). Distributions of city sizes in Mexico during the 20th century. Chaos, Solitons & Fractals, 73, 64-70.
- Rusanovskiy, V. A., Markov, V. A., & Brovkova, A. V. (2018). Modeling the effects of spatial localization in urban agglomerations of Russia. Ekonomicheskaya Politika, 13(6), 136-163. [in Rus.]. DOI: 10.18288/1994-5124-2018-6-136-163
- Tsekeris, T. (2019). Rank-size distribution of urban employment in labour market areas. Cities, 95, 102472.
- Veneri, P. (2016). City size distribution across the OECD: Does the definition of cities matter? Computers, Environment and Urban Systems, 59, 86-94.
- Zipf, G. K. (1949). Human behavior and the principle of least effort. Cambridge, M.A.: Addison-Wesley Press.
Copyright information

This work is licensed under a Creative Commons Attribution-NonCommercial-NoDerivatives 4.0 International License.
About this article
Publication Date
01 April 2020
Article Doi
eBook ISBN
978-1-80296-081-5
Publisher
European Publisher
Volume
82
Print ISBN (optional)
-
Edition Number
1st Edition
Pages
1-1004
Subjects
Business, innovation, management, management techniques, development studies
Cite this article as:
Pavlov, Y. V. (2020). The Influence Of The Population Distribution System On Regional Development. In V. V. Mantulenko (Ed.), Problems of Enterprise Development: Theory and Practice, vol 82. European Proceedings of Social and Behavioural Sciences (pp. 250-259). European Publisher. https://doi.org/10.15405/epsbs.2020.04.32