
Innovative Development Of Enterprises In Russian Energy Sector To Increase Country’s Competitiveness

Abstract
In the current economic climate the world market is characterized by the entry of new players, fierce competition, the rapid high technology production development, frequent changes in government policies, the need adhere to environmental standards, etc. In order to stay competitive, enterprises of Russian industries should not only maintain their position in the global market, but also develop new ones using “comparative advantages”. This can be done through regular modernization of manufacture using high technology, development and implementation of a competitive product in demand on the world market. Russian energy companies are no exception. Therefore, a study of the innovativeness of energy companies is relevant. This study was conducted on the example of Gazprom. To this end, econometric modeling was carried out based on critical parameters that determine the corporation innovative development level. The calculation had been based on statistics of Gazprom for the period 2000-2018. Through the Eviews10 software package, regression analysis and econometric studies were conducted, linear and exponential models for forecasting the innovative development of the corporation for 2020 were built. The corresponding real indicators of the company were compared with those planned in Innovation Program. The study finds that the innovative evolution of Gazprom is consistent with its Innovative Development Program until 2025. In this connection, it can be concluded that current trends in the innovative development of the corporation indicate an increase in the competitiveness of Gazprom both in the domestic and foreign markets, despite the transition of world industry to level 4.0 and crises.
Keywords: Competitivenessinnovative developmentenergy complexGazprom corporationeconometric modeling
Introduction
The energy facility plays a significant role in Russian economic policy: the share of energy exports in total Russian exports amounted to 53.8% in 2018 (Federal Customs Service of Russia, 2018). The development of the national energy facility for a long time was characterized by an extensive increase in capacities and a hydrocarbon production stockpiling (Sergi, 2018).
The Government of Russia approved the “Energy Strategy of Russia for the period until 2030” in November 2009, while recognizing the inefficiency of the extensive approach to using the potential of the energy complex (Ministry of Energy of Russian Federation, 2018). The document spells out Russia's energy policy: the efficient use of hydrocarbon resources and the potential of the energy facility to improve the quality of life, economic growth, and strengthening competitiveness in the foreign market (Sergi, 2019). And also, promising development directions of the energy facility through increasing the level of innovative performance are presented (Metelnikov, 2017). This should create enabling environment for the further development of the economy, increasing the competitiveness of the industry and the country (Baranova, Shevtsova, & Dmitrieva, 2019).
Problem Statement
Companies associated with the energy sector of the economy should always keep up to date, be competitive, therefore they need to periodically upgrade their facilities and installations, protect the environment, etc. (Balashova, 2015).
Gazprom Corporation is the largest of the Russian energy sector. It accounts for 12% of global and 68% of Russian gas production. The corporation owns 17% of the world and 72% of Russian gas reserves (PJSC Gazprom, 2018a). The main production processes of the corporation include exploration, production, transportation, storage, processing and sale of all types of hydrocarbon resources. Proven and probable reserves (SPE-PRMS) of hydrocarbon resources are estimated at 2.78 bln tons of oil equivalent. The products manufactured by Gazprom are in strong demand both in Russia and abroad.
Gazprom is currently implementing an Innovation Development Program. The Program has become an essential for the effectiveness of the corporation’s innovative development in the context of a challenging geopolitical environment and sanctions restrictions. The Program sets priority goals for innovative development: improving the structure and technological base of the corporation, efficiently using existing and developing new hydrocarbon raw materials, reducing the cost of its production, ensuring labor productivity growth, observing the requirements of ecology and environmental protection in the production process, increasing its safety level, maintaining leading positions in world markets (Baranova, Shevtsova, & Dmitrieva, 2019).
Research Questions
An econometric study was conducted to determine the level of innovative development of Gazprom Corporation and its competitiveness in the world markets. The company statistics from 2000 to 2018 were used as initial data. Through the Eviews10 software package, regression analysis and econometric studies were carried out, and linear and exponential models for forecasting the innovative development of the corporation for 2020 were built. Comparison and assessment of conformity of the company's real indicators with those planned in the Innovation Program.
Purpose of the Study
The purpose of the study is to determine the level of innovative development of the Russian energy industry in the case of Gazprom Corporation, its competitiveness in the domestic and foreign markets. To assess the fulfillment of the tasks set, Gazprom’s key performance indicators (KPIs) were considered: the share of R&D expenditures in the revenue, the level of using innovative technologies, the reduction of greenhouse gas emissions in CO2 equivalent, the limiting workplace accidents, the escalation of the number of patents used and licensing, productivity gains (Babordina, Garanina, Ilyina, & Garanin, 2019). The planned values of the KPI were calculated for each type of the corporation activity.
Therefore, the share of R&D expenses in the revenue of 2016-2025 should be in the range of 0.10-0.20%, and R&D expenses should increase from $121 092 307.69 in 2016 to $130 353 846.15 in 2025, while a large amount of R&D expenses is in the gas business (2016 - $115 769 230.77; 2025 - $121 369 230.77). The reduction in operating costs due to the introduction of innovative technologies will be 3-5% for 2016-2025, the planned increase in productivity gains will be 25.8% for 2016-2025, the number of patents used and licenses should increase by an average of 12 units annually (from 408 in 2016 to 516 in 2025) (PJSC Gazprom, 2018b). Achieving the planned indicators and their comparison with the indicators of foreign competing companies will determine the success of the Gazprom Innovation Development Strategy implementation.
Research Methods
Linear Calculation Model of the R&D
A linear model for description of influence of several internal and external factors on the level of Gazprom’s innovative development should be construct (Babordina, Garanina, Ilyina, & Garanin, 2019). The indicator that determines the level of innovative development of Gazprom (R&D costs) should adopt as the endogenous variable Y (R_D). And these factors as exogenous variables: the company's market capitalization - X1(CAP); expenses for environmental protection - X2(NATURE) (PJSC Gazprom, 2018а); sales revenue - X3(REVENUE) (PJSC Gazprom, 2011, 2018c.). Modeling will be conducted using the Eviews10 program according to statistical data for 2000-2018 (n = 19).
A relationship was established between X1, X2, X3 and Y (R_D) using the methods of correlation analysis in order to calculate the coefficients of the linear equation model and evaluate the parameters of the constructed equation. A close relationship was established between the factors Y (R_D) and NATURE (ryx2 = 0.67), REVENUE (ryx3 = 0.78), X2 and X3 (rx2x3 = 0.89) through the pair correlation matrix. The calculation of the coefficients of the linear model and the necessary estimates through the Eviews10 software package are illustrated in figure
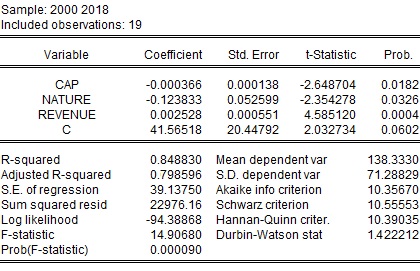
The desired equation is significant (Fstat = 14.9; p-value = 0.000). Determination coefficient R2 = 0.85, i.e. 84.8% of the total variation of the variable Y (R_D) is explained by the variation of the variables X1, X2, X3. That is, the obtained regression model is adequate.
The significance of the desired equation and coefficient estimates allow to write this equation and use it to analyze the relationship of the variables under review.
R_D ^ = 41.57-0,000366*X1(CAP) - 0.12833*X2(NATURE) + 0.002528*X3(REVENUE)(1)
It is possible to interpret the values obtained of the regression coefficients as follows, ceteris paribus, an increase in the indicator: 1) market capitalization (CAP) on average reduces R_D by $366 per year; 2) the environmental costs (NATURE) on average reduces R_D by $128.33 thousand per year; 3) sales revenue (REVENUE) on average increases R_D by $2.53 thousand per year. The absolute term C of the equation shows that R_D is equal to $41.57 mln at zero values of the coefficients for independent variables.
T-statistics of each variable and their corresponding p-values make it possible to use these components for further analysis (Fig. 1). Therefore, the estimated values are reliable for assessing the forecast of the future model. The calculated values of Y(R_D)^ on average approximate well the dependence of Y (R_D) on X1, X2, X3.
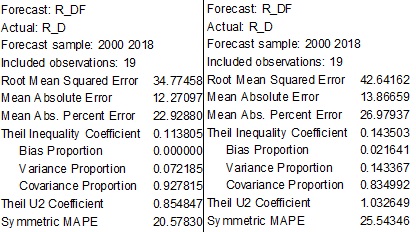
The residuals of equation (1), according to Jacques-Bera statistics, have an average value that is practically zero (Mean=-1,12е-14) and have normal distribution (0.16), and the probability of accepting the null hypothesis Н0 is 95% (P-value = 0.95).
The Theil coefficient (0<0.11<1) and the mean absolute percent error of the equation (12.27%) indicate a high accuracy of the obtained model. Therefore, the desired model can be used to calculate the predicted R_D ^.
Exponential Calculation Model of the R&D
Nonlinear models are believed to be better than linear ones for evaluating many economic processes. Through the Eviews10 program, an exponential model of the relationship between Y(R_D), X1(CAP), X2(NATURE) and X3(REVENUE) was constructed. As it is shown in the figure
log(R_D) = – 5.16 – 0.402*log(CAP) – 0.769*log(NATURE) + 1.726*log(REVENUE) (2)
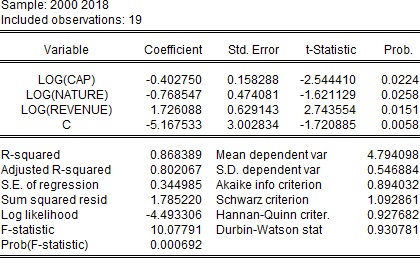
The extracted equation (Fstat = 10.08, p-value = 0.000) and all the coefficients X1, X2, X3 (t-statistics of each variable and the corresponding p-values are significant) are adequate (figure
It is possible to interpret the values obtained as follows, while holding other factors constant, the coefficient increases at the variable: 1) log(CAP) by 1%, the innovation costs will fall by 0.40%; 2) log(NATURE) by 1% the innovation costs will fall by 0.77%; 3) log(REVENUE) by 1% the innovation costs will increase by 1.77%. The absolute term C of the equation has no meaningful definition, since it cannot be negative.
Figure
A White test was performed to check the residuals for homogeneity, in which the null hypothesis H0 about the lack of heteroskedasticity is tested without any additional assumptions regarding its structure. The results of Figure
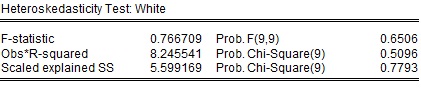
The Darbin-Watson (DW) test for the presence or absence of autocorrelation of residues verifies the adequacy of the model. It follows from the evaluation of the equations (Figures
The values of the independent variables for 2018 are already known. It is assumed that environmental costs would remain unchanged, sales revenue will increase by 10% compared with the previous period, and the market capitalization will practically remain unchanged in 2019.
Thus, according to calculations (figure
Findings
As a result of the study, it was found:
1. The exponential model built to predict the level of Gazprom’s innovative development is adequate and can be used for the R&D calculations in the short term. It is possible to build linear or exponential forecasts for the development of Gazprom’s innovative activity by changing or adding exogenous variables.
2. The results of the study get to be in the planned range of the Strategy. Consequently, the innovative development of Gazprom, despite the unforeseen circumstances and crises, falls within Innovative Development Program until 2025.
3. A positive assessment of the innovative development level of Gazprom, the largest energy sector in Russia, indicates the effectiveness of the long-term energy Strategy. This reflects an increase in the competitiveness of the corporation, both in the Russian and international markets, and, therefore, the competitiveness of the Russian economy as a whole (PJSC Gazprom, 2017).
Conclusion
The calculated results obtained as a result of applying model (2) correspond to the projections of the Gazprom Innovation Development Program until 2025 (Gazprom program until 2025, 2018). The planned share of R&D costs in revenue will be 0.10-0.20% (this share was 0.15% and 0.16%, for 2019-2020 respectively). For the study period (2000-2018) the share of R&D expenditures in revenue also varied in this range, since 2008.
The data obtained shows if corporations in the energy sector comply with all the directions of the Innovation Development Program, the industry will always be competitive, despite global shocks (Pilipenko & Pilipenko, 2018).
Acknowledgments
The publication has been prepared with the support of the RUDN University Program 5-100.
References
- Babordina, O. A., Garanina, M. P., Ilyina, L. A., & Garanin, P. A. (2019). Formation of the business model of oil producing enterprises. In V. Mantulenko (Ed.), Proceedings of International Scientific Conference "Global Challenges and Prospects of the Modern Economic Development". The European Proceedings of Social & Behavioural Sciences, 57. (pp. 230-238). London: Future Academy. https://doi.org/10.15405/epsbs.2019.03.24
- Balashova, S. A. (2015). The impact of public R&D policy on business-funded R&D (case of OECD countries). Applied Econometrics, 38(2), 64-82. [in Rus].
- Baranova, N. M., Shevtsova, N. A., & Dmitrieva, E. G. (2019). Industrial policy as a tool of restructuring the Russian economy. In V. Mantulenko (Ed.), International Scientific Conference "Global Challenges and Prospects of the Modern Economic Development". The European Proceedings of Social & Behavioural Sciences, 57. (pp. 1877-1887). London: Future Academy. https://doi.org/10.15405/epsbs.2019.03.191
- Federal Customs Service of Russia (2018). Export from Russia. Retrieved from: https://ru-stat.com/date-M201801-201812/RU/export/world Accessed: 20.09.2019 [in Rus].
- Metelnikov, A. (2017). Innovations in electrical engineering and energy. In T. Aslanov (Ed.), Electrical Market, 2(46), 6-20. Retrieved from: https://marketelectro.ru/sites/default/files/informacionnyy_blok_0.pdf Accessed: 20.08.2019. [in Rus.].
- Ministry of Energy of Russian Federation (2018). Energy strategy of Russia until 2030. Retrieved from: https://minenergo.gov.ru/node/1026 Accessed: 20.08.2019. [in Rus.].
- Pilipenko, A., & Pilipenko, Z. (2018). Shocks in global economy: Impulse model ofmacroeconomic cycle. In S. Bruno, M. Ziolo (Eds.), Regaining Global Stability After the Financial Crisis (pp. 238-256). Pennsylvania, USA: IGI Global.
- PJSC Gazprom (2011). Gazprom reference figures 2007-2011. Retrieved from: http://www.gazprom.ru/f/posts/04/556263/gazprom-reference-figures-2007-2011-rus.pdf Accessed: 20.08.2019. [in Rus.].
- PJSC Gazprom (2017). Gazprom Sustainability Report. Retrieved from: http://www.gazprom.ru/f/posts/57/287721/sustainability-report-rus-2017.pdf Accessed: 05.09.2019. [in Rus.].
- PJSC Gazprom (2018а). PJSC Gazprom environmental report. Retrieved from: https://www.gazprom.com/f/posts/67/776998/gazprom-environmental-report-2018-en.pdf Accessed: 20.08.2019. [in Rus.].
- PJSC Gazprom (2018b). Gazprom innovation development program until 2025. Retrieved from: https://www.gazprom.ru/f/posts/97/653302/prir-passport-2018-2025.pdf Accessed: 20.08.2019. [in Rus.].
- PJSC Gazprom (2018c). Gazprom reference figures 2014-2018. Retrieved from: https://www.gazprom.ru/f/posts/01/851439/gazprom-annual-report-2018-ru.pdf Accessed: 20.09.2019. [in Rus.].
- Sergi, B. S. (Ed.). (2018). Exploring the future of Russia’s economy and markets: Towards sustainable economic development. Bingley: Emerald Publishing Limited.
- Sergi, B. S. (Ed.). (2019). Modeling economic growth in contemporary Russia. Harvard University, USA: Emerald Publishing Limited.
Copyright information

This work is licensed under a Creative Commons Attribution-NonCommercial-NoDerivatives 4.0 International License.
About this article
Publication Date
09 March 2020
Article Doi
eBook ISBN
978-1-80296-078-5
Publisher
European Publisher
Volume
79
Print ISBN (optional)
-
Edition Number
1st Edition
Pages
1-1576
Subjects
Business, business ethics, social responsibility, innovation, ethical issues, scientific developments, technological developments
Cite this article as:
Baranova*, N. M., & Loginova, D. S. (2020). Innovative Development Of Enterprises In Russian Energy Sector To Increase Country’s Competitiveness. In S. I. Ashmarina, & V. V. Mantulenko (Eds.), Global Challenges and Prospects of the Modern Economic Development, vol 79. European Proceedings of Social and Behavioural Sciences (pp. 606-613). European Publisher. https://doi.org/10.15405/epsbs.2020.03.87