
Regional Differentiation Of Unemployment Rate In The Russian Federation: Econometric Analysis

Abstract
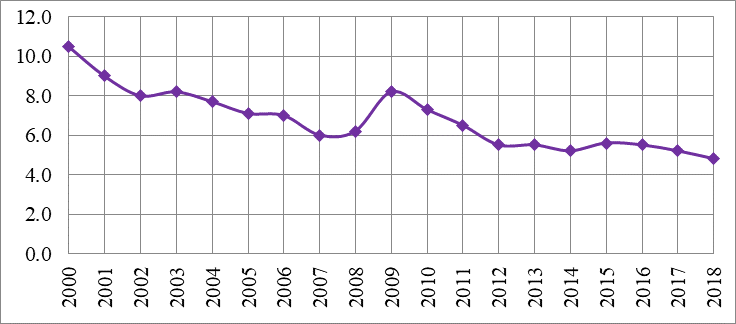
The solution to unemployment problem is a prerequisite to providing proper living standards for population of any country. Researching and forecasting the unemployment rate is an urgent issue for Russia and its socio-economic development. This paper presents the findings on econometric research of the Russian unemployment rate and its regional differentiation. The factors that determine the unemployment rate in the RF regions are determined and the forecast is made. The unemployment rate time series for the period from 2000 to 2018 was taken for analysis and forecasting. For the 19 years under study the unemployment rate became more than two times less. Based on the time series analysis and to forecast the unemployment rate the model ARIMA (1, 1, 0) was constructed. The unemployment rate projected value for 2019 is 4,5% in this model. Then a set of indicators was analyzed to construct multifactor econometric model. The following indicators were selected as explanatory variables: the number of small enterprises; population with the income below the subsistence level; the number of internally displaced persons (IDPs); and the number of the Internet users. An econometric model of the dependence of the unemployment rate on selected indicators is statistically significant and has a high explanatory ability. The model is constructed for the RF regions and could be applied to analyze and forecast the labor market.
Keywords: Unemployment levelregionseconometric modelforecast
Introduction
Currently, any state sets providing proper standard of living as one of its major priorities. While studying living standards researchers analyze, assess, model and forecast various socio-economic processes, including unemployment.
The unemployment rate is one of the indicators that characterize the standard of living of the country's population, stability, and the efficiency of reforms (Luo & Shang, 2016). The Russian labor market has a number of distinctive features: a low level of industrial development (a large number of industrial enterprises are liquidated or idle); the influx of a large number of refugees into the country; the problem of hidden unemployment; the formal boundaries between official and shadow employment; insufficient unemployment benefits (Frantzuzova, 2014; Lipatova & Abaeva, 2015).
In addition Russian unemployment is characterized by the large number of regions that differ in area, natural resources, population, climatic conditions, and different levels of industry, agriculture and tourism development. Aggravation of the regional unemployment problem can lead to serious consequences, namely lower living standards, increased social tension, crime, worsening migration situation, regional conflicts, etc. (Pereira, Turkman, & Correia, 2018).
Unemployment itself and its research and forecasting remain an urgent global problem. In Russia this topic is of high interest at the moment due to the new pension reform implementation and the increase in the retirement age.
Modern science offers a variety of approaches and methods to the study and forecasting of unemployment using temporal (Voineagu, Pisica, & Caragea, 2012; Dumičić, Žmuk, & Časni, 2017; Stasinakis, Sermpinis, Theofilatos, & Karathanasopoulos, 2016) or spatial (Bakanach & Proskurina, 2016; Brozek & Kogut, 2016) data. This paper presents an econometric study of the unemployment rate both in time (analysis of dynamics, forecast) and in space (study of regional unemployment, its differentiation, identification of factors that determine the unemployment rate in the regions of the Russian Federation).
Problem Statement
This research therefore set out to study the RF unemployment rate in two ways. The first objective is to analyze the unemployment rate from 2000 to 2018 and identify an econometric model that fits the time series forecast for this indicator. The second task is to model the unemployment rate correlation with various socio-economic indicators of the RF regions development and to analyze the ways these indicators influence the unemployment rate.
Research Questions
Thus this research attempts to answer the following questions: How has the unemployment rate in Russia changed over the past 19 years? What are the statistical properties of the unemployment rate time series? How to describe and predict the unemployment rate in Russia using econometric modeling? What socio-economic factors influence the unemployment rate in the regions of the Russian Federation?
Purpose of the Study
This study was designed to analyze the dynamics of changes in unemployment over the past 19 years. This paper also forecasts the unemployment rate for 2019, based on the best econometric model of the time series. Another important objective was to conduct an econometric analysis of the unemployment rate in the Russian Federation taking into account regional differentiation. The factors that determine the level of regional unemployment need to be identified in the course of this study.
Research Methods
This study uses the combination of methods, namely methods of statistical analysis, econometric modeling of time series and spatial data. The time series of the unemployment rate in the Russian Federation was studied in the annual dynamics for the period from 2000 to 2018 (Federal Service of State Statistics, 2019). Also, a system of indicators was formed to build an econometric model of the unemployment rate in the regions of the Russian Federation (Federal Service of State Statistics, 2018). The system includes indicators characterizing the level of economic and social development of the region, migration processes in the region, and development of information and communication technologies indicators. The sample size was 85 observations on 20 indicators. Excel and Gretl programs were applied to the analysis and processing the statistical data.
Findings
Dynamics analysis and unemployment forecast
The time series of the unemployment rate (selected as a dependent variable
The following properties for unemployment rate time series were revealed (Sukhanova & Shirnaeva, 2015): the series is unsteady at the initial levels (according to the results of the Dickey and Fuller test (
Table
The forecast on the unemployment rate or 2019 was made on the basis of the constructed econometric model. The projected value was . According to interval forecast the unemployment rate will range from 3,0% to 5,9% with reliability of 95%.
Econometric modeling of unemployment rate in the RF regions
The Russian unemployment rate is characterized by high regional differentiation. For example the regions with a favorable situation on the labor market have an unemployment rate of 1,2–1,4% (Moscow, St. Petersburg, Chukotka Autonomous Okrug). Among regions with a high unemployment rate, its values reach 14–16% (Karachay-Cherkess Republic, Tuva Republic) and even 26% (Ingushetia Republic). An econometric modeling of the unemployment rate in the regions of the Russian Federation will make it possible to identify the indicators affecting this variable (
The multicollinearity aspect of the variables in question was investigated at the stage of selection of the most informative variables into the econometric model. After analyzing the matrix of paired correlation coefficients, the following indicators were included in the set of explanatory variables:
Ordinary least spreads method was used to estimate the parameters of the model. The results are shown in Table
Thus, according to 2018 data the model for unemployment rate looks the following way:
. (3)
According to the modeling results, the parameter estimate for the variable
Thus, after the elimination of heteroscedasticity the final model is as follows:
(4)
The model (4) and the model estimates are statistically significant at a 5% level of significance. The determination coefficient
As it can be seen from the model (4) an increase in the number of small enterprises by 1 thousand follows by the decrease in the unemployment rate on average by 0,004%; if the population with incomes below the subsistence level increases by 1%, then the unemployment rate increases by an average of 0,33%; and with an increase in the number of IDPs by 1 person the unemployment rate will increase by an average of 0,001%; increase in the Internet users by 1% will lead to a decrease in unemployment by an average of 0,09%.
Thus, to regulate the level of unemployment in the regions of the Russian Federation, the state needs to create favorable conditions for increasing small businesses, which contributes to the creation of new jobs. Accessibility of the Internet can also help reduce unemployment, as it entails an increase in the number of self-employed and people working remotely. A wise state migration policy and an effective fight against poverty also could lead to a decrease in unemployment.
Conclusion
The most obvious finding to emerge from this study is that the unemployment rate in Russia has decreased by more than 2 times for the period from 2000 to 2018. Another important result was the forecast made for the unemployment rate. In accordance with the properties of this indicator’s time series, the ARIMA model (1.1.0) was built. Using the constructed model, a point (4,5%) and interval (3,0% -5,9%) forecast of the unemployment rate for 2019 was made.
The analysis of the impact of various socio-economic indicators on the unemployment rate in the regions of the Russian Federation is carried out for 2018. The constructed multifactor econometric model is statistically significant, has a high explanatory ability and statistically significant parameter estimates. According to the results of econometric modeling, the level of regional unemployment in the Russian Federation in 2018 is characterized by a dependence on factors of small business development, the Internet access, the migration in the country, and the population with income below the subsistence level.
References
- Bakanach, O. V., & Proskurina, N. V. (2016). Statistical analysis of unemployment in Russian Federal districts. System Management, 2(31), 4. [in Rus.].
- Brozek, K., & Kogut, J. (2016). Econometric analysis of selected unemployment factors in EU countries of different economic level in the years 2006-2014. In I. Simberova, F. Milichovsky, O. Zizlavsky (Eds.), Smart and Efficient Economy - Preparation for the Future Innovative Economy: Proceedings of the 21st International Scientific Conference (pp. 714-722). Brno: Brno Univ Technol, Fac Business & Management.
- Dumičić, K., Žmuk, B., & Časni, A. C. (2017). Evaluating forecasting models for unemployment rates by gender in selected European countries. Interdisciplinary Description of Complex Systems, 15(1), 16-35. https://doi.org/10.7906/indecs.15.1.2
- Federal Service of State Statistics (2018). Regions of Russia. Socio-economic indicators. Retrieved from: https://www.gks.ru/free_doc/doc_2018/region/reg-pok18.pdf Accessed: 10.09.2019. [in Rus.].
- Federal Service of State Statistics (2019). Short-Term Economic Indicators of the Russian Federation Retrieved from: http://old.gks.ru/wps/wcm/connect/rosstat_main/rosstat/ru/statistics/publications/catalog/doc_1140080765391 Accessed: 30.08.2019. [in Rus.].
- Frantzuzova, T. A. (2014). Contemporary labor market in the Russian Federation. Young Scholar, 3(62), 572-575. [in Rus.].
- Lipatova, L. N., & Abaeva, E. I. (2015). The current state of labor market in Russia. Bulletin of the Volga University named after V.N. Tatishchev, 3(34), 98-108. [in Rus.].
- Luo, J., & Shang, J. (2016). Exploratory data analysis on unemployment rates in USA. Advances and Application in Statistics, 48(4), 303-316. https://doi.org/10.17654/AS048040303
- Pereira, S., Turkman, F., & Correia, L. (2018). Statio-temporal analysis of regional unemployment rates: A comparison of model based approaches. Revstat –Statistical Journal, 16(4), 515-536.
- Stasinakis, C., Sermpinis, G., Theofilatos, K., & Karathanasopoulos, A. (2016). Forecasting US unemployment with radial basis neural networks, Kalman filters and support vector regressions. Computational Economics, 47(4), 569-587. https://doi.org/ 10.1007/s10614-014-9479-y
- Sukhanova, E. I., & Shirnaeva, S. Y. (2015). Different approaches to macroeconomic processes simulation and forecasting. Fundamental Research, 12-2, 406-411. [in Rus.].
- Sukhanova, E. I., & Shirnaeva, S. Y. (2016). Prediction unemployment rate: econometric approach. 21st Century Science: Current Trends, 1-2, 226-231. [in Rus.].
- Sukhanova, E. I., Shirnaeva, S. Y., & Mokronosov, A. G. (2016). Econometric models for forecasting of macroeconomic indices. International Journal of Environmental and Science Education, 11(16), 9191-9205.
- Voineagu, V., Pisica, S., & Caragea, N. (2012). Forecasting monthly unemployment by econometric smoothing techniques. Economic Computation and Economic Cybernetics Studies and Research, 3, 255-267.
- Zaychikova, N. A., Sukhanova, E. I., & Shirnaeva, S. Y. (2019). Econometric modeling of external migration. In V. Mantulenko (Ed.), Proceedings of GCPMED 2018 – International Scientific Conference "Global Challenges and Prospects of the Modern Economic Development". The European Proceedings of Social & Behavioural Sciences EpSBS, LVII (pp. 1097-1107). London: Future Academy. https://doi.org/10.15405/epsbs.2019.03.110
Copyright information

This work is licensed under a Creative Commons Attribution-NonCommercial-NoDerivatives 4.0 International License.
About this article
Publication Date
09 March 2020
Article Doi
eBook ISBN
978-1-80296-078-5
Publisher
European Publisher
Volume
79
Print ISBN (optional)
-
Edition Number
1st Edition
Pages
1-1576
Subjects
Business, business ethics, social responsibility, innovation, ethical issues, scientific developments, technological developments
Cite this article as:
Shirnaeva*, S. Y., Sukhanova, E. I., & Repina, E. G. (2020). Regional Differentiation Of Unemployment Rate In The Russian Federation: Econometric Analysis. In S. I. Ashmarina, & V. V. Mantulenko (Eds.), Global Challenges and Prospects of the Modern Economic Development, vol 79. European Proceedings of Social and Behavioural Sciences (pp. 563-569). European Publisher. https://doi.org/10.15405/epsbs.2020.03.81