
Cyclicity In Russian Regional Economy Sectors: Models And Results

Abstract
The article presents methods and models for each of 12 important economic sectors in 78 Russian regions. We designed a procedure for parametric time series modelling including time series decomposition, deseasonalization, seven trend modes and cycles modelling as a sum of three harmonics. The procedure was realized as a program using R language. Evaluations were based on open operational (monthly) data provided by the Russian Federal State Statistic Service. The data included the most significant economic sectors for sustainable development of the Russian regions. As for the time period the time series cover such important facts as the world economic crisis in 2008 and imposition of sanctions against Russia in 2014. As a result of modelling we obtained evaluations for trend models, both additive and multiplicative seasonal coefficients and aperiodic cycle components. This allowed us to identify cycles peaks and bottoms dates during the 2005-2017 period as well as the current cycles stages and forecast for the next period. We compared the cycles among all the regions and defined generalised cycles for the Russia as a whole. The comparison allowed to identify such characteristics as pro-cyclicity, auto-cyclicity and counter-cyclicity of the regional economy, as well as to determine general patterns for industries in Russia as a whole.
Keywords: Modellingcyclesregional economyeconomic sectorsRussia
Introduction
This study is aimed to model and evaluate numerical characteristics of business cycles in the Russian regions economies by the main important economic sectors. The study is based on the available open statistics on monthly operational data. The modeling for each region and for each sector includes next steps: choosing the model structure, identification the model parameters, model validation quantitative estimation of the cyclic component, determination the current stage of the cycle and forecasting the next business cycle period. The authors also compare the results of modeling between different regions and Russia as a whole in order to identify common patterns of regional economic cycles.
Problem Statement
A fairly broad overview of the identification methods and evaluation of the regional economy dynamics including economic cycles is given in (Škare & Stjepanović, 2015). In general, the research methods of cyclicity can be divided into nonparametric, focused on the identification of "turning points" of cycles by one or a set of indicators, and parametric, aimed at building mathematical models with the ability to predict and assess the level of the cycle at an arbitrary point.
A significant number of aticles are devoted to regional cycles in Europe, where regions are understood as individual countries belonging to the European Union or the Eurozone, and also the US States and Chinese provinces. Recent studies include (Bandrés, Rivas, & Gómez-Loscos, 2017; Koopman, Lit, & Lucas, 2016; Ahlborn & Wortmann, 2018; Gong & Kim, 2018). Researchers discovered an internal synchronicity between regional cycles, as well as a link between regional and global cycles.
At the same time, for the Russian regions, such studies have not been performed so far. The question of the applicability of well-known cyclical indicators (such as ISM index, PMI, LII, ZEW) to the Russian economy remains open. Thus, the authors aimed their study on developing parametric tools for modeling of the regional economy dynamics, that would include the assessment of cyclicity and would be adequate to the available data on the economic sectors in the regions of Russia.
Research Questions
First of all, for the purposes of the study it was necessary to select for modeling the most significant sectors of the economy for which operational statistics are available for a sufficient period of time. The authors considered the monthly data of operational statistics from 2005 to 2017. This period covers important periods and milestones in the evolution of the Russian economy: economic growth in the zero years of the XXI century, the crisis of 2008-2009, the subsequent recession and recovery, sanctions and the following period. The inclusion of the 2008-2009 crisis will allow, on the one hand, to check the adequacy of the models, on the other – to compare the scale of fluctuations associated with the global crisis and the imposition of sanctions. But a bunch of questions remains open: to what extent these global cycles have affected individual industries and regions, whether economic fluctuations in different regions are synchronous, whether local cycles occur in individual regions.
While determine economic sectors for modeling the authors considered the importance of both minerals extraction and manufacturing industries. Special attention was paid to perspective manufacturing branches such as electronics and chemistry. Retail trade and building are also important parts of each region economy. As a result, the industries presented in table
Forecasting future cycles is of the greatest practical importance for management. This will make it possible to develop adequate management decisions, assess the state of specific industries and develop measures to compensate for the negative impact of Cycling.
Purpose of the Study
The main purpose of the indicators' evolution modeling is construction of models which include unobservable deterministic components of time series. These components are trend Tt, cyclical component Ct and seasonal component St.
The final goals of the study are the following:
identify cycles for each region for which statistics are available;
forecast the next cycle;
identify of common patterns in the cyclicity of individual regions and Russia as a whole.
Research Methods
In this study, in order to estimate the synchronicity of the cycles in different regions, the authors used a parametric approach to the cycles' identification (Pollock, 2009) with accordance to a fundamental article on cycles modeling (Slutszky, 1937).
All calculations for the identification and models' selection are performed in the program developed by the authors in the R language, using both their own modules and provided packages for the implementation of known methods.
The structure of time series can be quite diverse depending of the possible composition of time series components. However, two main structures were chosen with accordance to the considered indicators' characteristics and the modeling tools. These structures are the following:
additive structure:
additive-multiplicative structure where seasonal component is proportional to trend and long cycles:
The first one represents irrespective dynamics of each component while the second structure determines interaction of seasonal fluctuations and long-term components.
To model the trend seven models with different types of dynamics were used. More detailed features of these and other models proposed by the authors in form of atlas in (Semenychev, Korobetskaya, & Kozhukhova, 2015).
– linear trend:
– generalised power trend:
– generalised exponential trend:
– generalised Verhulst logistic curve (sigmoid):
– generalised arctangent:
– generalised Gussian distribution:
– new model of bellshaped trend as rational function multiplied by cumulative Verhulst logist for bell asymmetry (Semenychev, Kurkin, & Semenychev, 2014):
The term generalized supposes additive constant C0 included in the models. Thus, the trend pool includes a linear model, nonlinear growth models with different rates, S-shaped and bell-shaped curves with and without asymmetry.
The sum of three harmonics with non-multiple frequencies was used to model the cycles, which allows us to describe complex, non-strict periodic (or aperiodic) cycles which is typical for economic cycles. It is possible to sum up a larger number of periodic functions, but, as practice has shown, it is impractical in most cases. Thus, the authors tried to calculate models with four, five and six harmonics on the analyzed data. The use of more complex techniques was also considered inappropriate (Semenychev, Kurkin, Semenychev, & Danilova, 2017). Trend and cycles were identified iteratively to improve the identification accuracy.
Seasonal coefficients were estimated using the classical time series decomposition algorithm by preliminary removal of the trend and cyclic fluctuations using smoothing (moving averages and LOESS algorithm) and averaging the levels of fluctuations for the same months. The corresponding algorithms are implemented in the standard stats package of the R language. For each series, both multiplicative and additive oscillations were estimated, and then the best to reduce 12 autocorrelations was selected.
Findings
As a result of computations for each region and each indicator were obtained the following data: trend, cycles and seasonal models and quantitative evaluations, the share of models of used trends among all the regions, confidence intervals of cycles and seasonal fluctuations, dates and forecasts of cycles peaks, bottoms, their periods lengths, the current stages of the cycles. The consistency of cyclic fluctuations for regions and Russia is also estimated.
Using the models for each economic sector we have built plots similar to the one shown on Fig.
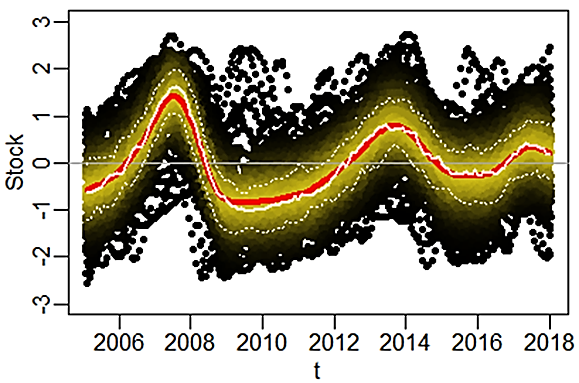
Source: authors (developed using R).
Average cycle periods for each region were also estimated. Note that most indicators are characterized by short Kitchen cycles of 2-3 years, superimposed on longer 5-6-year cycles. The exception is the dynamics of prices with cycles of 7-8 year periods and retail stocks with 4-6 year periods. The downturn in the construction industry trend observed for most regions may be part of a longer-than-sample Kuznets cycle. In 2018-2019, most regions go through the bottom of the construction and consumer price cycles. The bottom of the retail inventory cycle in most regions is taking place later, closer to 2020.
Comparing the cycles levels of different regions and the average cycles' levels, the Russian regions were grouped into three categories:
pro-cyclic;
counter-cyclic;
auto-cyclic.
The term auto-cyclic implies autonomy (weak correspondence to cycles in the other regions). In other words, in auto-cyclic regions cycles depend more on internal factors than on external factors common to the whole country.
Counter-cyclic regions have the opposite dynamics to the rest of the regions: when in most regions a peak of a cycle takes place, the counter-cyclic region is close to the bottom, and vice versa. The cycles of pro-cyclic regions correlate with those of the country as a whole. Pro-cyclic regions can be characterized as "cycle-generating," and counter-cyclic as the "cycle-compensating".
The Price indicator is Pro-cyclical for all regions. The dynamics of retail stocks is also highly consistent: only three regions (the Republic of Adygea, the Khanty-Mansiysk Autonomous Okrug – Yugra and the Tyumen region) are counter-cyclic and 17 regions are auto-cyclic, including Moscow and the Belgorod region.
As for the Building indicator more than half of the regions are pro-cyclic. Comparing the plots and correlation levels, we can assume that the greatest consistency of dynamics is manifested at the beginning and at the end of the sample, i.e. as a reaction to the global crisis and the imposition of sanctions. And in the "quiet" period between 2010 and 2014, construction cycles depend more on the local conditions in each region.
Cycles for Extraction and Manufacturing indicators are the least consistent across regions. The share of auto-cyclic regions in the chemical industry, production of rubber and plastics, production of medicines is particularly high. In manufacturing, more than half of the regions are pro-cyclic.
Comparing the dynamics coherence of each region according to various indicators, we note that some regions are pro-cyclic for most of the indicators. These regions are Altai Krai, Republic of Altai, Bryansk oblast, Ryazan oblast, Smolensk oblast, Jewish Autonomous oblast. Pskov and Samara regions are counter-cyclic by Extraction indicator, but pro-cyclic for other sectors. The Chukotka Autonomous Okrug is a region that is counter-cyclic by most indicators. Detailed results of modeling could be found in the authors' preprint (Semenychev & Korobetskaya, 2019).
Conclusion
Thus, in the course of the study, a methodology was developed and detailed estimates were obtained for models and forecasts of cyclic fluctuations of the most important sectors of the economy in the regions of Russia. Trends and seasonal fluctuations were also assessed. Comparison of the results obtained for individual regions allowed to identify such characteristics as pro-cyclicity, auto-cyclicity and counter-cyclicity of the regional economy, as well as to determine general patterns for industries in Russia as a whole.
In contrast to traditional methods of economic cycles dating, the developed technique allows to build multicomponent models, to separate the long-term trend and medium-term and short-term cyclical fluctuations, as well as to evaluate seasonality. In addition, the tools allow to make forecasts of the dynamics as a whole and for individual components of the series and to forecast peaks and bottoms of future cycles.
References
- Ahlborn, M., & Wortmann, M. (2018). The core-periphery pattern of European business cycles: A fuzzy clustering approach. Journal of Macroeconomics, 55, 12-27. https://doi.org/10.1016/j.jmacro.2017.08.002
- Bandrés, E., Rivas, M. D. G., & Gómez-Loscos, A. (2017). Regional business cycles across Europe. Banco de Espana Occasional Paper, 1702. https://doi.org/10.2139/ssrn.2900138
- EMISS (2019). Production index (operational data) (OKVED2). Retrieved from: https://www.fedstat.ru/indicator/57806/ Accessed: 01.04.2019. [in Rus.].
- Gong, C., & Kim, S. (2018). Regional business cycle synchronization in emerging and developing countries: Regional or global integration? Trade or financial integration? Journal of International Money and Finance, 84, 42-52. https://doi.org/10.1016/j.jimonfin.2018.02.006
- Koopman, S. J., Lit, R., & Lucas, A. (2016). Model-based business cycle and financial cycle decomposition for Europe and the United States. Retrieved from: https://papers.tinbergen.nl/16051.pdf Accessed: 06.12.2019.
- Pollock, D. S. G. (2009). Investigating economic trends and cycles. In Mills T.C., Patterson K. (Eds.), Palgrave Handbook of Econometrics (pp. 243-307). London: Palgrave Macmillan. https://doi.org/10.1057/9780230244405_6
- Semenychev, V., & Korobetskaya, A. (2019). Multimodel estimation for innovative development of 78 Russian Regions using leading indicators during 2005-2017. SSRN Electronic Journal. https://doi.org/10.2139/ssrn.3373579 [in Rus.].
- Semenychev, V. K., Korobetskaya, A. A., & Kozhukhova, V. N. (2015). Proposals of econometric tools for modeling and forecasting evolutionary processes: monograph. Samara, Russia: SAGMU. [in Rus.].
- Semenychev, V. K., Kurkin, E. I., & Semenychev, E. V. (2014). Modelling and forecasting the trends of life cycle in the production of non-renewable resources. Energy, 75(C), 244-251. https://doi.org/10.1016/j.energy.2014.07.063
- Semenychev, V. K., Kurkin, E. I., Semenychev, E. V., & Danilova, A. A. (2017). Multimodel forecasting of non-renewable resources production. Energy, 130, 448-460. https://doi.org/10.1016/j.energy.2017.04.098
- Škare, M., & Stjepanović, S. (2015). Measuring business cycles: A review. Contemporary Economics, 10(1), 83-94. https://doi.org/10.5709/ce.1897-9254.200
- Slutszky, E. (1937). The summation of random causes as the source of cyclical processes. Econometrica, 5(2), 105-146. https://doi.org/10.2307/1907241
Copyright information

This work is licensed under a Creative Commons Attribution-NonCommercial-NoDerivatives 4.0 International License.
About this article
Publication Date
09 March 2020
Article Doi
eBook ISBN
978-1-80296-078-5
Publisher
European Publisher
Volume
79
Print ISBN (optional)
-
Edition Number
1st Edition
Pages
1-1576
Subjects
Business, business ethics, social responsibility, innovation, ethical issues, scientific developments, technological developments
Cite this article as:
Korobetskaya*, A., Semenychev, V., & Semenychev, E. (2020). Cyclicity In Russian Regional Economy Sectors: Models And Results. In S. I. Ashmarina, & V. V. Mantulenko (Eds.), Global Challenges and Prospects of the Modern Economic Development, vol 79. European Proceedings of Social and Behavioural Sciences (pp. 512-518). European Publisher. https://doi.org/10.15405/epsbs.2020.03.74