
Adaptive Forecasting Model Of The Number Of Marriages In Samara Region

Abstract
In the analysis of socio - economic systems and processes, a priori information on quantitative patterns inherent in causal relationships between economic indicators necessary for the formation of models is often missing. One of the important demographic indicators is the number of marriages concluded. The number of marriages concluded by months shows a pronounced seasonality. The paper considers adaptive predictive models of the number of marriages in Samara region. The paper proposes an adaptive seasonal model. As a learning algorithm, the recursive least squares method with forgetting coefficients is used. It is shown that the forecast can be explained on the basis of a three-parameter autoregressive model. The undoubted advantage of the resulting model is the ability to build an accurate forecast for the year ahead on a monthly basis. Test cases showed the advantage of an adaptive forecasting model based on autoregression. The construction of the model according to the SARIMA methodology (seasonal autoregressive integrated moving average) confirmed the single root hypothesis. However, taking the seasonal first difference does not allow constructing, it does not allow constructing a high-quality autoregressive model of residues. This fact may indicate the presence of a long memory in the time series. In the future, it is planned to create a model based on autoregression with fractional order differences.
Keywords: Recursive least squarefractional calculusestimation of parametersfractional white noise
Introduction
Under the socio-economic system usually understand a complex probabilistic dynamic system, covering the processes of production, exchange, distribution and consumption of material and other goods. The main method for studying socio-economic systems is the modeling method, i.e. a method of theoretical and practical action aimed at the development and use of models.
In the analysis of socio-economic systems and processes, a priori information on quantitative patterns inherent in causal relationships between economic indicators necessary for the formation of models is often missing. In connection with the role, the role of methods for constructing models from experimental data is increasing.
Demographic forecasting is an integral part of the analysis of socio-economic processes in general. Many demographic time series are not stationary, have a complex structure, and their elements are formed under the influence of various factors, like many other phenomena of our society.
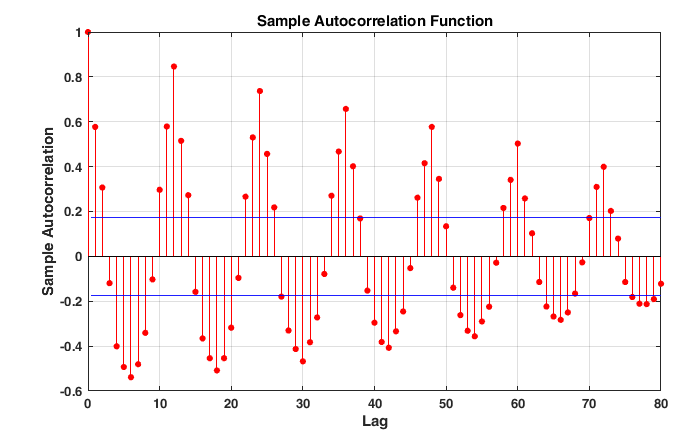
One of the important demographic indicators is the number of marriages concluded. The number of marriages concluded by months shows a pronounced seasonality. In May Russia, three to four times fewer marriages are registered in May than in August. Relatively few marriages also take place in January ‒ March, and most of all in August and September, the decrease in the frequency of marriages in December and April is associated with the spread of church registration and the ceremony of marriage (these months usually have posts).
Typically, additive static models ( Greene, 2017; Magnus, 2017) or the SARIMA (seasonal autoregressive integrated moving average) models ( Arlt, Trcka, & Arltová, 2017; Arlt & Trcka, 2019; Oliveira, Steffen, & Cheung, 2017) are used to model seasonal components.
In this paper, an adaptive autoregressive model with custom coefficients using the recursive least squares method is proposed.
Problem Statement
There is a time series of the number of marriages by month for the period from 2006 to 2016. We assume that the mathematical model of the number of marriages is described by the autoregression equation with time-variable parameters
It is necessary to create an adaptive predictive model based on autoregression with the optimal number of parameters according to the observed sequence of marriages. .
Research Questions
The paper is devoted to the issue of constructing an adaptive model for predicting the monthly number of marriages. The paper determines the optimal order of autoregressive models according to the Akaike criterion. To determine the coefficients, the recursive least squares method with forgetting coefficients is used. Test cases showed the advantage of an adaptive forecasting model based on autoregression.
Purpose of the Study
The aim of the study is to develop a model for predicting the number of marriages based on the autoregressive model. To achieve this goal, the article solved the problem of choosing a model of minimal complexity according to the Akaik criterion and training the resulting model according to the least squares criterion. The resulting allows for the forecast for 11 months in advance.
Research Methods
Recursive least squares method (RLS)
We represent equation (
where ,
The recursive least squares (RLS) for the equation (
где ,
is the coefficient of forgetting.
The choice of the structure of the autoregressive model
The model, in addition to good predictive properties, should have a small number of parameters in order to avoid the problem of “fit to data”. To account for the number of parameters in the structure, modified error functions are used. Most widely known Akaike's Information Theoretic Criterion (AIC)
is the value of the error function,
– is the number of model coefficients,
is number of observations;
and Rissanen’s Minimum Description Length (MDL)
Typically, the Rissanen criterion requires fewer parameters, but provides a less accurate model. We will use in our work Akaike's Information Theoretic Criterion (AIC).
Findings
Figure
We will use the model of autoregression of the type for forecasting
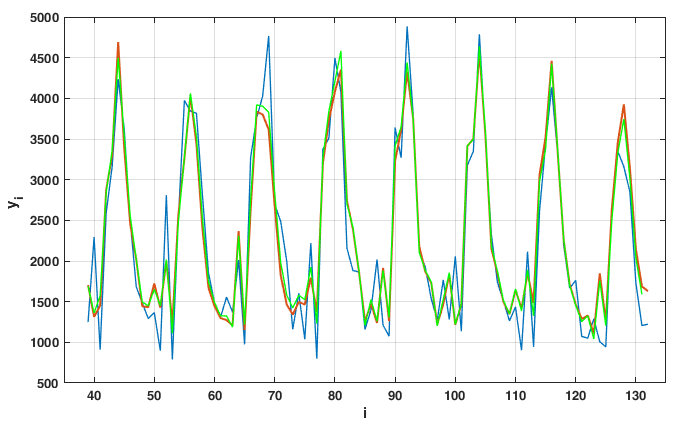
The identification results of model (
The determination coefficients for the LS model are and for the RLS model
It is worth noting that an attempt to create a model according to the SARIMA methodology led to a simple model with a coefficient of determination An increase in the number of parameters resulted in no improvement in this indicator. This fact may indicate that the time series has a long memory ( Baillie, 1996).
A further area of research may be the construction of models of the number of marriages based on autoregressions with differences of fractional order ( Guegan & Ferrara, 2008; Ivanov, Engelgardt, & Sandler, 2018) and fractional SARIMA model ( Ray, 1993; Liu, Chen, & Zhang, 2017).
Conclusion
The paper proposes an adaptive seasonal model of the number of marriages in Samara region. As a learning algorithm, the recursive least squares method with forgetting coefficients is used. It is shown that the forecast can be explained on the basis of a three-parameter autoregressive model.
The construction of the model according to the SARIMA methodology (seasonal autoregressive integrated moving average) confirmed the single root hypothesis. However, taking the seasonal first difference does not allow constructing, it does not allow constructing a high-quality autoregressive model of residues. This fact may indicate the presence of a long memory in the time series. In the future, it is planned to create a model based on autoregression with fractional order differences.
Acknowledgments
The authors gratefully acknowledge the contributions of prof. O.A. Katsyuba in improving the paper.
References
- Arlt, J., & Trcka, P. (2019). Automatic SARIMA modeling and forecast accuracy. Communications in Statistics – Simulation and Computation. In Press. Retrieved from: https://www.tandfonline.com/doi/abs/10.1080/03610918.2019.1618471 Accessed: 10.10.2019.
- Arlt, J., Trcka, P., & Arltová, M. (2017). The problem of the SARIMA model selection for the forecasting purpose. Statistika: Statistics and Economy Journal, 97(4), 25-32.
- Baillie, R. T. (1996). Long memory processes and fractional integration in econometrics. Journal of Econometrics, 73(1), 5-59. https://doi.org/10.1016/0304-4076(95)01732-1
- Greene, W. H. (2017). Econometric analysis. London: Pearson.
- Guegan, D., & Ferrara, L. (2008). Fractional and seasonal filtering. In J.L. Mazi (Ed.), Proceeding Book on the Conference Seasonality, Seasonal Adjustment and its Implication for Short Term Analysis and Forecasting, Eurostat (pp. 121-132). Ile-de-France: Sciences de l'Homme et de la Société.
- Ivanov, D. V., Engelgardt, V. V., & Sandler, I. L. (2018). Genetic algorithm of structural and parametric identification of Gegenbauer autoregressive with noise on output. In S. Patnaik (Ed.), Proceedings of the 8th International Congress of Information and Communication Technology. Procedia Computer Science, 131 (pp. 621-625). Amsterdam: Elsevier. https://doi.org/10.1016/j.procs.2018.04.304
- Liu, K., Chen, Y., & Zhang, X. (2017). An application of the seasonal fractional ARIMA model to the semiconductor manufacturing. IFAC-PapersOnLine, 50(1), 8097-8102. https://doi.org/10.1016/j.ifacol.2017.08.1246
- Magnus, J. R. (2017). Introduction to the theory of econometrics. Amsterdam: VU University Press.
- Oliveira, P. J., Steffen, J. L., & Cheung, P. (2017). Parameter estimation of seasonal ARIMA models for water demand forecasting using the harmony search algorithm. In J. Saldarriaga (Ed.), Proceedings of the XVIII International Conference on Water Distribution Systems, WDSA2016. Procedia Engineering, 186 (pp. 177-185). Amsterdam: Elsevier. https://doi.org/10.1016/j.proeng.2017.03.225
- Ray, B. K. (1993). Long-range forecasting of IBM product revenues using a seasonal fractionally differenced ARMA model. International Journal of Forecasting, 9(2), 255-269. https://doi.org/10.1016/0169-2070(93)90009-C
Copyright information

This work is licensed under a Creative Commons Attribution-NonCommercial-NoDerivatives 4.0 International License.
About this article
Publication Date
09 March 2020
Article Doi
eBook ISBN
978-1-80296-078-5
Publisher
European Publisher
Volume
79
Print ISBN (optional)
-
Edition Number
1st Edition
Pages
1-1576
Subjects
Business, business ethics, social responsibility, innovation, ethical issues, scientific developments, technological developments
Cite this article as:
Ivanov*, D. V., & Sevastyanova, S. A. (2020). Adaptive Forecasting Model Of The Number Of Marriages In Samara Region. In S. I. Ashmarina, & V. V. Mantulenko (Eds.), Global Challenges and Prospects of the Modern Economic Development, vol 79. European Proceedings of Social and Behavioural Sciences (pp. 1260-1265). European Publisher. https://doi.org/10.15405/epsbs.2020.03.180