
Queuing Application In Mc Donald’S Sungai Dua, Penang

Abstract
A study was conducted at McDonald’s in Sungai Dua, Penang, to improve its waiting and service time based on the queuing theory. A questionnaire was distributed to determine the customers’ satisfaction level. Customers’ arriving, waiting, serving, and leaving time were recorded in three consecutive weeks for two different hours which is from 10.00 am to 11.00 am (normal hours) and from 12.00 pm to 1.00 pm (peak hours), and within two different days (Wednesday and Saturday). The arrival, waiting, and serving time consists of four different scenarios. Scenario I is when 100% of the customers ordered food at the counter. Scenario II is when 70% of the customers ordered food at the counter and 30% ordered food by using the machine. Scenario III and Scenario IV are projected to reduce the number of customers who ordered food at the counter to 30% and 0% respectively. ARENA simulation software and Social Sciences Statistical Package (SPSS) software were used in this study. The results show that the average waiting time during normal hours is higher than during peak hours. When collecting food, the waiting time and number of customers queueing increased during peak hours. It is suggested that the waiting time and number of customers queueing will be reduced by adding another counter for collecting food. In terms of customers’ satisfaction level, it was concluded that sanitation is moderate and customer service is good.
Keywords: Queuingfast food industryqueuing theoryARENA Simulationwaiting time
Introduction
The fast food industry was developing in the early 1970s due to numerous changes in eating habits and food services ( Boas & Chain, 1976). Fast food is food that is prepared and served quickly. French fries, fried chicken, and hamburgers are the most popular fast food products usually packaged in boxes and disposable wrappers ( Boas & Chain, 1976). The food is usually sold to customers from a counter at the restaurant or by a driveway. The essential feature of a fast food restaurant is to wait for customers to receive food ( Qamar, Whitman, & Malzahn, 2012). Customer waiting time is therefore important to increase customers’ satisfaction.
Queuing is a mathematical analysis of queue or waiting line ( Vaidyanathan, 2009). Queuing theory was first analysed by a Danish engineer, mathematician, and researcher named Agner Krarup Erlang in 1913 to solve the telephone traffic problem ( Vass & Szabo, 2015). Queuing or waiting in line is a phenomenon that people face every day. Most people do not like to wait because they want to save time, reduce the cost of waiting and serving, and attain satisfaction. Queues exists because the demand for service is higher than the availability of service facilities ( Onoja, Kembe, CJ, & Gbenimako, 2017). Fast foods are a fast-growing industry in Malaysia and around the world. Even if Malaysians like to have home-cooked food, they decide to get a fast meal in fast food restaurants because of their limited time and busier lifestyle ( Quoquab, Dardak, & Zakaria, 2011). In addition, fast foods are readily prepared, affordable, and readily accessible compared to home-made foods ( Quoquab et al., 2011). There are a lot of fast food franchises in Malaysia such as KFC, McDonald’s, Pizza Hut, Domino’s Pizza, Kenny Rogers Roasters, Marrybrown, and Burger King. Table
Problem Statement
In fast food restaurants, there are some important things that most customers will consider such as less waiting time, short queuing line, affordable price, workers’ attitude, and food quality ( Dharmawirya, Oktadiana, & Adi, 2012). Most fast food restaurants face the problem of long waiting lines during peak hours especially during promotions, lunch, and dinner time ( Koh, Teh, Wong, Lim, & Migin, 2014). Hence, due to many customers, other customers must wait for their turn before being served and for those who are unwilling to wait for a long time, they may leave the fast food restaurant without buying or ordering anything.
Research Questions
Previous research has shown that there is very limited study on the queuing system for fast food restaurants. The queuing system is still new and there is a gap of studied. The simulation of the queuing system using ARENA software is also very limited. ARENA simulation software was used for this study. The Statistical Package for the Social Sciences (SPSS) software was used to determine the satisfaction level of customers being served. Currently, there is no study which shows the waiting line of customers served in McDonald’s Sungai Dua.
Purpose of the Study
Long waiting lines occur especially during peak hours, special offers, lunch, and dinner in fast food restaurants ( Koh et al., 2014). Some people do not like to go to fast food restaurants because they do not like to queue in a line. The study intends to investigate the queue behavior of customers during normal and peak hours as well as the satisfaction of the customers served by the staff. The purpose of the study is as follows:
To determine the performance of the service during normal and peak hours.
To optimise server numbers, waiting time, and service costs during normal and peak hours. In addition, the queuing analysis predicts when the number of customers would decrease by 30%, 70%, and 100% when the machine is broken.
To investigate customers’ level of satisfaction during peak and normal hours.
Research Methods
The study analysed the queuing process at McDonald’s in Sungai Dua, Penang. Customers arriving time, waiting time, serving time, and ending time during two different selected hours 10.00 am to 11.00 am (normal hours) and 12.00 pm to 1.00 pm (peak hours), and within two different selected days (Wednesday and Saturday) are monitored for a record that will be further analysed for three consecutive weeks from 17 th February 2018 until 6 th March 2018. The customers were provided with an additional questionnaire to determine their level of satisfaction at McDonald’s Sungai Dua. The questionnaire was distributed to customers during normal and peak hours on the two selected days. The machine was forecasted when 100%, 70%, and 30% of machine users were included as a study.
Physical Characteristics of Server
The queue notation is written as :A/B/P/Q/R/Z
Where A, B, P, Q, R, and Z describes the properties of the queuing system.
A - distribution type of the inter-arrival times.
B - distribution type of service times.
P - number of servers on the system.
Q - maximum duration of the queue. (Optional)
R - the size of the population of the system. (Optional)
Z - the discipline of queuing. (Optional)
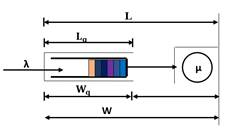
Based on our interview with the restaurant manager, we concluded that the queuing model that best illustrates the operation of McDonald’s Sungai Dua is M/M/1. This means that the time of arrival and service is distributed exponentially (the Poisson process). The M/M/1 queuing model is shown in Figure
Optimization of server and customers
In analyse the serving process of McDonald’s Sungai Dua, the following variables were investigated:
λ: Interarrival time
µ: Mean of service rate
ρ: λ/µ: utilisation factor
The probability that there are no customers in the restaurant:
Pn: The probability that there are n customers in the restaurant.
L: average number of customers eating in the restaurant.
Lq: average number of customers queueing.
W: average time spent including the waiting time of customers in McDonald’s Sg. Dua.
Wq: average waiting time for customers in the queue.
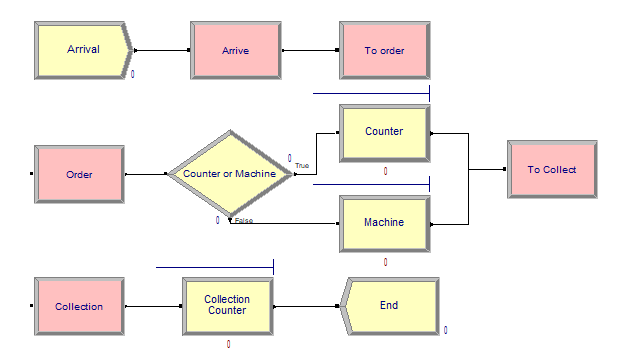
The optimisation of server and customer waiting line during normal and peak hours was analysed using the ARENA simulation model. A basic process and advanced transfer were used to obtain the simulation output. Table
Figure
This is a cross-section study conducted at McDonald’s in Sungai Dua, Penang. Structured questionnaires were distributed to all consenting customers who came to McDonald’s within the study period during normal hours and peak hours. The questionnaire on the food quality, service attitude, number of counters provided, hygiene of the restaurant, the process of ordering and waiting for food, time taken to clean the table, and whether a toilet should be in McDonald's Sungai Dua, Penang.
A Likert-Type scale was used in the questionnaire. Some questions were answered in the scale where 5 = Strongly agree and 1 = Strongly disagree, and some had the score reversed i.e. 1 = Strongly agree and 5 = Strongly disagree.
Findings
Physical Characteristics of Server
From the research method, equations (1) to (6) were used to calculate the probability that there are no customers and n customers in the restaurant, the average number of customers dining in the restaurant, the number in the queue, and the time spent in the restaurant including the waiting time and the average waiting time in the queue. All figures below represent the number of customers versus arrival, waiting, and service time.
Figure
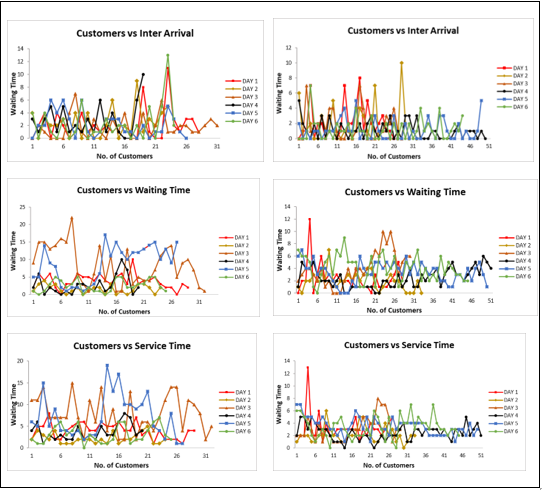
The figure above shows a line graph representing the arrival, waiting, and service time of the data collected. During normal and peak hours, the data was collected for three consecutive weeks on Wednesday and Saturday. As a result, the number of customers for each day is different.
The number of customers for normal hours is 29, 24, 32, 20, 27, and 25 respectively while for peak hours is 28, 33, 30, 51, 50, and 45 respectively. The graph pattern is similar for normal hours because the number of customers is only a few. The number of customers on Days 1 and 2 for peak hours is significantly lower compared to Days 5, 4, and 6. This is because the three Days were within a Chinese New Year’s week. The number of customers for Day 3 at peak hours is lower than normal hours because there is a birthday party in the restaurant that day. Most of the customers decided not to buy anything because there is limited space in the restaurant.
Optimsation of Server and Customers
The current situation (Scenario I) is that 100% of the customers ordered at the counter every day on Wednesday and Saturday for three consecutive weeks (6 days). The average number queueing and average waiting time were calculated to compare with other normal and peak hour scenarios.
The data in Table
The data in Table
The simulation is then divided into four scenarios and the average of inter-arrival time for normal hours is 2.2705 minutes. The waiting time for ordering and collecting food for Scenario 1 is around 3.3 to 3.8 minutes and the number of customers in queueing during ordering and collecting food is 1 customer. For Scenario II where 70% of customers ordered food at the counter and 30% use a machine, the waiting time at the counter, machine, and collection counter is 4.8, 4.5, and 5.8 minutes respectively while the number of customers queueing is between 1 and 2. The prediction for Scenario III is that in five years, only 30% of customers ordered food at the counter and others use the machine. The waiting time is lower than the previous two scenarios. Scenario IV is assumed that in 10 years, all McDonald’s restaurants will only be working on the machine and will save around 71% of the time waiting at the machine and 62% of the time waiting at the collection counter. There is also a lower number of customers queueing compared to the other 3 simulations (see Table
Based on the average peak hour simulation, the average arrival time for four scenarios is 1,5145 minutes. When there are no customers using the machine to order the food, the number of customers queueing and the waiting time for ordering and collecting food is high. Scenario II where 70% of the customers ordered food at the counter and Scenario III which assumed the situation in 5 years from now projects similar waiting time. The number of customers ordering at the counter is higher in Scenario II while for Scenario III, the number of customers ordering using the machine is higher. In Scenario IV, 100% of customers will order using the machine in 10 years from now. All McDonald’s restaurants are expected to use the machine and orders will no longer be taken at the counter. This will save about 10% of the waiting time at the machine and about 6% of the time at the collection counter (see Table
Satisfaction Level for Customers Regarding the Queuing and Food Quality
A questionnaire containing 7 items was used to investigate the level of customer satisfaction during normal and peak hours. The entire questionnaire was distributed to customers in McDonalds Sungai Dua, Penang. Item 1 deals with food quality whether it was fresh and well prepared. Many respondents agreed that the food quality was good whereby around 32.6% stated normal and 9.3% were very well agreed. None of the respondents disagree regarding the food quality. Item 2 is about the serving attitude of the staff whether it is good or bad. Respondents agree that they were served with a good attitude by the staff. Around 23.3% stated normal and 11.6% were satisfied with the attitude of the staff. None of the respondents stated dislike for this item. Item 3 concerns the satisfaction on the number of counters provided. The number of counters provided by the restaurant does not give customers complete satisfaction. About 21% of the respondents felt that the number of counters was insufficient. However, most customers were satisfied with the number of counters.
Item 4 is regarding the sanitation of the restaurant. Customers’ satisfaction with the hygiene of the restaurant means that many of them are not very satisfied. Although 43% of the customers are quite satisfied with the hygiene, 46% of them are still not satisfied. Item 5 deals with the process when ordering and waiting for food in a long waiting queue. Many customers have facing in a long queue and waited a long time to order and wait for food. However, about 32.6% of the customers did not have a long waiting time. Item 6 concerns the cleaning of the table whether it is on time or not. The time taken for the staff to clean the table gave the customers with the highest percentage of satisfaction. Only 20.9% who are not satisfied because the staff were late to clean the table. Item 7 is about the restaurant’s essential toilet. Most customers agree they need a restaurant toilet. However, fewer customers disagree with that. To conclude, the customers’ satisfaction with McDonalds Sungai Dua is moderate.
Conclusion
In summary, the data was collected in McDonald’s Sungai Dua, Penang for three weeks on every Wednesday and Saturday during normal hours (10.00 am to 11.00 am) and peak hours (12.00 pm to 1.00 pm). From the data analysis by ARENA Simulation Software, the average waiting time for normal hours was higher than peak hours. The waiting time for normal and peak hours at the collection counter is higher than at the order counter because during peak hours, most customers ordered their food using a self-serving machine. Therefore, the number of customers increased during the collection process. In order to reduce the waiting time and the number of customers during the collection time, it is suggested that there should be more than one counter to collect the food.
The questionnaires that was distributed to the McDonald’s customers contain seven items which addressed aspects of hygiene and customer service satisfaction. It can be concluded that the sanitation is moderate and customer service is good. There are a few future directions that can be followed by this research such as the effects on waiting time when there is more than one collection counter in the restaurant, the consequences if the restaurants operate for 24 hours, or the out-turn if customers use the drive-thru counter.
References
- Boas, M., & Chain, S. (1976). Big Mac: The Unauthorized Story of McDonald's. New York: E.P.Dutton.
- Dharmawirya , M., Oktadiana, H., & Adi, E. (2012). Analysis of Expected and Actual Waiting Time in Fast Food Restaurants. Industial Engineering Letters, 2(5).
- Koh, H., Teh, S., Wong, C., Lim, H., & Migin, M. (2014). Improving Queuing Service at McDonald's. AIP Conference Proceedings, 1605, 1073-1078.
- Onoja, A., Kembe, M., CJ, G., & Gbenimako, J. (2017). Application of Queueing Theory to Customers Purchasing Premium Motor Spirit (PMS) at a Filling Station. Research & Reviews: Journal of Statistics and Mathematical Sciences, 10.
- Qamar, I., Whitman, L., & Malzahn, D. (2012). Reducing Customer Wait Time at a Fast Food Restaurant on Campus. Journal of Foodservice Business Research, 10, 319-334.
- Quoquab, F., Dardak, R., & Zakaria, S. (2011). Consumers’ preference and consumption towards fast food: Evidence from Malaysia. Business and Management Quarterly Review, 2(1), 14-27.
- Vaidyanathan, S. (2009). Probability, Statistics and Queuing Theory. India: PHI Learning.
- Vass, H., & Szabo, Z. (2015). Application of Queuing Model to Patient Flow in Emergency Department. Case Study. Procedia Economics and Finance, 32, 479-487.
Copyright information

This work is licensed under a Creative Commons Attribution-NonCommercial-NoDerivatives 4.0 International License.
About this article
Publication Date
30 March 2020
Article Doi
eBook ISBN
978-1-80296-080-8
Publisher
European Publisher
Volume
81
Print ISBN (optional)
-
Edition Number
1st Edition
Pages
1-839
Subjects
Business, innovation, sustainability, development studies
Cite this article as:
Atiqah Mazlan, N., Nur Ezaty, S. T., Majid Khan, M. A., & Mohd Tahir, I. (2020). Queuing Application In Mc Donald’S Sungai Dua, Penang. In N. Baba Rahim (Ed.), Multidisciplinary Research as Agent of Change for Industrial Revolution 4.0, vol 81. European Proceedings of Social and Behavioural Sciences (pp. 701-710). European Publisher. https://doi.org/10.15405/epsbs.2020.03.03.82