
Comparing Of Assessments Of Innovation Space Technical Efficiency

Abstract
The aim of the study is to obtain and substantiate the quantitative characteristics of the influence of science and business on the results of innovative activity of the regions of the Russian Federation. As these results are considered issued patents and developed new production technologies. The hypothesis was tested to determine the dependence between the innovative activity of the region and the number of potential links between organizations that create new knowledge and innovative-active enterprises. The totality of these relations is characterized as an innovative space of the region. The results obtained through econometric modelling using official data of Federal state statistics service of the Russian Federation for the period 2009-2013, allows to prove some properties of estimates of the technical efficiency of regional innovation space and the estimates of the elasticity of innovative activity by size innovative space for regions of the Russian Federation. The role of public authorities in creating conditions for increasing the innovation activity of the regions of the Russian Federation through the opening of new scientific organizations and higher educational institutions is emphasized.
Keywords: Econometric modellingefficiency estimationregional economystochastic frontier
Introduction
The current understanding of the functioning of the innovation system at the national and regional levels is associated with the joint efforts of the state, business and scientific environment aimed at the creation, dissemination and use of new ideas, knowledge and technologies (Etzkowitz, 2010). Extensive literature indicates that the result of the innovation process is determined by the ability of the subjects of the regional innovation system to communicate and interact (Gibson & Batler, 2013; Golichenko & Balycheva, 2012; Shchepina, 2011). Such links are created between groups of firms (clusters), between firms and Universities or research centers. Obtaining quantitative characteristics of such connections and interactions is one of the most difficult tasks in the analysis of innovative processes. The purpose of this work is to obtain and substantiate the quantitative characteristics of the impact of science and business on the results of innovation activity of the regions of the Russian Federation. Patents and developed new production technologies are considered as such results. Freeman considered them as the main result of innovative development of the economy (Freeman, 1987). In this paper it is substantiates the dependence between the results of innovative activity of the region and the number of potential links between organizations that create new knowledge and innovative enterprises.
Problem Statement
The basis of the study is the results of testing the following hypothesis.
Research Questions
To test of hypothesis 1, production functions are constructed that determine the dependence of the result of innovative activity of the region on the aggregate characteristics of science and business for the period 2009-2012. Further, we consider exponential production function (The rationale for the production function specification is given in (Ayvazyan, Afanasiev, Kudrov, & Lysenkova, 2014). The rationale for the choice of explanatory variables is presented in (Makarov, Ayvazyan, Afanasiev, Bakhtizin, & Nanavyan, 2014).), in logarithmic form having the form
(1)
- result of innovative activity of the region (two indicators are considered: - number of patents granted in the region - number of new production technologies developed in the region in year ); - cost of fixed assets; - the number of employees engaged in research and development; - number of organizations creating new knowledge (two indicators are considered: - number of higher education institutions, - number of organizations performing research); - number of enterprises (two indicators are considered: - total number of enterprises in the region, - number of innovatively active enterprises); - parameters. Random component reflects the results of the impact of uncertainty and efficiency factors on the innovation process of the region. A normally distributed random variable is used to model the effects of uncertainty factors with zero expectation . This approach to residue modeling corresponds to the concept of stochastic frontier (Kumbhakar, & Lovell, 2004) and allows you to get correct estimates of the technical efficiency of factors of production. In the accepted designations the number of innovatively active enterprises of the region is determined by the value .
The way to test hypothesis 1 is to test the statistical hypothesis . Hypothesis 1 is accepted if the statistical hypothesis not rejected for 90% of the total number of evaluated species models (1), built for different characteristics and for period 2009-2012 year. If the hypothesis is rejected for more than 10% of the constructed models, then hypothesis 1 is rejected.
Model parameters (1) were estimated by the maximum likelihood method based on information about 80 regions of the Russian Federation. 16 models were built for this period of time (8 for patents and 8 for manufacturing technologies). The results obtained do not contradict hypothesis 1. All models feature the scientific potential of the region "the number of organizations involved in scientific research" (the alternative – "the number of higher educational institutions") and description of potential business, "the number of innovatively active enterprises" significantly influence the number of patents issued and the number of developed production technologies. The number of organizations creating new knowledge as a characteristic of the scientific potential of the region and the number of innovatively active enterprises as a characteristic of business affect the result of innovative activity of the subjects of the Russian Federation. Based on the test results for the period 2009-2012, hypothesis 1 is accepted. The characteristic of scientific potential "the number of personnel engaged in research and development" and the characteristic of business "the cost of fixed assets" are insignificant in all models. Model (1) can be converted to a view
(2)
Purpose of the Study
The results of testing the hypothesis 2 make it possible to substantiate the possibility of using potential links between organizations performing scientific research (alternative-higher education institutions) and enterprises using new knowledge to create innovations as a factor determining the results of innovation activity at the regional level. The set of paired potential links between such organizations and enterprises will be called the innovation space, and their number - the size of the innovation space.
Research Methods
We introduce the following notation , here can be both positive and negative. Then after the transformation of function (2) we get:
. (3)
If we introduce the following notation , then after the conversion we get:
. (4)
Hypothesis test 2 is reduced to a statistical hypothesis test for each evaluated model of the form (3) or (4). Hypothesis 2 is accepted for the period in question unless the statistical hypothesis is rejected for 90% of the total number of models evaluated. If the hypothesis is rejected for more than 10% of the models, then hypothesis 2 is rejected for the period in question. The parameters of eight models of the type (3) and (4) constructed according to the data of 80 regions of the Russian Federation of the period 2009-2012 are estimated for issued patents and eight models for production technologies. For 15 of the 16 models the hypothesis is not rejected. For one of the models constructed according to 2009 for production technologies, the hypothesis is rejected. The test results allow us to accept hypothesis 2. The production functions of the view (2) can be converted to the view (5):
М1: , (5)
here - number of potential pairings between research organizations (alternative-higher education institutions) and innovatively active enterprises. The value will be called the size of the innovation space of the region. Thus, the model (5) describes the dependence of the result of innovative activity of the region on the size of the innovation space. Further, as one of the characteristics of the innovation system of the Russian Federation at the regional level, the estimation of the parameter , characterizing the elasticity of the result of innovative activity of the region by the size of the innovation space is considered.
Findings
The estimation of the constant c of the model (5) depends on the method of estimating the size of the innovation space and can be considered as a scaling parameter of the scale of the size of the innovation space. The elasticity of innovative activity, size of innovative space reflects the development of innovation system at the regional level through extensive business development, education and science.
Figure
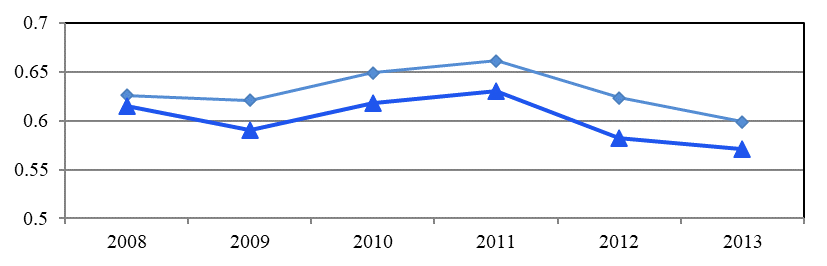
Figure
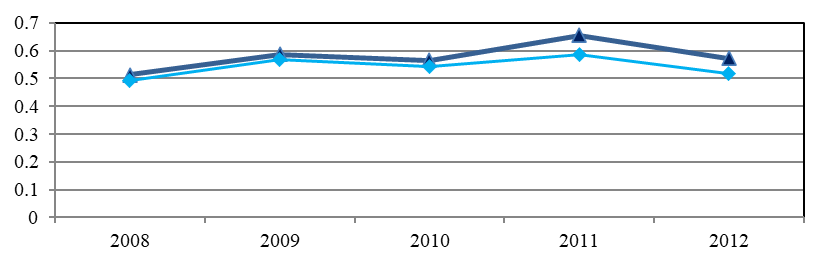
With estimated parameters we can estimate (Battese, & Coelli, 1988) mathematical expectation
,
Here
In accordance with the concept of stochastic boundary, the value characterizes the technical efficiency of the region's use of innovation space. Technical efficiency estimates are relative characteristics of regional efficiency. Their values can vary from year to year. However, the ranks of regions determined by technical efficiency assessments are stable characteristics of their innovation activity.
Conclusion
1. The number of organizations that create new knowledge as a characteristic of the scientific potential of the region and the number of innovatively active enterprises as a characteristic of business affect the result of innovative activity of the regions of the Russian Federation – the number of developed production technologies and the number of patents issued.
2. The results of innovation activity of the Russian regions depend on the size of the innovation space, which is determined by the number of potential links between organizations that create new knowledge and innovative activity enterprises.
3. The elasticity of innovation activity, the size of the innovation space reflects the development of the innovation system at the regional level through extensive development of business, education and science.
4. It was concluded that the set of parameters , where and - The parameters of the model (1), a t is the time, can be used for a parametric description of the national innovation system of the Russian Federation when it creates regions of a certain result of innovation activity. Similarly, using a model of the form (1), a parametric description of other national innovation systems can be obtained. Moreover, it is possible to compare their parametric descriptions. Growth in time as a constant , and elasticity , testifies to the development of the national innovation system. Set of four parameters Can be used to describe a regional innovation system.
Acknowledgments
The work was supported by the Russian Science Foundation (project 17-18-01080).
References
- Ayvazyan, S. A., Afanasiev, M. Yu., Kudrov, A. V., & Lysenkova, M. A. (2014). Modeling of production potential based on the concept of stochastic boundary. The methodology, the results of the empirical analysis. Moscow: KRASAND. [in Russ.].
- Battese, G., & Coelli, T. (1988). Prediction of Firm-level Technical Efficiencies with a Generalized Frontier Production Function and Panel Data. Journal of Econometrics, 38, 387-399.
- Etzkowitz, H. (2010). Triple helix. Universities-enterprises-state. Innovation in action. Retrieved from http://courier-edu.ru/cour1112/0007.htm [in Russ.].
- Federal State Statistics Service. (2013). Retrieved from http://www.gks.ru [in Russ.].
- Freeman, C. (1987). Technology Policy and Economic Performance: lessons from Japan. London, Pinter
- Gibson, D., & Butler, J. (2013). Research Universities in the Framework of Regional Innovation Ecosystem: The Case of Austin, Texas. Foresight-Russia, 7(2), 42-57. [in Russ.].
- Golichenko, O. G., & Balycheva, Y. E. (2012). The typical models of innovation behavior of enterprises. Innovations, 3(173), 46-53. [in Russ.].
- Kumbhakar, S., & Lovell, K. (2004). Stochastic Frontier Analysis. Cambridge: Cambridge University Press.
- Makarov, V. L., Ayvazyan, S. A., Afanasiev, M. Yu., Bakhtizin, A. R.., & Nanavyan, A. M. (2014). The estimation of the regions’ efficiency of the Russian Federation including the intellectual capital, the characteristics of readiness for innovation, level of well-being, and quality of life. Economy of Region, 4, 9-30. [in Russ.].
- Shchepina, I. N. (2011). Sustainability of innovative behavior of the Russian regions during growth, stagnation and recession. Innovations, 6, 78-84. [in Russ.]
Copyright information

This work is licensed under a Creative Commons Attribution-NonCommercial-NoDerivatives 4.0 International License.
About this article
Publication Date
31 December 2019
Article Doi
eBook ISBN
978-1-80296-076-1
Publisher
Future Academy
Volume
77
Print ISBN (optional)
-
Edition Number
1st Edition
Pages
1-1056
Subjects
Industry, industrial studies, project management, sustainability, business, innovation
Cite this article as:
Lysenkova*, M. A., & Afanasiev, M. Y. (2019). Comparing Of Assessments Of Innovation Space Technical Efficiency. In I. O. Petrovna (Ed.), Project Management in the Regions of Russia, vol 77. European Proceedings of Social and Behavioural Sciences (pp. 1-7). Future Academy. https://doi.org/10.15405/epsbs.2019.12.05.1