
Socio-Demographic Factors Being Kurgan Regions Living Standards Criteria

Abstract
The article analyzes social and demographic factors being living standards evaluation criteria. The results of calculations based on statistical data on mortality and morbidity of the population over the last decade are presented, the relationship between the groups of these indicators is established, and the areas types are identified per their totality. Normally, the concept “quality of life” implies a variety of approaches to its assessment and a variety of indicators distributed into the following fields: social, economic, environmental. In the Russian Federation most regions are negatively affected by such of socio-demographic factors: insufficient healthcare for patients with terminal diseases, environmental issues, stressfulness with social instability. To reflect these regional features several groups of the indicators are needed. The suggested key group of socio-demographic indicators is claimed to be the main criteria for evaluating living standards in many regions of Russia. The research findings enable to identify the most acute problems of the socio-demographic development of Kurgan Region and suggest the ways of addressing them.
Keywords: Living standardsmorbiditymortalitycorrelationgrading
Introduction
The most generalized indicator of the population well-being is the living standards whose improvement is the most important task of the state and regional policy. In modern studies, the living standards of the region are considered an integral socio-economic system reflecting the state and level of the social, economic and environmental spheres development.
Problem Statement
According to Gukalova et al. (2009), a study of living standards should be based on the following methodological principles:
1) consistency, which implies that the designated concept and specific content of living standards should form the structure;
2) dynamism implicates that the individual components of living standards change both in space and in time; however, these changes may occur asynchronously and at different speeds;
3) openness of the region and society means that the region is a consequence of the manifestation of a certain set of not only internal but also external factors, which have for a long time been forming the characteristics of living conditions and the state of the population;
4) evaluation of living standards infers the application of universal indicators which are easy to find, interpret or calculate; originality or additional introduction of special characteristics is possible only to clarify a specific regional situation;
5) living standards are a social category; trends in social interactions with regards to gender and age aspects between social groups owning unequal material and other resources having different needs and interests and playing different roles should be conceptualized at the regional level; the same applies to the separation of urban and rural population, leading fundamentally different ways of life.
The capacity of the living standard category determines the existing diversity of approaches to its assessment. A wide variety of systems and indicators from the most generalized ones covering the most essential aspects of human life up to the detailed multi-level systems with a specified list of components from very broad ones including almost all aspects of life values to relatively narrow based solely on the level of material well-being are used in research scientific training (Degil, 2012; Fedulova, 2013).
A group of socio-demographic indicators that have a negative impact on the welfare of the Kurgan region population are paid a particular attention to.
The objective of the study is to analyze groups of socio-demographic indicators and identify the relationship between them for determining intra-regional differences.
Research Questions
A specific indicator of living standards is a socio-demographic indicators group including: life expectancy, total mortality rate, infant mortality rate, general tuberculosis incidence and malignant tumors (White, Kudrik, & Nikolaeva, 2018). We have added the incidence of HIV, morbidity of organs and circulatory systems to the sample. It is this sample of indicators that corresponds to the achievement of the objectives of this study since they characterize the most significant aspects of the region’s population well-being.
Purpose of the Study
The study of this group of socio-demographic indicators involves the following:
1) forming a set of statistical indicators and their characteristics;
2) rationing the selected values of indicators;
3) systematizing the normalized indicators;
4) ranking the obtained values and their mapping;
5) calculating the pair correlation coefficients.
Research Methods
Both the long-term averages and the values for a particular year were used in the process of developing the statistical indicators aggregate. Since the collected data have different units of measurement it became necessary to rate them by comparing the minimum and maximum values, which ensures their variation from 0 to 1.
All initial indicators are normalized according to the formula:
i=1,2,3…n j=1,2,3…m
where
are normalized initial indices;
are the worst values for each indicator;
the values which are the most different from
Further, all indicators were summarized in two groups: mortality and morbidity rates. Euclidean distance method being a measure of proximity was applied in the ranking of the obtained groups according to the following formula:
where xi is social and demographic indicators, n is the number of the territorial units under study, x0 is a conditional area characterized by the worst zero values.
It is worth noting that testing other similarity measures instead of Euclidean distances did not give more reliably interpretable results.
With the objective to establish the relationship between the groups of selected data the Pearson pairwise correlation coefficients were calculated according to the formula:
where xi, yi are compared indicators; x, y are the average arithmetic values of compared indicators. Possible values of the Pearson coefficient R range from 0 (minimal communication) to ± 1 (maximum connection strength) (Lemeshko, Lemeshko, Postovalov, & Chimitova, 2011).
A study of the socio-demographic indicators of the living standards in Kurgan Region over the past 10 years was conducted with the objective to implement the presented methodology.
Findings
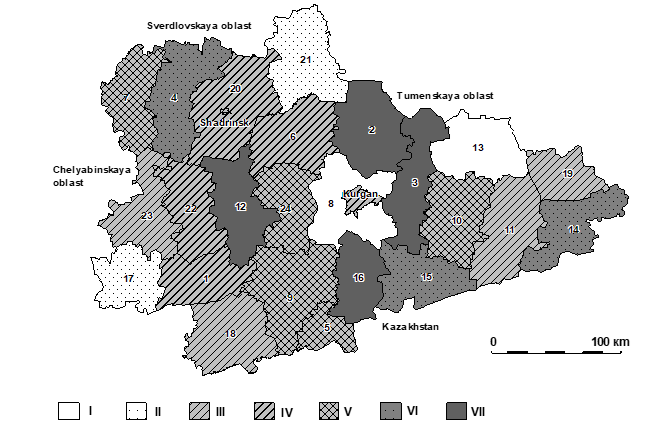
Kurgan region being a part of Ural Federal District and the Ural economic region occupies a compact territory bordering with Kazakhstan and includes 24 administrative districts and two cities of regional subordination, namely, Kurgan and Shadrinsk.
Kurgan Region is a subsidized one that ranks 67th in terms of GRP and 74th in terms of the integral rating of the socio-economic development of the regions. In addition, since 1995 Kurgan region has had a very unfavorable demographic picture in Russia comprising the reduction in the population due to intensive migration outflow and a high mortality rate including mortality at working age. In general, the region has lost a third of its population over nearly the past thirty years. At the date of January 1, 2018, 845,537 people lived in the Kurgan Region, which is 0.6% of the population of the Russian Federation and 6.8% of the population of Ural Federal District.
An acute problem in our region is the high mortality rate of the population including the infant one. According to statistics in the region, the infant mortality rate in 2005 was 12.1 and this indicator dropped to 8.8 over the decade, which is associated with setting up a perinatal center in Kurgan in 2010. The latter also determined the change in the structure of the causes of infant mortality since the percentage of deaths from congenital anomalies decreased from 25% to 11%. Within the region, a consistently high infant mortality rate has been maintained for the entire previous ten-year period in the Almenevsky and Mishkinsky districts. In 2015, Petukhovsky and Shchuchansky districts joined this group. Together, all of these areas are maximally remote from the regional center and, hence, from a qualified medical care as well.
In 2015, the crude mortality rate of Kurgan region was 16.1, estimated as very high and it ranks with Bryansk, Ryazan and Smolensk regions. Kurgan region has the highest crude mortality rate among all the subjects of Ural Federal District and the difference in indicators with a number of subjects of Ural Federal District reaches 10, for example, in 2015, the crude mortality rate of Khanty-Mansi Autonomous Okrug amounted to 5, which is a little higher than in Yamal-Nenets Autonomous District. However, there is a downward trend in the crude mortality rate in Kurgan region over the study period.
Analysis of the age-specific mortality rate in 2015 shows a decline in all age groups in comparison with the year 2005. However, the maximum rates remain in the age category over 70 years and the mortality rates remain high for the age in the scope of 50–59 and 60–69. Considering the fact that for many years Kurgan Region was characterized by an increase in the proportion of the elderly population as a result of declining birth rates and an intensive migration outflow of the youth, it was this unfavorable age structure that provided high mortality rates for the region as a whole. The problem of the region is the high mortality rate among men of working age mainly. Thus, in 2015 the mortality rate among men was 18% while among women it was 14%. However, it can be stated that over the past 10 years there was a decrease by 3.4 among men and by 0.9 among women with regards to this indicator.
Life expectancy has also changed. The lowest indicator for the studied period was noted in 2005 and was equal to 64.1 years (57.35 for men and 71.78 for women). The average life expectancy of the Kurgan region population from 2010 to 2015 is within the range of 68 to 69 years and in 2015 it was 62.82 years for men and 75.51 years for women. Throughout the decade, rural residents of both sexes had a shorter life expectancy than citizens with 2 to 3 years apart. With regards to the indicators of the crude mortality rate, the areas of the region can be divided into three large groups: “high” (10-14.9 -14), “very high” (15-19.9), and “excessively high” (more than 20). However, in 2005 high mortality rates were recorded in the northern, northwestern and southwestern regions and by 2015 the situation had changed in the following way: with the decrease in the above-mentioned municipal entities there was increase in the crude mortality rate in the areas bordering on Kazakhstan.
The structure of the causes of mortality in Kurgan region over the decade did not undergo any significant changes and the diseases of the circulatory system take the first place. In 2015 they accounted for 42%. The maximum values are typical for the cities of Kurgan and Shadrinsk, Ketovsky district and north-western regions. This indicator depends on a variety of reasons but the most clearly observed is the direct relationship between the mortality of the population from circulatory system diseases and average life expectancy (correlation coefficient 0.74).
Accidents, poisonings and injuries took the second place among the causes of death for a rather long time. However, since 2009 the situation has changed and the mortality rate caused by neoplasms has increased, and now it ranks the second in the structure of causes of death in the region (16%). Kurgan region is the leader among the Russian regions in terms of mortality caused by cancer tumors. In 2015 the mortality rate due to malignant neoplasms was 203 cases per 100 thousand people in Russia and in the Trans-Urals it made up 253 cases per 100 thousand people. The areas bordering on Kazakhstan have the significant death rates due to neoplasms (Lemeshko et al., 2011; Akimov, 2016; Zavyalova, Abrosimova, & Menshchikova, 2016).
The problems of high mortality are complemented by a decrease in the level of health while a third of the region’s population suffers from chronic diseases and almost 8% are disabled. The average level of general morbidity over the past ten years is 842.02 people per thousand inhabitants (the highest in Ural Federal District), which reflects the unfavorable picture of the demographic and social state of the territory. The overall incidence rate is unsustainable over time and the range of its fluctuations over the past decades is 103 units. Thus, its characteristics are based on average data over several years.
The overall structure of morbidity in the Kurgan region, as well as in the country as a whole indicates that its large part is comprised by the respiratory and circulatory diseases. The respiratory ones are more than 50% in the structure of childhood morbidity and the circulatory ones are in the first place in the structure of adult morbidity (18%) and they exceed the average Russian level in Dalmatovsky, Kataysky, Mishkinsky areas.
Socially dangerous diseases including tuberculosis are widespread in the region as well. With regards to a high rate of tuberculosis incidence the region is in the top ten in the Russian Federation and the first in the district. It surpasses the national average by 1.5 times with a general trend of decline in this indicator in the region. The most acute situation with the incidence of tuberculosis has developed in the eastern regions being Makushinsky, Mokrousovsky and Lebyazhevsky ones.
At the date of 2015, Kurgan region was among the 20 worst constituent entities of the Russian Federation in terms of the incidence of human immunodeficiency virus which was 2 times higher than the national average. High average long-term HIV incidence data is inherent in the north-western regions and the city of Kurgan.
The region is in fifth place in Russia in terms of the incidence of malignant neoplasms. In recent years, this indicator has increased in all areas of the region, apart from Shchuchansky and Kurtamyshsky ones. In 2015 its value among the population of Zauralye was 474 cases per 100 thousand people while the similar indicator in Russia was 388. In general, the maximum rates of oncological diseases are specific to the city of Kurgan and the border areas of the region. The structure of oncological diseases is dominated by oncological and gynecological diseases of women, malignant tumors of the gastrointestinal tract, respiratory organs and mammary gland.
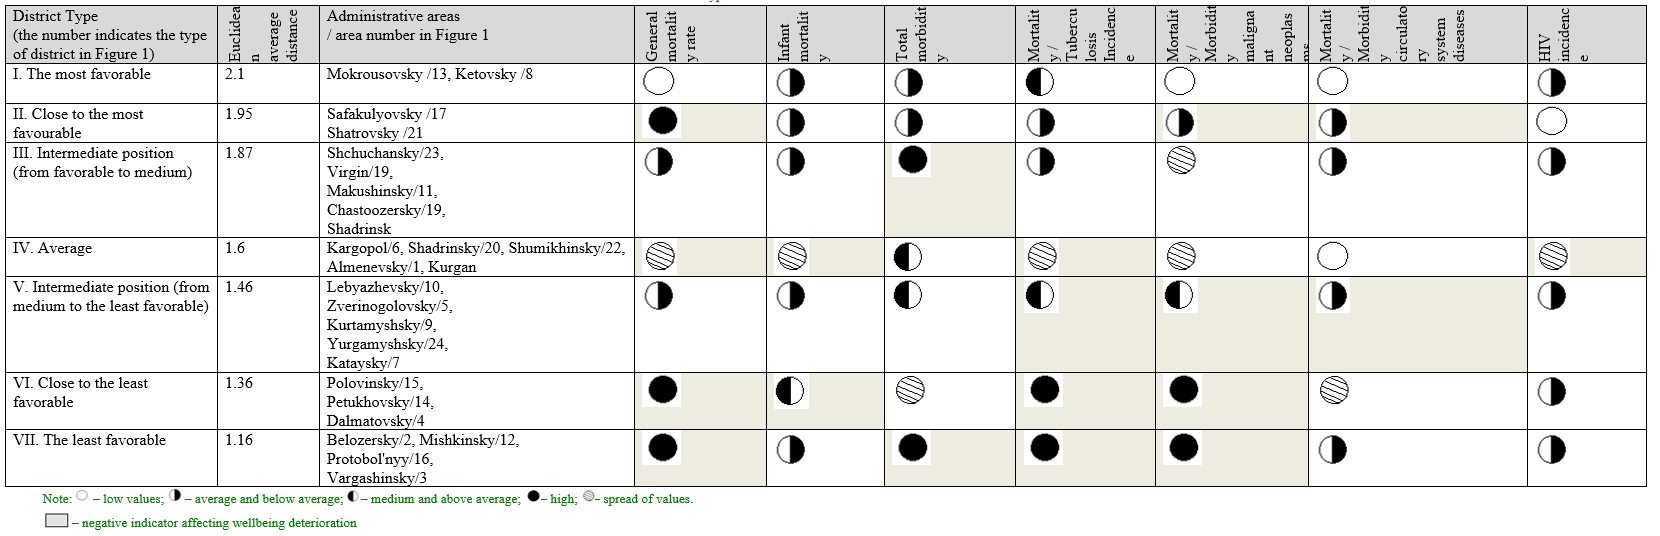
With the objective to establish the relationship between the general mortality rate and total morbidity, there were calculated the paired correlation coefficients whose results showed a weak link between them. However, the definition of the relationship between incidence (tuberculosis, malignant neoplasms, circulatory diseases) and a similar cause of mortality revealed other results. In all cases the correlation coefficient falls in the medium and high values (Table
Ranking of the administrative districts of the region was carried out taking into account the normalized groups of mortality and morbidity rates, which enabled to identify the areas with varying degrees of remoteness from the worst indicative territory (Figure
The revealed situation in Kurgan Region is largely determined by the characteristics of the system of medical services for the population.
The basis of the territorial organization of medical care is the rural health posts located in many settlements. Their number in the districts of the region varies from 2-15 in the Shadrinsky, Shatrovsky, Zverinogolovsky and Chastoozersky regions up to 35-45 in the Shumikhinsky, Makushinsky, Dalmatovsky, Belozersky, Kargapolsky and Kurtamyshsky areas. The average load on the rural health posts in the region is 800 people.
Timely medical care depends on the remoteness of settlements from the district hospital. Vargashinsky district is the most remote settlement from the Central District Hospital and it is 78 km away while the minimum distance to the Central District Hospital is 21 km (Ketovsky and Chastoozersky regions). For other areas, this figure varies from 30 to 60 km.
The maximum time spent to get from the village to the district hospital with an average speed of 60 km/h is more than 1 hour in Shumikhinsky, Vargashinsky, Shchuchansky, Shadrinsky, Kataysky districts and the minimum is 35 minutes in Ketovsky and Chastoozersky regions. In case of calling an ambulance and taking a patient to the hospital these time intervals are doubled.
The average distance from the district center to the city of Kurgan, in which all highly qualified assistance is concentrated, is 130 km. Moreover, the distance from the regional center to 13 district centers of Kurgan region exceeds this mark and the city of Kataysk and the settlement of Safakulevo are located more than 200 km away from the regional center. Moreover, only 8 district centers are located at a distance not exceeding 100 km from the city of Kurgan.
The most important problem for the Kurgan region is the availability of medical personnel. In recent years, the region is traditionally the last among Ural Federal District with regards to medical personnel and is one of the last five regions of Russia in terms of the number of doctors per 10,000 people.
In 2016 the average Russian indicator of the availability of doctors per 10 thousand of patients was 46.4 people and in Kurgan region it was equal to 29.3, which is the 84th position among the subjects of the Russian Federation. This indicator does not exceed 10 people in a number of districts of the region represented by Ketovsky, Polovinsky, Petukhovsky ones. An analysis of this indicator over the year 2005 has shown that there are some minor positive changes in a number of districts of the region as well as the cities of Kurgan and Shadrinsk but the problem of providing Kurgan region with doctors remains one of the most acute ones. At present, the situation with specialists being general practitioners, neuropathologists, gastroenterologists, rheumatologists, oncologists, and TB specialists in our region is almost twice worse than the average in Russia.
The workload on one doctor is traditionally high in our region due to the shortage of doctors. Thus, in 2016 the population per doctor was 340.8 patients with an average Russian indicator of 215.6 ones. This problem is particularly acute in Ketovsky district, where in 2016 there were 1083.7 people per doctor, Polovinsky district with 1055 patients per 1 doctor, Kataysky district represented by 938.7 patients per a doctor, Petukhovsky district with 929.8 patients and Shumikhinsky district with 919.8 ones.
In 2016 Kurgan Oblast ranked 25th among the subjects of the Russian Federation in terms of nursing staff sufficiency per 10 thousand of the population with an indicator of 116.2 persons per 10 thousand of the population with the average of 104.8 people in Russia.
The population per one representative of the nursing staff in Kurgan region in 2016 was represented by 86 people. This indicator has remained stable over the last ten years.
In the districts of the region, the problem of providing paramedical staff is particularly acute in the Ketov district, where in 2016 there were 225.4 people per a health care worker, the Shchuchansk district (192.9) and the Kurtamysh district (155.2) (Akimov, 2016).
Conclusion
The study has led to the following conclusions:
1.One of the key components of the living standards is socio-demographic indicators either of which reflects a certain aspect of the population well-being. During the study, two groups of indicators characterizing mortality and morbidity were identified and analyzed.
2.The proposed relationship between general morbidity and mortality rates for the administrative districts of Kurgan region has not been confirmed, which indicates the prevailing effect of the age structure of the population on the overall mortality rate.
3.Calculations and analysis of Pearson's correlation coefficients between morbidity (tuberculosis, malignant neoplasms, circulatory system) and a similar cause of death have proved a direct average and high degree of correlation. One of the reasons for the revealed dependence is the low level of the public health care system development.
4.The subsequent calculation of the Euclidean distance on the basis of morbidity and mortality rates enabled to categorize the administrative districts of Kurgan region. The need for this differentiation is due to the importance of reflecting the role played by socio-demographic indicators as the living standards criteria. This makes it possible to single out inter-district differences to increase the effectiveness of the intra-regional policy in the social sphere, the improvement of medical services for the population in particular.
References
- Akimov, T. G. (2016). Territorial structure of mortality of the population of the Kurgan region. In Socio-economic geography: history, theory, methods, practice: a collection of scientific articles (pp. 525–531).
- Degil, O. V. (2012). Methods of determining the quality of life of a region's population based on a comprehensive indicator of the quality of life, Global Scientific Potential, 11(20), 132
- Fedulova, L. (2013). The knowledge resourse and quality of life of the population of Ukraine´s regions, Economics and forecasting, 2(11), 68
- Gukalova, I. V., Lisovsky, S. A., Marunyak, E. A., Misevich, K. N., Rudenko, L. G., & Ryashchenko, S. V. (2009). Quality of life in Ukraine and Russia as a factor in socio-economic development, Geography and natural resources, 3, 151.
- Kusainov, A. (2016). Human Development Index: Kazakhstan’s place in the world and among the post-Soviet countries, Economics and Statistics, 4, 114.
- Lemeshko, B. Yu., Lemeshko, S. B., Postovalov, S. N., & Chimitova, E. V. (2011). Statistical analysis of data, modeling and investigation of probability laws. Computer approach. Novosibirsk: NSTU Publishing House.
- White, E. I., Kudrik, A. I., & Nikolaeva, L. S. (2018). Quality of life of a region's population: methodology, integral assessments on the example of the Pridnestrovian Moldavian Republic. Bulletin of the Dnieper University. Series: Physics, Mathematics and Technical Sciences. Economics and Management, 3(60), 280–285.
- Zavyalova, O. G., Abrosimova, I. V., & Menshchikova, L. V. (2016). Geography of the population and area of services of the Kurgan region. Kurgan: Nauka.
Copyright information

This work is licensed under a Creative Commons Attribution-NonCommercial-NoDerivatives 4.0 International License.
About this article
Publication Date
28 December 2019
Article Doi
eBook ISBN
978-1-80296-075-4
Publisher
Future Academy
Volume
76
Print ISBN (optional)
-
Edition Number
1st Edition
Pages
1-3763
Subjects
Sociolinguistics, linguistics, semantics, discourse analysis, science, technology, society
Cite this article as:
Podkorytova, L., Podkorytova, L., Neumyvakina, N., Akimova, T., Anchugova, L., Abrosimova*, I., Neumyvakina, N., Akimova, T., Anchugova, L., & Abrosimova*, I. (2019). Socio-Demographic Factors Being Kurgan Regions Living Standards Criteria. In D. Karim-Sultanovich Bataev, S. Aidievich Gapurov, A. Dogievich Osmaev, V. Khumaidovich Akaev, L. Musaevna Idigova, M. Rukmanovich Ovhadov, A. Ruslanovich Salgiriev, & M. Muslamovna Betilmerzaeva (Eds.), Social and Cultural Transformations in the Context of Modern Globalism, vol 76. European Proceedings of Social and Behavioural Sciences (pp. 23-32). Future Academy. https://doi.org/10.15405/epsbs.2019.12.04.4