
Application Of Geographic Information System On Surveillance Of Dengue Vector In Penang

Abstract
Dengue fever is one of dangerous mosquito-borne disease and has become major important challenging public health problems in Malaysia especially in the fast developing city like Penang. This study is to incorporate of the systematic effective approach by using Geographic Information System (GIS) application as a tool in order to help the process of data collection, data processing, data analysis and mapping study using the software ArcGIS 10.1. The role of GIS applications in producing an analysis in the form of mapping that allows viewing and analyzing data on mosquito vectors of dengue in the study area. The result of this mapping indirectly helps in pattern distribution of dengue vector and predicting the location of potential as a hot spot location of this mosquito-borne outbreak. An analytical statistic of Statistical Package for the Social Sciences (SPSS) was demonstrated the perimeter use in this study and comparison result between GIS application and SPSS was analysed. Through the study, the potential of the approach of GIS applications in the management strategy for dengue control operation and a program of an appropriate vector for dengue solve the problem that is increasing every year.
Keywords: Geographic Information Systems (GIS)Vector of Dengue; Penang
Introduction
In this study, GIS is used as an aiding tool in data collecting, data processing, analysis and mapping by using ArcGIS 10.1 software. GIS application enable the processing of spatial and non-spatial data to generate the information in the form of dynamic mapping series as well as static mapping for visual data presentation that are presentable and easy to understand by various level of society. Furthermore, the mapping also assists indirectly in predicting the potential areas that are exposed with dengue outbreak.
At the end of this study, the role of GIS application were highlighted as it generates the analysis in the form of mapping that allow the illustration and data analysis of mosquito vector and dengue outbreak at the study area. The potential of GIS application can be used as a strategy management in controlling dengue cases in various vector control program that are appropriate in order to resolve the increasing cases of dengue outbreak.
Recently, vector borne diseases such as dengue fever and dengue haemorrhagic fever are identified as the highest cases in most of the Asian country including Malaysia. According to the data by the Ministry of Health Malaysia, it showed the increasing of cases in dengue fever by 22.8 % (14,982 cases) that the total cumulative cases of dengue fever from January until 29 August 2015 is 80,654 cases compared to 65,672 cases in 2014 on the same timeline. Meanwhile, a total of 3 death cases were reported until last week. The total cumulative death is increasing at 91 death by 71% up until 29 august 2015 is 219 death compared to 128 death on 2014.
Premise surveillance has been conducted from January to June 2015 showed that a total of 35094 premises are positive with
The increase of dengue fever outbreak is influenced by the environmental factor as well as the development activities. The environmental factors including temperature, rain distribution, residential area, demographic structure, domestic waste disposal management and population are affecting the breeding activity and survival of
The agency such as the District and State Health Department is still using a conventional surveillance as their work practice. Mapping and visual presentation analysis by using a spatial-based technology application is still not fully utilize and implement in monitoring, management and research of vector control program. Moreover, the monitoring and control program of dengue outbreak today focuses more on controlling the identified mosquito population has causing the spread of dengue outbreak to a lower and stable population.
Geographic Information System (GIS) enables mapping for spatial visualization by using ArcGIS 10.1 software. This user-friendly software can also manage and update the data on entomology and epidemiology in order to predict the vector exposure and dengue outbreak in a location accurately (Chang et al., 2009). The extensive study has been done by using GIS in controlling vectors and vector borne disease. However, the potential spatial-based technology like GIS still have not been given enough recognition in prevention and controlling vector program in this country (Eisen, Beaty, Morrison, & Scott, 2009)
In order to get the location precisely, the GIS application is using the Global Position System (GPS) that can assist in collection of fieldwork data on dengue distribution cases based on the report. GPS technology is suitable to use as it integrates with GIS application made it easier in database processing for visualization and analysis (Morrison, Zielinski-Gutierrez, Scott, & Rosenberg, 2008). In addition, the approach used in GIS has enable the various types of data and information regarding spatial location, the potential and related statistical analysis and the development of database that can easily be managed and update for the use of the District and State Health Department. It is also can be used to monitor the dengue outbreak as well as the identified potential location for dengue outbreak in the future. Therefore, this study was aimed to determine abundance of dengue vectors by investigate potential breeding sites in Balik Pulau, Batu Maung and Gelugor in Penang Island using GIS
Problem Statement
Surveillance that has been conducted irregularly at Pulau Pinang is one of the factors contributing to the ineffective dengue control around this area. The convention method practiced by the agencies such as State and District Health Department is identified as the main contributor to the expanding dengue cases especially at the urban area. Therefore, a more systematic and effective approach is needed to improve the work practice
Research Questions
-
What is cause dengue outbreak at urban area in Pulau Pinang.
-
What is relation between present of potential breeding sites with population of dengue vector.
-
How GIS application can help in identify location of dengue cases distribution appropriately.
Purpose of the Study
-
To determine of potential breeding container habitats of the dengue vectors in Pulau Pinang, Malaysia
-
To show the importance of mapping and result of visual analysis in use of information system GIS in observation operation, disease control and research about vector carrier
Research Methods
Study area
There were three main components in the methodology of this study; observation of ovitraps, the observation of distribution and diversity of the mosquito found at different ovitraps and lastly to compare the data of mosquito breeding sites. Balik Pulau is a rural area in the south-western district, Batu Maung is sub urban area in the south-eastern district and Gelugor is an urban area in the northeast district of Penang.
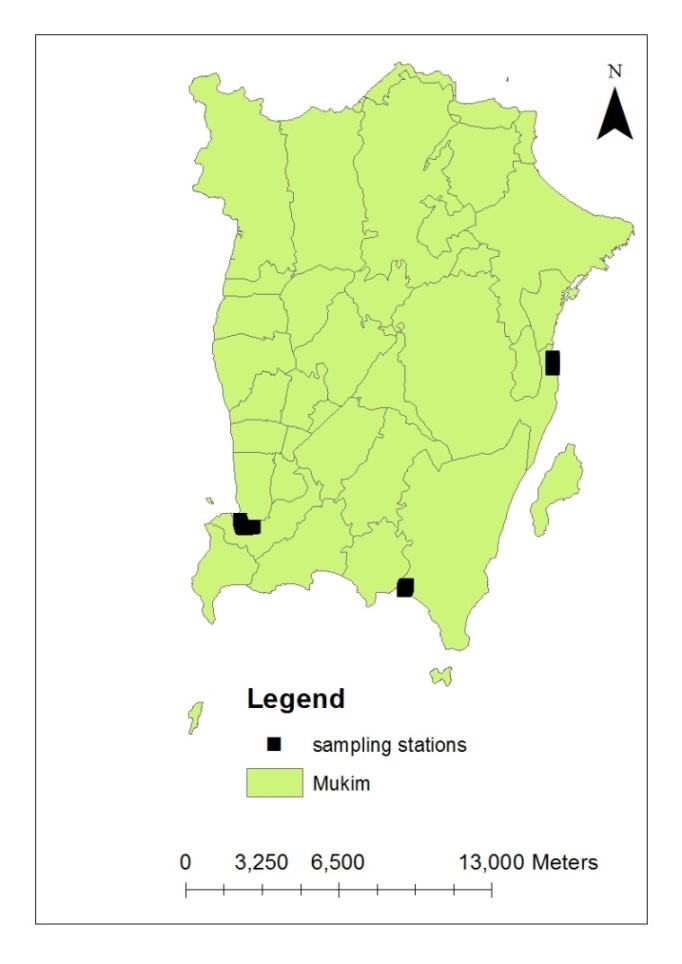
Study Area and Data Collection of Dengue Vector
This study was conducted at Pulau Pinang covering the area of various public premises such as residential area, school area, recreational area and restaurant area. The data of vector were obtained from the surveillance of potential breeding site at the urban, sub-urban and rural areas. The environmental factors that are affecting the potential breeding site in study areas were identified .During the surveillance, the natural breeding sites and artificial sites were studied. The reservoir as types of breeding site was determined by the absence and presence of larvae obtained by using pipette or bailer depending on the reservoir types and study areas. The data of density distribution, type, location, size and condition of the water in the reservoir as a potential breeding site were recorded. The larvae and pupae were collected into the universal bottle with their ecological information and further research was conducted in the laboratory. The mosquito larvae were identified at the species level using the identification keys by (Mattingly, 1967; Slaff & Apperson, 1989). The geographical distributions of the specimen were collected and the mapping of mosquito distribution and dengue risk modelling of every study site were generated by using GIS.
ii. Biotic and abiotic factor
Apart from the geographical data, abiotic and biotic factors (temperature, rain distribution, land use, land cover etc) of urban, sub urban and rural area were measured and analysed to identify the relationship between population density and the diversity of mosquito. The data collected by using GIS throughout the sampling period were used to identify the relationship between the density of mosquito eggs at study sites with the potential breeding site of vector in case of any outbreak in the future.
iii. Data Analysis by GIS Application
a. Database development
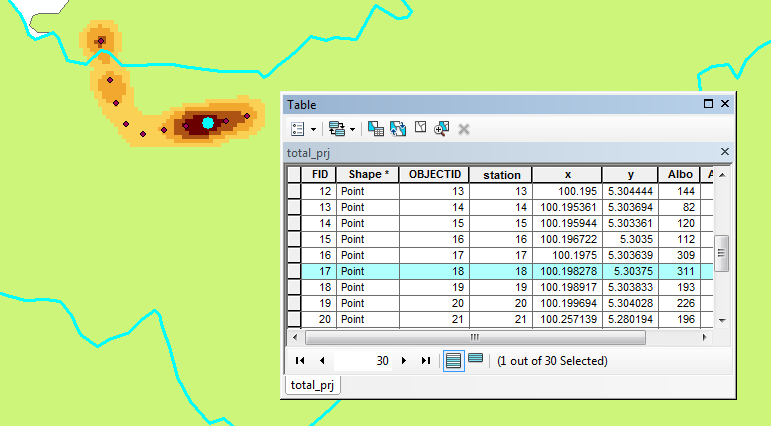
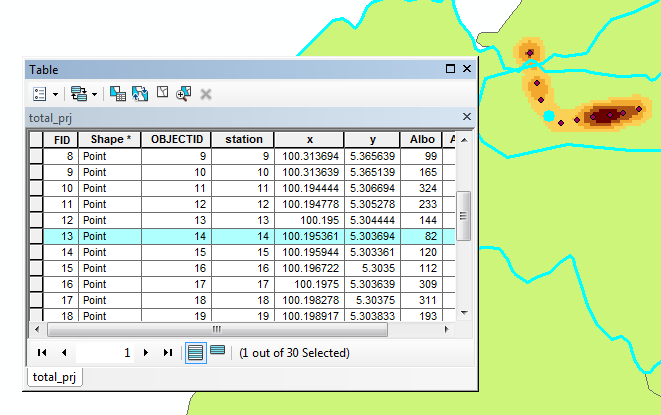
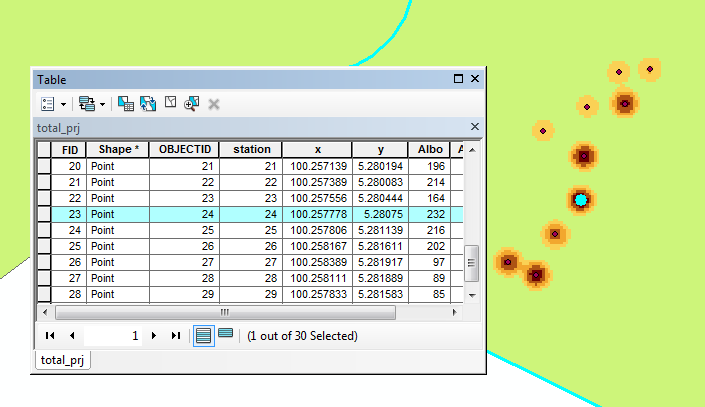
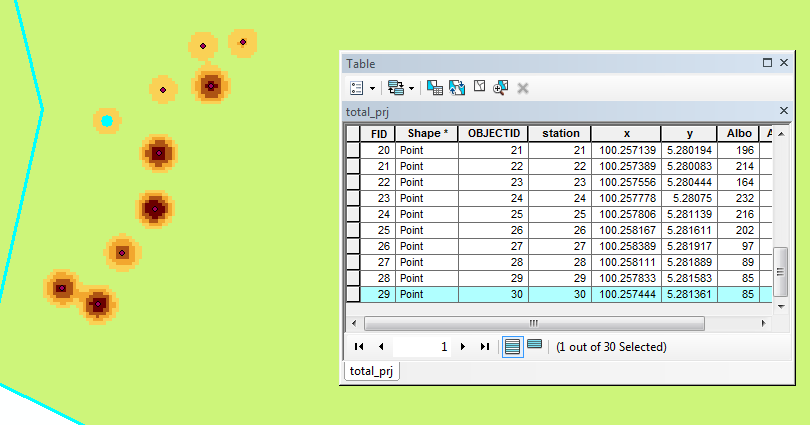
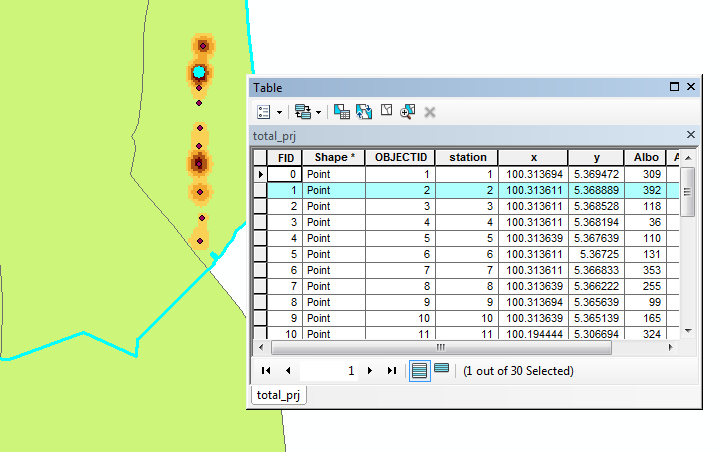
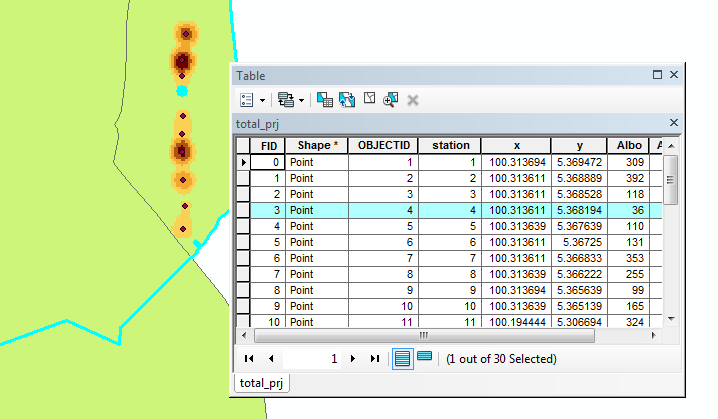
In order to get the data from Global Positioning System (GIS), the location data for the distribution of dengue fever is required. The GPS coordinate system is suitable for analysis application by using ArcGIS 10.1 software. Coordinate data is very important to show the spatial relationship in a location. The geostatistical approach for spatial analysis and mapping were used in this study to identify the relationship between factors affecting the distribution of dengue fever cases in Pulau Pinang. Data obtained from fieldwork were combined with data obtained from related agencies to produce a database by using GIS application that enable collection, storage, analysis and presentation of analysis that are spatial-based.
b. Pattern Distribution of Dengue Fever
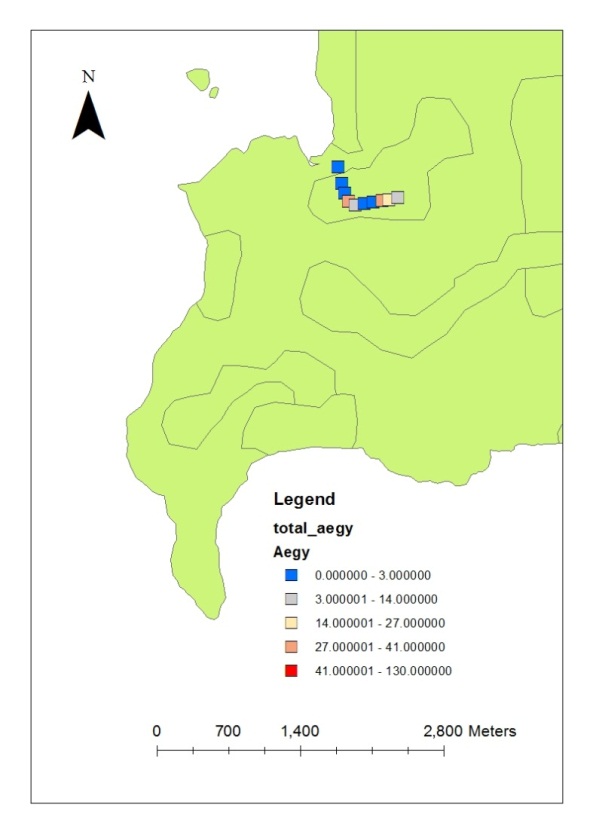
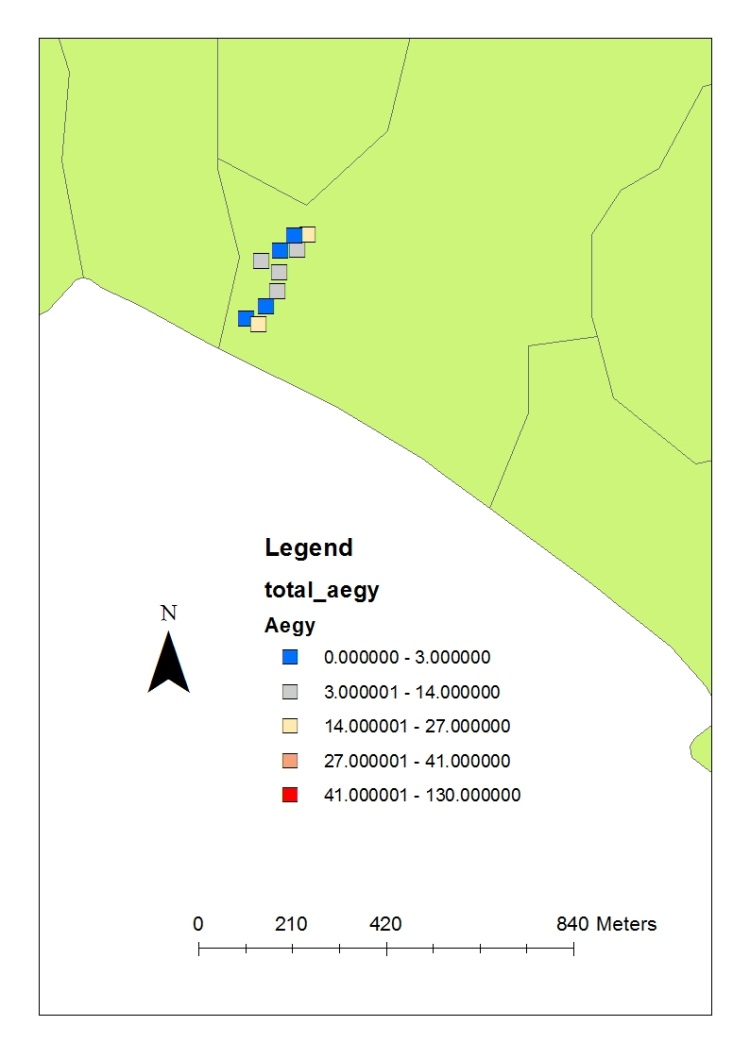
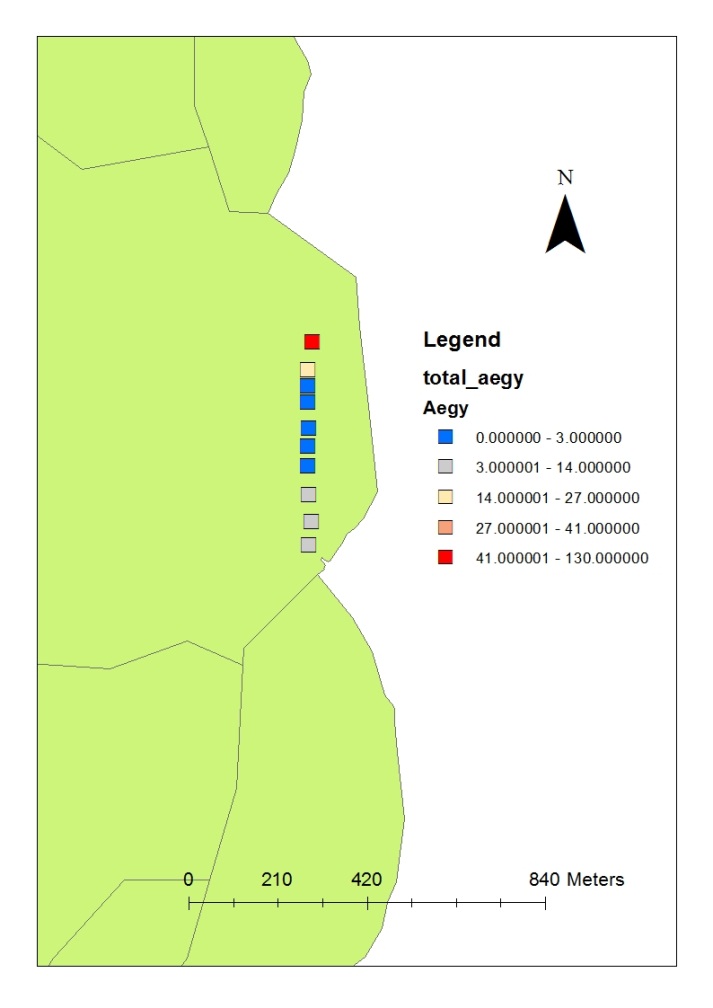
Apart from determining the pattern distribution of dengue cases, GIS analysed the most affected areas of vector-borne disease outbreak based on the number of recorded dengue fever cases. In this case, the spatial analysis in ArcGIS 10.1 software was used by using Kernel density interpolation techniques which allows analysis to be carried out using the data through visual mapping and aid the analysis interpretation.
This analysis was conducted using Getis-Ord Gi statistic that can effectively show the areas with the highest and lowest dengue cases (Jeefoo, Tripathi, & Souris, 2010). This method is the most appropriate technique to determine the potentially high and vulnerable areas with dengue cases according to the result from the mapping (Burrough & McDonnel, 1998). By using this application, the frequency of dengue fever cases and the hotspot areas can easily be predicted (Wen et al., 2006).
Findings
A total of 5616 individuals of
The highest number of
The highest number of
Conclusion
Dengue disease has constantly ascent, transmitted by
During this study , the artificial breeding sites were found highest in abundance compared to natural breeding sites. The finding is consistent with the findings of past studies by Nur Aida (2012) which found 95% articificial breeding sites while only 4.2% of natural breeding sites. The water capacity of each breeding site found also play role to the present of mosquito. Breeding site that contain water capacity <0.5 to >1.5 litre size includes fridge drawers,toilet flush tank, car tires, tank cover, helmet, bird’s drink container, basin , polystrene , and bucket. According to research had been done by Burkot et al., (2007) also show the abundance artificial breeding sites such as tires than natural breeding sites. Besides, natural breeding sites also holding water can be found throughout the study such as plant axil, dry leaves, and coconut shell. Manrique Saide et al. (2008) and Dieng et al. (2010) reported their study found bucket as the most abundant and focal larval breeding sites. Dieng et al (2012) also recorded presence of eggs of
Throughout this study,
The findings acknowledge the breeding site of
Acknowledgments
This study acknowledged the financial supports provided by Research University Grant Universiti Sains Malaysia (1001/PHUMANITI/811324) for financial supports given throughout the research.
References
- Bohra, A., & Andrianasolo, H. (2001). Application of GIS in modeling of dengue risk based on sociocultural data: case of Jalore, Rajasthan, India. Dengue Bull, 25, 92-102
- Burkot, T. R., Handzel, T., Schmaedick, M. A., Tufa, J., Roberts, J. M., & Graves, P. M. (2007). Productivity of natural and artificial containers for Aedes polynesiensis and Aedes aegypti in four American Samoan villages. Medical and veterinary entomology, 21(1), 22-29.
- Burrough, P. A., & McDonnell, R. A. (1998). Principals of Geographical Information Systems. Oxford University Press.
- Carbajo, A. E., Curto, S. I., & Schweigmann, N. J. (2006). Spatial distribution pattern of oviposition in the mosquito Aedes aegypti in relation to urbanization in Buenos Aires: southern fringe bionomics of an introduced vector. Medical and veterinary Entomology, 20(2), 209-218
- Chang, A. Y., Parrales, M. E., Jimenez, J., Sobieszczyk, M. E., Hammer, S. M., … & Kulkarni, R. P. (2009). Combining Google Earth and GIS mapping technologies in a dengue surveillance system for developing countries. International journal of health geographics, 8(1), 49.
- Dieng, H., P. Talukder, T. Satho, Y. Nakashima, N. Kashige, I. N. Nwachukwu, A. …& Rawi., A. H. A. (2010b). Lactobacillus infection related to midgut protein synthesis in the dengue vector Aedes albopictus: Platform of non-symbiont bacteria for the control of Aedes vectors. Journal of Parasitology and Vector Biology, 2(2), 014-021.
- Dieng, H., Rahman, G. S., Hassan, A. A., Salmah, M. C., Satho, T., Miake, F., & Sazaly, A. (2012). The effects of simulated rainfall on immature population dynamics of Aedes albopictus and female oviposition. International journal of biometeorology, 56(1), 113-120.
- Eisen, L., Beaty, B. J., Morrison, A. C., & Scott, T. W. (2009). Proactive vector control strategies and improved monitoring and evaluation practices for dengue prevention. Journal of medical entomology, 46(6), 1245-1255.
- Jeefoo, P., Tripathi, N. K., & Souris, M. (2010). Spatio-temporal diffusion pattern and hotspot detection of dengue in Chachoengsao Province, Thailand.International journal of environmental research and public health, 8(1), 51-74.
- Klowden M. J. (1993). Mating and nutritional state affect the production of Aedes albopictus mosquitoes. Journal of the American Mosquito Control Association, 9, 169-173.
- Gubler, D. J., & Meltzer, M. (1999). Impact of dengue hemorrhagic fever on the developing world. Advances in virus research, 53, 35-70.
- Manrique-Saide, P., Davies, C. R., Coleman, P. G., Rebollar-Tellez, E., Che-Medoza, A., Dzul-Manzanilla, F., & Zapata-Peniche, A. (2008). Pupal surveys for Aedes aegypti surveillance and potential targeted control in residential areas of Merida, Mexico. Journal of the American Mosquito Control Association, 24(2), 289-298.
- Mattingly, P. F. (1967). Taxonomy of Aedes aegypti and related species. Bulletin of the World Health Organization 36, 552-554.
- Morrison, A. C., Zielinski-Gutierrez, E., Scott, T. W., & Rosenberg, R. (2008). Defining challenges and proposing solutions for control of the virus vector Aedes aegypti. PLoS Med, 5(3), e68.
- Nur Aida, H. (2012). Population abundance, distribution, predicting models and breeding habitat ecology of dengue vectors in Penang. (PhD Dissertation), School of Biological Science (USM) 11800 Pulau Pinang, Malaysia
- Seng, S. B., Albert K., Chong, & Moore, A. (2005). "Geostatistical modelling, analysis and mapping of epidemiology of dengue fever in Johor State, Malaysia." The 17th Annual Colloquium of the Spatial Information Research Centre, University of Otago, Dunedin, New Zealand.
- Slaff, M., & Apperson, C. (1989). A key to the mosquitoes of North Carolina and the Mid-Atlantic states. North Carolina State University. Agricultural Extension Service Publication No. AG-412:1-38.
- Website Kementerian Kesihatan Malaysia (KKM), (2015). Retrieved from http://www.moh.gov.my/index.php/database_stores/store_view/17
- Wen, T. H., Lin, N. H., Lin, C. H., King, C. C., & Su, M. D. (2006). Spatial mapping of temporal risk characteristics to improve environmental health risk identification: a case study of a dengue epidemic in Taiwan. Science of the Total Environment, 367(2-3), 631-640.
Copyright information

This work is licensed under a Creative Commons Attribution-NonCommercial-NoDerivatives 4.0 International License.
About this article
Publication Date
23 September 2019
Article Doi
eBook ISBN
978-1-80296-067-9
Publisher
Future Academy
Volume
68
Print ISBN (optional)
-
Edition Number
1st Edition
Pages
1-806
Subjects
Sociolinguistics, linguistics, literary theory, political science, political theory
Cite this article as:
Zulkefli, S. K. R., Rahman, A. A., & Kassim*, N. F. A. (2019). Application Of Geographic Information System On Surveillance Of Dengue Vector In Penang. In N. S. Mat Akhir, J. Sulong, M. A. Wan Harun, S. Muhammad, A. L. Wei Lin, N. F. Low Abdullah, & M. Pourya Asl (Eds.), Role(s) and Relevance of Humanities for Sustainable Development, vol 68. European Proceedings of Social and Behavioural Sciences (pp. 768-778). Future Academy. https://doi.org/10.15405/epsbs.2019.09.83