
Mapping Rice Growing Area In Northern Region Of Peninsular Malaysia Using Gis-Rs

Abstract
Paddy is one of the main contributions to the Malaysia economy among agricultural activities. It yields rice which is the Malaysian staple food. Therefore, it is crucial to monitor rice growing area to maintain its production will continue to sustain. Geographic Information Technologies namely remote sensing (RS) and geographical information system (GIS) can be utilised in monitoring rice growing areas, thus planning and managing the cultivation area. This paper, therefore, aimed to detect and update changes of paddy growing area, and monitor landscape changes in the northern region of Peninsular Malaysia as the study site. Data used is based on four years series of Landsat 7 ETM+ and Landsat 8 OLI/TIRS obtained from United States Geological Survey (USGS). Five types of land cover were identified using maximum likelihood supervised classification method. The findings indicate that rice growing area had decreased significantly. Thus, proper monitoring and planning for rice growing activities are needed in ensuring food security in Malaysia.
Keywords: Land coverLandsat ImageLand usepaddysatellite image
Introduction
Paddy, which produces rice, is one of the most important agricultural activities in Malaysia and remains the third largest crop, next to oil palm and rubber. Paddy field covers about 600,000 hectares of area under cultivation. Two third of rice growing area under cultivation was located in Peninsular Malaysia, where half of it falls under eight major irrigation schemes (Cheong, 1998). Rice, being the staple food in Malaysia, provides a food supply for 28.3 million Malaysian population (Ahmed, & Siwar, 2013). According to Abu and Shah (2013), the National Food Security Policy aims to increase the National Self Sufficiency Level (NSSL) of domestic rice production from 70% in 2010 to 85% by 2015. Such target, the importation of rice from will decrease from 30% to 15% by 2015. In order to achieve that target, Malaysia needs to produce approximately 2.5 million metric tons annually. That can be made through the increase of crop productivity (yield per unit of land; kg/m2) and water productivity (yield per unit of water or “crop per drop”: kg/m3) (Beddington, 2010). More importantly, the size of the rice growing area needs to be protected (Elhadary, Samat, & Obeng-Odoom, 2013). Paddy mapping provides valuable information for many rice monitoring purposes (Shams, 2014). Accurate estimation of rice growing areas provides important information for public authorities, planners, and decision-makers in formulating policies concerning import or export if there is a shortfall and/or surplus of rice (Mosleh, Hassan, & Chowdhury 2015).
At present, however, not many studies have undertaken that estimate the area used for rice farming. Inconsistent records in the Agriculture Department and Farmers Association caused difficulties to quantify areas used for rice farming. Remote sensing, for example, is an ideal tool for vegetation mapping since Landsat imagery which differs in their spatial, spectral and temporal resolutions could provide data for monitoring and quantifying land use activity (Elshorbagy, Imam, & Nour, 2014). The characteristics of Landsat or satellite images allows to differentiate rice growing areas since paddy growing season has four significant activities namely land preparation, planting, growing, and harvesting. Satellite imagery, therefore, can be used to acquire information of the size of paddy parcel, monitor and observe the activities during the growth stage, starting from land preparation to harvest (Pandak, & Sutha, 2014). Also, a satellite-based method could offer approximated data which allows on planting period and/or daily temperature to be gathered for large areas at relatively low cost (Xin, Yu, van Leeuwen, & Driessen, 2002). The aim of this paper, therefore, is to monitor changes in paddy area cultivation in the northern region of Peninsular Malaysia.
Problem Statement
As stated above, rice is an important crop, usually planted in flooded fields. Paddy is a seasonal crop where the area changes into three stages during each growing session. First, planting season where land surface was covered with water at a depth of 2-15cm. Then about 2 months later, most of the fields’ surface is covered by canopies of green rice plants, and then, at the end of the growing period prior to harvesting, leaf and stem moisture content will decrease which consequently makes paddy fields turns to greenish yellow (Wang et al., 2015). Remote sensing has been widely used in monitoring rice growing areas (Kurosu, Fujita, & Chiba, 1997; Oetter, Cohen, Berterretche, Maiersperger, & Kennedy, 2001; Shao et al., 2001). Satellite images of vegetation can provide data on the density of plant growth over the entire world. However, when applying to rice growing area, there might be a confusion of paddy field with other land cover types because, during harvesting period, the reflectance cover newly might be misclassified open field as a new urban area. Besides, build-up and barren lands have similar high reflectance at visible and approximately near to infrared bands. The most standard measurement for vegetation is the Normalized Different Vegetation Index (NDVI) that can be used to differentiate various vegetation covers. According to Weier and Herring (2000), low values (0.1 and below) of NDVI are representing rock, sand or snows. Moderate values (0.2 to 0.3) of NDVI represent grassland and shrub, while high values (0.6 to 0.8) corresponds to the temperate and tropical rainforest (Weier & Herring, 2000). However, when applying to rice growing area, there will be a confusion of paddy field with other land cover types because, during harvesting period, the reflectance cover newly might be misclassified open field as a new urban area. Regarding on these physical features, Wang et al., (2015) proposed the usage of a simple algorithm, that is, Land Surface Water Index Combination (LSWI) with a value less than 0 to be put forward for built-up or barren lands. Then, the frequency of a pixel identified as built-up or barren lands in the Landsat 8 time series was calculated. The study by Shams (2014), for example, proposed the usage of LSWI and NDVI to obtain the final paddy map combination. Similarly, the study by Fang (1998) also used NDVI based land cover use or image classification using administrative boundaries to distinguish rice paddy from another field. Later, Normalized Difference Water Index (NDWI) was used as a measurement for detection of water level in vegetation (Maki, Ishiahra, & Tamura, 2004). Then a comparison between NDVI and NDWI of temporal dynamics and spatial patterns were used to identify water during the flooding period and rice transplanting (Xiao, Boles, Frolking, Salas, Moore, Li, & Zhao, 2002). As shown by Xiao et al. (2002), Maki et al. (2004) and Shams (2014) satellite image was useful in detecting rice-growing areas. MODIS (or Moderate Resolution Imaging Spectro-radiometer) data with high temporal and continuous observation has been integrated with pixel- and phenology-based algorithms to detect paddy field phenology to map growing rice areas or track the intensity of paddy rice fields (Bridhikitti, & Overcamp, 2012). Nevertheless, MODIS-phased phenology information unable to capture the sub-pixel dynamics of small paddy fields in heterogeneous and fragmented agricultural landscapes (Son, Chen, Chen, Duc, & Chang, 2013). Landsat images with 30m spatial resolution could improve requirement detection of paddy rice field. But, further study is necessary to document the combination of satellite images with pixel- and phenology-based algorithms for rice growing areas mapping (Wang et al., 2015).
Research Questions
The research underwent mapping rice growing area using several techniques of remote sensing as proposed by previous researchers to obtain good accuracy of the classified images. Satellite images might have a technical error such as images are covered by clouds which provides limited good satellite image for analysis. The article offers good classification images which are useful in monitoring rice growing mapping area in the Northern Region of Peninsular Malaysia.
Purpose of the Study
Paddy areas in the Northern Region of Peninsular Malaysia have decreased as urban development rise from year to year. Therefore, this article is purposely to monitor rice mapping area using remote sensing and GIS which provides valuable finding to responsible authorities in managing the study area. Satellite images were undergone image classification processes to assess changes in paddy area in the Northern Region of Peninsular Malaysia.
Research Methods
The study was carried out in Northwest Coast of Peninsular Malaysia which involves the state of Kedah, Perlis and Penang. It is located between latitude 5o 05’ N and 7o 23’ N and longitude 99o 38’E and 101o 09'E, with an area approximately 11,369 square kilometres (See Figure
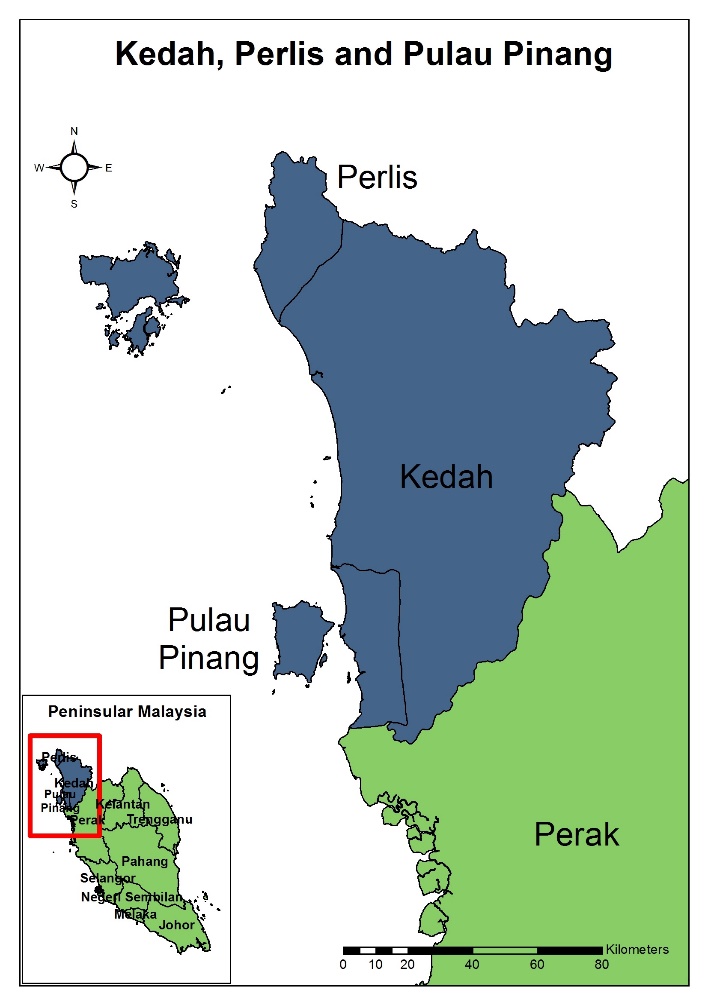
The second reason for selecting the northern region of Peninsular Malaysia is because these areas have the largest rice growing areas in Malaysia. The total areas are 96,558 hectares under Muda Agriculture Development Area (MADA), and 11,000 are under the Irrigated Agriculture Development Project. The area underwent rapid urbanisation since the 1970s. Therefore, it is timely that proper planning and monitoring of rice growing areas to be undertaken to preserve paddy growing areas and ensure national food security (Department of Agriculture, n.d.). Landsat 8 OLI/TIRS and time series Landsat 7 ETM+ satellite remote sensing data obtained from the United States Geological Survey (USGS) were used for this study. Landsat 8 OLI/TIRS was used to obtain data of 2014 whereas Landsat7 ETM+ images were used to acquire data of 2002, 2006 and 2010. Multi-source remote sensing images were used to map paddy rice field. In this study, the multispectral image of remote sensing data was used to identify changes in paddy field areas from the year 2002 to 2014. Thus, time series optical images (Landsat 8 OLI/TIRS and Landsat 7 ETM+) also have been utilised. Landsat image for the year 2002, 2006, 2010 and 2014 have been used and underwent supervised classification since this approach allows identifying of training stage of known class membership in the study areas. Next step is class allocation where cases (e.g. pixels) of unknown class membership were set to the class where they have the maximum similarity with some pre-defined decision rule. Then, the maximum likelihood classification was conducted which allocates each pixel to the class where it has the greatest probability of membership. The last stage of supervised classification is the verification stage, where the accuracy of the classification was evaluated (Foody, 1997). Moisture of land varies during different stages of paddy growth system, thus selecting correct training site is essential to detect the area of paddy rice field. Google Earth and land use data from the Federal Department of Town and Country Planning (FDTCP) North Zone have been used to identify the location paddy rice area. NDVI technique was utilised to identify value given pixel to evaluate the moisture of paddy rice soil site changes during the period. Different values were detected in an area of paddy field. Finally, the accuracy assessment was conducted to validate the image classification.
Findings
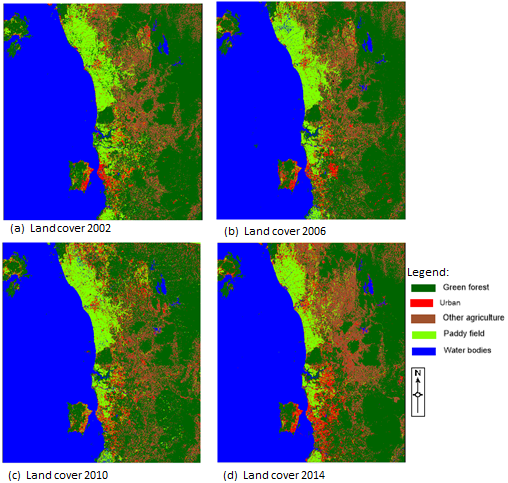
This study used satellite images of 2002, 2006, 2010 and 2014 to map paddy growing areas in the Northern region of Peninsular Malaysia. Based on the image classification undertaken, four land cover maps were produced. Figure
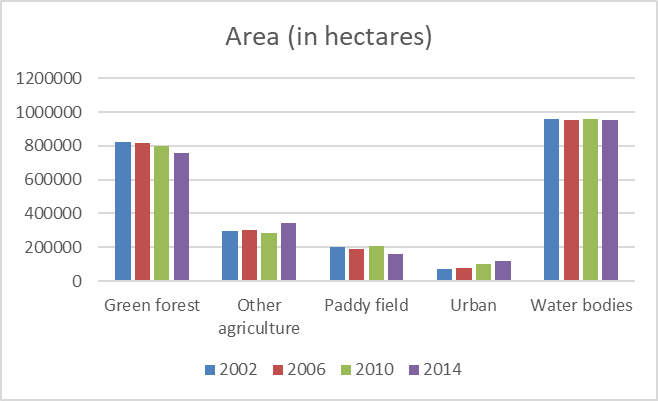
Based on the land cover map generated from image classification, land cover comprised of 5 classes namely green forest, urban, other agriculture, paddy, and water bodies was produced. Figure
Patch Analyst
Based on the images generated through the supervised classification, landscape changes of each class (represented by each land cover) were calculated using patch analyst tool. Patch Analyst is an extension tool of a GIS system that assists the spatial analysis of landscape patches (Malinowski & Szumacher, 2013). This study investigated each landscape changes to identify the pattern of land cover in the study areas. There were three characteristics calculated from the patch analyst tool namely mean shape index (MSI), mean patch size (MPS) and number of patches (NumP). The result is as shown in Table
As shown in Table
Conclusion
The study proved that remote sensing and geographical information system could provide valuable information for monitoring the paddy cultivation area. Furthermore, it helps agency or planner to make the right decision for future generation food security. Increasing our cultivation productivity prolonged our economic rate, but if it not handled with the right plan, it will give a negative impact on land use, such as flash flood and pollutions. Even though Malaysia still has a minimum negative impact from such a threat, preparation should be done to avoid future damage.
On the other hand, local authorities should also be aware of the encroachment of development into the paddy field area due to the cheaper paddy field value that developers can have to develop. Beside of strict act to protect paddy field conversion to development land, local authorities should give more support to paddy field's owner in cultivating their paddy field so that they will hesitate in selling their valuable land to developers.
Finally, remote sensing multispectral data provide signal reflectance value to investigate feature on the image. These production work from Landsat image, are faster rather than conventional practice. Besides, planners can upgrade their map data and perform necessary actions to keep paddy fields in good condition for rice production. Improvement in data quality and applying knowledge will bring a desirable result for future benefit.
Acknowledgements
The authors wish to thank the Ministry of Higher Education (MoHE) for funding the research through the Fundamental Research Grant Scheme (FRGS) grant number 203/PHUMANITI/6711472, and also wish to thank the Universiti Sains Malaysia for providing facilities to undertake this research.
References
- Abu, M. R., & Shah, M. D. M. (2013). Food and livelihood security of the Malaysian paddy farmers. Economic and Technology Management Review, 8, 59-69.
- Ahmed, F., & Siwar, C. (2013). Food security status, issues and challenges in Malaysia: a review. Journal Food, Agriculture and Environment (JFAE), 11(2), 219-223.
- Beddington, J. (2010). Global food and farming futures. Philosophical Transactions of the Royal Society of London. Series B, Biological Sciences, 365, 2767-2767. DOI: 10.1098/rstb.2010.018.
- Bridhikitti, A., & Overcamp, T. J. (2012). Estimation of Southeast Asian rice paddy areas with different ecosystems from moderate-resolution satellite imagery. Agriculture, Ecosystems & Environment, 146(1), 113-120.
- Cheong, A. W. (1998). Direct seeded rice in Malaysia: a success story. Asia-Pacific Association of Agricultural Research Institutions (APAARI) Publication. Retrieved from http://www.apaari.org/publications/apaari-success-stories/success-story-direct-seeded-rice-malaysia.html
- Department of Agriculture – DOA (n.d.). Keluasan bertanam dan pengeluaran padi mengikut kawasan jelapang padi, 2007 - 2011, [In Bahasa]. Retrieved from http://www.doa.gov.my/c/document_library/get_file?uuid=e26b2146-57c7-409c-9c970c710035ffbb&groupId=38371
- Department of Agriculture - DOA (2013). Perangkaan Padi Malaysia. [In Bahasa]. Retrieved from http://www.doa.gov.my/c/document_library/get_file?uuid=cef1fc5b-0adf-437da80ef3136ee8b968&groupId =358510
- Department of Statistics (2010). Population distribution and essential demographic characteristics. Department of Statistics, Malaysia. Retrieved from https://webcache.googleusercontent.com/search?q=cache:XwZa1pVdaUJ:https://www.dosm.gov.my/v1/index.php%3Fr%3Dcolumn/ctheme%26menu_id%3DL0pheU43NWJwRWVSZklWdzQ4TlhUUT09%26bul_id%3DMDMxdHZjWTk1SjFzTzNkRXYzcVZjdz09+&cd=1&hl=en&ct=clnk
- Elhadary, Y. A. E., Samat, N., & Obeng-Odoom, F. (2013). Development at the peri-urban area and its impact on agricultural activities: an example from the Seberang Perai Region, Penang State, Malaysia. Agroecology and Sustainable Food Systems, 37(7), 834-856.
- Elshorbagy, A., Imam, E., & Nour, M. (2014). Rice area and probable transplanting dates trends mapping through a remote sensing based model. Proceedings from ASPRS 2014 Annual Conference: Geospatial Power in Our Pockets, Co-Located with Joint Agency Commercial Imagery Evaluation Workshop, JACIE 2014. Louisville, Kentucky, USA.
- Fang, H. (1998). Rice crop area estimation of an administrative division in China using remote sensing data. International Journal of Remote Sensing, 19(17), 3411-3419.
- Foody, G. M. (1997). Fully fuzzy supervised classification of land cover from remotely sensed imagery with an artificial neural network. Neural Computing & Applications, 5(4), 238-247.
- Kurosu, T., Fujita, M., & Chiba, K. (1997). The identification of rice fields using multi-temporal ERS-1 C band SAR data. International Journal of Remote Sensing, 18(14), 2953-2965.
- Maki, M., Ishiahra, M., & Tamura, M. (2004). Estimation of leaf water status to monitor the risk of forest fires by using remotely sensed data. Remote Sensing of Environment, 90(4), 441-450. DOI:
- Malinowski, E., & Szumacher, I. (2013). Application of landscape metrics in the evaluation of geodiversity. Miscellanea Geographica - Regional Studies on Development, 17(4), 28-33. DOI: 10.2478/v10288-012-0045-y
- Mosleh, M. K., Hassan, Q. K., & Chowdhury, E. H. (2015). Application of remote sensors in mapping rice area and forecasting its production: a review. Sensors, 15(1), 769-791.
- Oetter, D. R., Cohen, W. B., Berterretche, M., Maiersperger, T. K., & Kennedy, R. E. (2001). Land cover mapping in an agricultural setting using multiseasonal Thematic Mapper data. Remote Sensing of Environment, 76(2), 139-155.
- Pandak, I. B., & Sutha, V. (2014). The Malaysian Department of Agriculture has adopted innovative rice mapping solutions which helped it in the overall production of paddy. GIS for Rice Field Management. Retrieved from http://geospatialworld.net/Magazine/MArticleView.aspx?aid=31089
- Shams, S. B. (2014). Automatic paddy rice mapping interface using Arcengine and LANDSAT 8 Imagery (case study in North Part of Iran). The International Archives of Photogrammetry, Remote Sensing and Spatial Information Sciences, 40(2), 79-83. DOI:
- Shao, Y., Fan, X., Liu, H., Xiao, J., Ross, S., Brisco, B., & Staples, G. (2001). Rice monitoring and production estimation using multitemporal RADARSAT. Remote Sensing of Environment, 76(3), 310-325.
- Son, N. T., Chen, C. F., Chen, C. R., Duc, H. N., & Chang, L. Y. (2013). A phenology-based classification of time-series MODIS data for rice crop monitoring in Mekong Delta, Vietnam. Remote Sensing, 6(1), 135-156.
- Wang, J., Xiao, X., Qin, Y., Dong, J., Zhang, G., Kou, W., & Zhang, Y. (2015). Mapping paddy rice planting area in wheat-rice double-cropped areas through integration of Landsat-8 OLI, MODIS, and PALSAR images. Scientific reports, 5, 1-11. DOI:
- Weier, J., & Herring, D. (2000). Measuring vegetation (ndvi & evi). NASA online publication. Retrieved from https://earthobservatory.nasa.gov/Features/MeasuringVegetation/
- Xiao, X., Boles, S., Frolking, S., Li, C., Babu, J.Y., Salas, ... & Moore, B. (2006). Mapping paddy rice agriculture in South and Southeast Asia using multi-temporal MODIS images. Remote Sensing of Environment, 100(1), 95-113. DOI:
- Xiao, X., Boles, S., Frolking, S., Salas, W., Moore, B., Li, C.,... & Zhao, R. (2002). Observation of flooding and rice transplanting of paddy rice fields at the site to landscape scales in China using VEGETATION sensor data. International Journal of Remote Sensing, 23(15), 3009-3022.
- Xin, J., Yu, Z., van Leeuwen, L., & Driessen, P. M. (2002). Mapping crop key phenological stages in the North China Plain using NOAA time series images. International Journal of Applied Earth Observation and Geoinformation, 4(2), 109-117. DOI: 10.1016/S0303-2434(02)00007
Copyright information

This work is licensed under a Creative Commons Attribution-NonCommercial-NoDerivatives 4.0 International License.
About this article
Publication Date
23 September 2019
Article Doi
eBook ISBN
978-1-80296-067-9
Publisher
Future Academy
Volume
68
Print ISBN (optional)
-
Edition Number
1st Edition
Pages
1-806
Subjects
Sociolinguistics, linguistics, literary theory, political science, political theory
Cite this article as:
Maprasulle, S. A., Mahamud*, M. A., Samat, N., & Noor, N. M. (2019). Mapping Rice Growing Area In Northern Region Of Peninsular Malaysia Using Gis-Rs. In N. S. Mat Akhir, J. Sulong, M. A. Wan Harun, S. Muhammad, A. L. Wei Lin, N. F. Low Abdullah, & M. Pourya Asl (Eds.), Role(s) and Relevance of Humanities for Sustainable Development, vol 68. European Proceedings of Social and Behavioural Sciences (pp. 46-54). Future Academy. https://doi.org/10.15405/epsbs.2019.09.5