
Assessing The Technology Development Level In The Field Of Education

Abstract
Information technologies, which are widely implemented in educational institutions, have a significant impact on all aspects of the educational process. They change the basis of teaching methodology, expand the educational space, increase the variety of forms of education, have a significant impact on children's social engagement. In this regard, the challenge of outlining the education-related technology scope and proposing an appropriate development assessment method is of relevance. Despite the widespread introduction of information technology in the educational process, this issue has not yet been given due attention. This paper considers the development of a technology selection and assessment method based on the integral index generally determining the level of technology development in education. From the perspective of unbiased assessment, the procedures for selecting indicators and assigning weights thereto when calculating the integral index are decisive. When selecting, only those indicators are considered which characterize a limited scope of technology referred to as the most significant for the field in question, with the choice of weights reduced to the process of aligning the average values of indicators. The results of testing the method, as exemplified through assessing the technology development level of the basic education segment in the field of basic education, show the correlation of the technology development level with the region-based social and economic development level and the relationship with the volume of government spending on education, which justifies the application of the above-listed procedures and the method as a whole in assessing.
Keywords: Technology development leveleducationassessment methodology
Introduction
At present, special attention is paid to the issues of technology development. Despite the fact that it is largely dependent on whether the institutional environment has matured, which used to limit the wide use of technology for a number of reasons (from unsettled legislation in the sphere of intellectual property protection, unfair competition, etc. to the prominent role of the shadow economy sector and authoritarian government) and is still immature in developing countries, all countries, without exception, attribute the economic and competitive growth to new technology introduction. This results in the emerging relevance of assessing the field-specific technology development, which is difficult to face due to the fact that each field employs its "in-house" technologies, their use is global, they vary in relevance, yet the integral assessment of the technology development level as a whole is required.
Problem Statement
Currently, the overwhelming number of studies into the subject covers the development of approaches and methods for assessing the technology development level in the economic domain (from businesses, industries of the economy to the regions and the country as a whole), which can be conditionally divided into two groups: 1) systemic, which consider the problem in a broader sense and give general recommendations (Fedotova, 2016; Tyurina, Seliverstova, Lavrenko, Samorukov, & Kalmykova, 2018); 2) highly specialized, limited to the proposal of a method for assessing a specific economic area like, for example, the agricultural sector (Siptits, 2017); timber industry (Belyakov & Pokonov, 2016); enterprise (Shtepa, 2016), etc. The above-listed papers describing both groups, as well as most of the other studies not mentioned here, feature the lack of a clear criterion to rely on in selecting indicators to assess the technology development level: indicator selection options proposed in the first group of works are too abstract, in the second – specialized, the first ones lacking specificity, the second – universality. This, by and large, makes it impossible to follow these approaches in various spheres of activity in reliance on a unified principle, and employ them in the humanitarian domain which, without limitation, includes education.
In turn, no widely used mathematical methods of attribute space reduction (principal component analysis, factor analysis, center of gravity method, etc.) can be applied, either, due to the complexity of formalizing the quality-to-technology dependence in education.
Thus, we need a method which is not linked to the specifics of a particular area and incorporates certain unified principles of work, eliminating the deficiencies of the above approaches
Research Questions
Everything which is not related to art or personal skills can be attributed to technology in the broadest sense of the word. However, an assessment of the technology development level with the widest possible coverage makes no sense for practical reasons. Long-used technologies fail to improve the comparability process due to their widespread adoption, with their contribution to the assessment considered as an undescriptive "dead load". In addition, the use of an increasing number of indicators to be considered in practical calculations with the weights (significance) allowing for their setting in different ways (based on the opinion of experts, taken equal or based on any logical conclusions), enhances the likelihood of biased assessments. If we assume that assessments are equally likely to be biased towards one or another direction, while an unbiased assessment is their average, then with an increase in the number of indicators, the probability of obtaining an incorrect assessment increase.
If one tries to make an assessment based only on their technical component, which is often done because the quantitative assessment of "tangible" technologies is the simplest way to follow, such an assessment will not be balanced due to the lack of accounting for the contribution of "intangible" technologies: personnel management, organization of the production process (sales, training, medical treatment, etc.), quality control (of products, services), motivation and incentives for employees, etc., which may be no less important in the field of activity under investigation.
From this, we can conclude that the main problem in handling this challenge is to find a set of indicators inherent only in a limited scope of technologies that would allow determining the technology development level as a whole. The second related problem, although less significant, is the determination of indicators' weights (significance). The choice of an assessment method is not a problem itself due to the wide application of the procedure for calculating the integral indicator (index) through weight summation of the selected indicators.
Purpose of the Study
In this paper, an attempt is made to develop a method for assessing the technology development level, which incorporates a criterion for indicator selection and a procedure for determining weight coefficients as necessary components of the methodology potentially applicable to various fields of activity, including the humanities, and education in particular.
Research Methods
This paper, as seen in the above reasoning, proposes a method for selecting indicators based on the analysis of field-specific target indicators, towards which technologies work directly or at first-hand. The term "target" is applied to them meaning that the essential assessment of the domain in question is based on their values and dynamic pattern, and therefore, their values operate as the targets to achieve. The rest of technologies that affect target indicators indirectly can be attributed to the potential ones, whose accounting, no environment for their implementation available and, thus, no influence exerted on targets, leads to an exponential error growth (normally, to overestimation) or can even be misleading. An example would be the method of calculating the Global Innovation Index (2018) (GII) or the similar European Innovation Index (European Innovation Scoreboard, 2018), whose purpose is to determine the innovation level by country. When calculating the GII, a number of indicators are considered, including the education level of the population. Obviously, this indicator affects the growth of innovation, though not directly, as, if we isolate a significant part from the definition of innovation, namely: "innovation is a new product which, if introduced into production, has led to a certain positive effect," the indicator of education would operate as a potential factor, only. And if no environment available for this potential to be unlocked (no need for qualified personnel, inadequate remuneration, unfavorable social environment, etc.), taking this indicator into account leads to overestimation. And if educated people unlock their potential in another country, which routinely happens, this error goes into the category of "misleading."
When selecting indicators meant to characterize only relevant technologies, the close relationship between technology and innovation should be borne in mind: both technologies and innovations are related to the "new product" and "positive effect" concepts, while innovations, in turn, arise on the basis of new technologies introduced. This can add to the limitation criterion and narrow the list to indicators inherent only in those technologies whose impact leads to changes in the domain under consideration. This allows focusing on identifying current trends in the assessment.
Despite the fact that the division of technologies into those acting "directly" and "indirectly" is rather conditional, the above approach to indicator selection allows limiting their set to the most significant and characteristic of the development level of the technologies which are considered essential and relevant today and directly affect the target indicators. Taking other technologies into account because of the above arguments generally fails to lead to an improvement in the assessment or even contains a potential risk of its worsening, which entails negative consequences difficult to identify and mitigate.
Based on the above approach to accounting technology selection, we determine which indicators of the general education level are the target ones.
From the review of papers on development prospects in education and the identification of main trend recently shaped (Bespalko, 1989; Saburov, 2014; Chuprasova, 2000; Annual report of the Russian Government on the implementation of the state policy in the field of education in 2017, 2018; Balcerzak, 2016), we can say that the modern education system is becoming increasingly focused on educational process individualization, its integration within and outside formal education, blurring of the boundaries between the educational process and real life. Their implementation is facilitated by the following "architecture" (Table
According to the papers (Pressing challenges of Modern Education: Experience and Innovation, 2017; Tondeur, van Braak, Ertmer, & Ottenbreit-Leftwich, 2017; Kruss, McGrath, Petersen, & Gastrow, 2015; Alekhina, Konobeeva, Konobeeva, Simonova, & Stepanova 2018), in the post-non-classical didactics (this is where the challenges of developing methods, contents, and learning belong to), the educational process is considered as a "systematic and consistent practical implementation of the designed educational process to be implemented in technological processes," which in this case should include pedagogical technologies. Thus, if we consider indicators showing the degree of educational process individualization and its integration within and outside school as the target ones, then these indicators are directly affected by the pedagogical technologies implemented within the framework of the above "architecture", that is, designed to meet the challenges of creating universally accessible educational resources and organizing access to them.
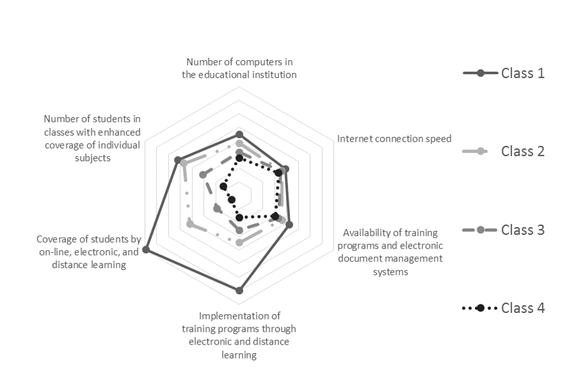
Among the indicators that characterize the technologies that directly affect the way these problems are solved, the following have been selected, which are normalized by the number of students (individual indicators on the number of educational institutions) to ensure the comparability of regions.
Availability of computers (including those with access to the Internet).
The indicator is calculated as the number of computers (including those with access to the Internet) in educational institutions normalized by the number of students according to the formula as follows:
(1)
where
– number of computers in the educational institution;
– total number of students.
Internet connection speed.
The indicator is calculated as the sum of the weighed shares of educational institutions in their totality with varied Internet connection speed (as per the gradation highlighted in the statistical data provided), according to the formula as follows:
, (2)
where
– share of organizations in their totality with access to the Internet at speeds up to 1 Mbit/s (1-30 Mbit/s, 30-100 Mbit/s, over 100 Mbit/s);
Availability of training programs and electronic document management systems.
The indicator is calculated as the number of training programs and electronic document management systems normalized by the number of organizations according to the formula as follows:
(3)
where
– number of computer training programs on specific subjects or topics;
– number of electronic document management systems;
Implementation of training programs through electronic and distance learning.
The indicator is calculated as the number of programs of electronic and distance learning normalized by the number of students according to the formula:
(4)
where
– number of implemented programs of electronic and distance learning;
– total number of students.
Coverage of students by on-line, electronic, and distance learning.
The indicator is calculated as the weighed sum of the share of students mastering on-line, electronic and distance learning programs in their totality according to the formula:
, (5)
where
– share of students mastering on-line training programs (the share of students mastering e-learning programs, the share of students employing distance learning technologies) in the totality of students.
The weight coefficients have been chosen considering the greater importance of on-line forms of learning against other forms: 1 – on-line training, 0.5 – other forms of training, as selected by experts.
Number of students in classes with enhanced coverage of individual subjects.
The indicator is calculated as the number of students in classes enhanced coverage of individual subjects, normalized by the total number of students, according to the formula:
(6)
where
– number of students in classes with enhanced coverage of individual subjects;
To reduce the data to a single scale of values ranged 0 to 100, all the indicators are normalized by their maximum value according to the formula:
,(7)
where
– current value of the j-th indicator of the k-th constituent entity of the Russian Federation;
– maximum value of the
where 100 corresponds to the best result, the remaining values reflecting the degree of discrepancy (lag) against the best result in percentage terms.
The method of weighted summation of normalized indicators according to the below formula has been chosen to calculate the integral index:
, (8)
where
– current value of the j-th indicator of the k-th constituent entity of the Russian Federation, substituted from formula (7);
– weight coefficient for the j-th indicator;
The values of weight coefficients, given the non-obvious priority of some indicators over others, have been set as being of equal significance. Since the normalized values of different indicators have been grouped around different values of averages, which for the vast majority of Russia's constituent entities (hereinafter, the constituent entities of the Russian Federation or regions) will be expressed in their unequal accounting, the alignment procedure has been applied, in which the weights are set so that the average values of the products of the initial values and weight coefficients of each indicator are equal to the average calculated from the initial values of all indicators.
In accordance with this rule, weight coefficients have been calculated using the following formula:
,(9)
where
The technology development level of the general education sector of the general education domain have been assessed by the above algorithm, which incorporates procedures for selecting indicators based on how significant they are in terms of affecting the domain's targets and on their normalization by the maximum value, along with accounting in the integral index with equal weights (significance).
Findings
The results of assessing the technology development level by the constituent entities of the Russian Federation are given in Table
According to the Table, the technology development levels of the domain under study differ significantly by the constituent entities of the Russian Federation: in the Chechen Republic, which is at the bottom, it is five times lower than in the city of Moscow. The partitioning analysis of indicators shows that the region-based differentiation is mainly determined by the difference in the indicators "Implementation of training programs through electronic and distance learning" and "Coverage of students by on-line, electronic, and distance learning" (Indicators 4, 5) with relatively equal values of other indicators. Figure
Figure
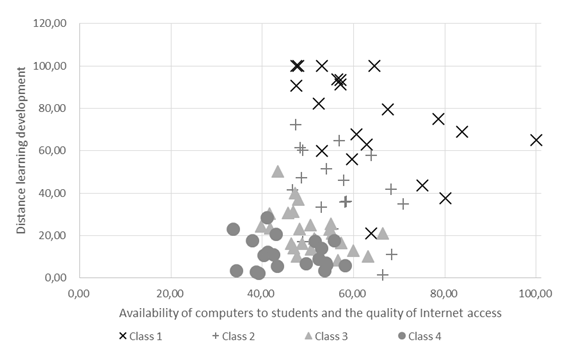
The Figure clearly shows that the growth of distance learning technologies is not determined by the number of computers or the speed of Internet connection, and we can say that a higher level of technology development is by and large achieved where the availability of tangible resources is supported by efforts focused on their effective use. In this case, the focused efforts may involve various activities from the development of solutions relied upon the awareness of how significant these training forms are to their implementation into life.
It is logical to assume that both tangible resources and the efficiency of organizational work are related to the level of socioeconomic development of the region and the volume of government spending on education. Figures
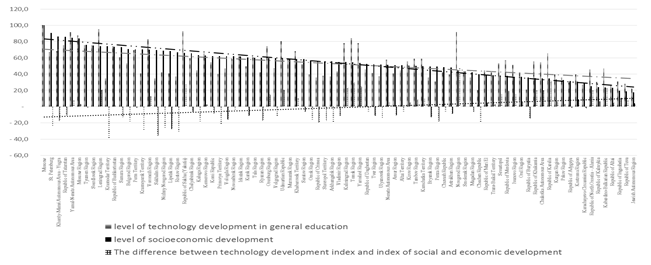
In Figure
In Figure
According to the uniform distribution of the education financing index, it can be said that, on average, the level of technology development in the field of education does not have a clear direct dependence on funding. This, as noted earlier, reflects the fact that the regions do not differ significantly in terms of tangible security and their differentiation is mainly due to differences in the level of introduction of distance learning technologies, which does not require much funding. The values of differences in these indicators, which, as well as in the graph in Figure
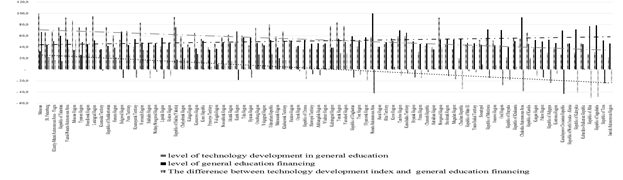
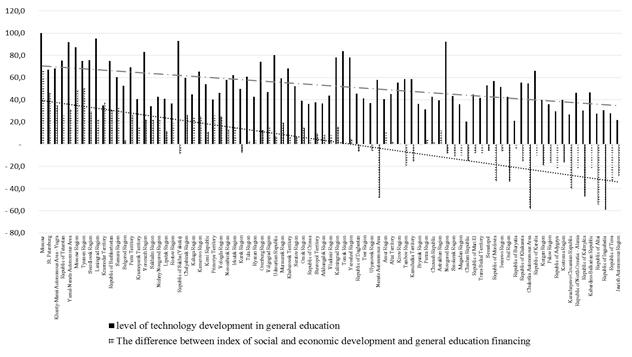
The Krasnodar Region and the Sakhalin Region, are out of the picture again, which have already been noted earlier as having a lower level of technology development in the education field vs. the level of their social and economic development. That is, these regions in both cases deviate from the patterns generally accepted: their level of technological development does not correspond to the level of socioeconomic development, but in contrast to their neighbors on the rating scale of the technology development level, they invest less in the field of education.
Conclusion
The algorithm developed to assess the level of technology development, which includes the method of selecting indicators characteristic of a limited number of significant technologies for the field under consideration, and the method of their integration in the calculation of the generalized index, allow making assessments in any field of activity, based on a single approach. Despite the complexity of result interpretation, which is indicative of the technology development assessment in education in terms of their objectivity due to the novelty of the problem and the lack of results previously obtained employing another techniques, the assessment results are satisfactory from the perspective of their correlation with socioeconomic development and the level of financing in education, which justifies the application of the above procedures and the method as a whole in the assessment. Deviations of individual regions assessed from the general patterns are not indicative of any assessment errors, but rather reflect the effect of hidden factors identified through contradictions, which can be attributed to the additional benefit of employing the method.
Acknowledgments
The study has been made as part of State Assignment of the Institute for Strategy of Education Development of the Russian Academy of Education No. 073-00086-19-01 for 2019 and the planning period of 2020 and 2021. Project title: «The Statistical Assessment of Technology Development Level in Education».
References
- Alekhina, T. A., Konobeeva, O. E., Konobeeva, E. E., Simonova, E. V., & Stepanova, M. A. (2018). The Main Tendencies and Directions of State Policy in the Sphere of Technological Development of Russia. ISC 2018: The Future of the Global Financial System: Downfall or Harmony, pp. 765–773.
- Annual report of the Russian Government on the implementation of the state policy in the field of education in 2017. (2018). Retrieved from: http://government.ru/news/32737/
- Balcerzak, A.P. (2016). Multiple-Criteria Evaluation of Quality of Human Capital in the European Union Countries. Economics and Sociology, 9(2), 11–26.
- Belyakov, G.P., & Pokonov, A.A. (2016). Uroven' tekhnologicheskogo razvitiya predpriyatij lesopromyshlennogo kompleksa i metodicheskie podhody k ego ocenke [The Technology Development Level of Timber Processing Businesses and the Methodological Approaches to its Assessment]. Society: Politics, Economy, Law [in Rus.].
- Bespalko, V.P. (1989). Slagaemye pedagogicheskoj tekhnologii [Pedagogical Technology Components]. Moscow: Pedagogika, [in Rus.].
- Chuprasova, V.I. (2000). Sovremennye tekhnologii v obrazovanii [Modern Technologies In Education]. Vladivostok: Far East State University, Pacific Institute of Distance Education and Technology [in Rus.].
- European Innovation Scoreboard (2018). Retrieved from: https://www.ewi-vlaanderen.be/sites/default/files/imce/eu_innovatie_scorebord_2018.pdf
- Fedotova, A.Yu. (2016). Analiz metodik ocenki innovacionnogo i tekhnologicheskogo potenciala regionov v kontekste razvitiya dinamicheskih sposobnostej territorial'no-otraslevyh kompleksov [Analysis of Assessment Methods for the Innovative and Technological Potential of Regions in the Context of Developing Dynamic Abilities of Territorial and Industrial Complexes]. Modern Research and Innovations, 10. Retrieved from: http://web.snauka.ru/issues/2016/10/72217. [in Rus.].
- Global Innovation Index (2018). Retrieved from: https://www.globalinnovationindex.org/ (accessed: 01.02.2019).
- Kruss, G., McGrath, S., Petersen, Il-haam, & Gastrow, M. (2015). Higher education and economic development: The importance of building technological capabilities. International Journal of Educational Development, 43, 22–31. DOI:
- Pressing challenges of Modern Education: Experience and Innovation (2017). Materials of the international research-to-practice conference (virtual). Ulyanovsk. Retrieved from: http://40414-001.edusite.ru/DswMedia/actual_probl_obraz_17.pdf.
- Rejting social'no-ekonomicheskogo polozheniya sub"ektov RF po itogam 2017 goda) [The level of socioeconomic development] (2018). Retrieved from http://vid1.rian.ru/ig/ratings/rating_regions_2018.pdf [in Rus.].
- Saburov, Kh.M. (2014). Vliyanie osnovnyh tendencij razvitiya sovremennogo obrazovaniya na formirovanie lichnosti uchashchihsya [The Way the Main Trends of the Modern Education Development Influence the Formation of Student Personality]. Fundamental Research, 3(3), 613–616. [in Rus.].
- Siptits, S.O. (2017). Methods to Assess the State and Technology Development Trends of Russia's Agriculture. Agribusiness: Economy, Management. Autonomous Nonprofit Organization.
- Shtepa, M.V. (2016). Ocenka tekhnicheskogo razvitiya predpriyatij v usloviyah konkurencii [Assessing the Technology Development of Businesses in a Competitive Environment]. Russian Entrepreneurship, 5(227), 33–40. Retrieved from: http://bgscience.ru/lib/8019/ [in Rus.].
- Tondeur, J., van Braak, J., Ertmer, P. A., & Ottenbreit-Leftwich, A. (2017). Understanding the Relationship Between Teachers’ Pedagogical Beliefs and Technology Use in Education: a Systematic Review of Qualitative Evidence. Educational Technology Research and Development, 65(3), 555–575. DOI:
- Tyurina, Yu.G., Seliverstova, N.I., Lavrenko, E.A., Samorukov, A.A., & Kalmykova, M.A. (2018). Metodicheskij instrumentarij kompleksnoj ocenki nauchno-tekhnologicheskogo razvitiya regiona [Methodological Tools for the Integrated Assessment of Region-Based Scientific and Technological Development]. Regional Economy, 112. [in Rus.].
Copyright information

This work is licensed under a Creative Commons Attribution-NonCommercial-NoDerivatives 4.0 International License.
About this article
Publication Date
30 September 2019
Article Doi
eBook ISBN
978-1-80296-068-6
Publisher
Future Academy
Volume
69
Print ISBN (optional)
-
Edition Number
1st Edition
Pages
1-1054
Subjects
Education, educational equipment, educational technology, computer-aided learning (CAL), Study skills, learning skills, ICT
Cite this article as:
Shamsutdinov*, Y. A., Lebedev, K. V., & Bochkovskiy, P. P. (2019). Assessing The Technology Development Level In The Field Of Education. In S. K. Lo (Ed.), Education Environment for the Information Age, vol 69. European Proceedings of Social and Behavioural Sciences (pp. 773-788). Future Academy. https://doi.org/10.15405/epsbs.2019.09.02.87