
Seepage Analysis Of Satpara Dam (Pakistan)

Abstract
The embankment dams or fill-type dams are constructed of earth and rock-fill material respectively. The earth-fill dams are self-effacing structures which can avert the overturning and sliding because of their self-weight. The causes of failure of earth-fill dams may be seepage failure, hydraulic failure, structural failure, piping through dam body, and due to the earthquake (
Keywords: “Satpara Dam”“Seepage analysis”“GeoStudio SEEP/W”“Electricity production”
Introduction
General
Seepage Analysis is mainly concerned with water leakage from a contained source, generally a pool, a tank, a dam or similar structures, into the surrounding soil (Calgary, 2012). It involves spotting the source of the leak and scheming a solution to fix the problem. In dam’s, seepage is a phenomenon related to every embankment and cannot be eliminated as the impounded water seeks paths of least resistance but can be reduced and controlled. Seepage of water through, around or under the dam is anticipated in all embankment dams, and even the concrete gravity dams are come across with the same problem. The quantity of seepage, the flow path of seeping water, and its velocity are of great concern in analysing the structural behaviour of a dam and pose a significant threat to the dam’s stability (Li & Desai, 1983).
Description and Location of Dam
Satpara dam was constructed by the combined contribution of Government of Pakistan and United States Agency for International Development (USAID). It is a project of 2,090 million Pak Rupees. The construction was started in April 2003 and completed in November 2011.
Satpara hydropower project is located on Satpara Nullah downstream of Satpara lake, about 6km south of Skardu Town in Northern area of Pakistan. Satpara Nullah is the left tributary of Indus River. It flows from south to north, and its confluence with River Indus is near Skardu, having a total mainstream length of 34.5 km. It has a natural lake, about 6 km south of Skardu town along the access road to Deosai plain. Satpara village is situated upstream of Satpara lake along the left bank of Satpara Nullah. The dam-site is about 6 miles south of Skardu Town, which is sited at 226 km and 760 km from Gilgit and Islamabad, respectively.
Satpara dam is a multipurpose rockfill and earth dam, which produces 17.36 MW of hydroelectricity, supply water to 30,000 houses in Skardu Valley, irrigates 15,536 acres (62.87sq. km) of land, and supply 3.1 million gallons of drinking water to Skardu city. Most area of the dam is roofed with moronic deposits and colluvial/alluvial material. The thick moronic material is lying throughout the area. These deposits are loose to semi-consolidated having steep slopes resultantly, slides are common on both banks of the Nullah (Wikipedia, 2017).
Problem Statement
Leakage of water from a dam may not be harmful if it is limited and controlled, but continuous water leak may lead to weaken the surrounding soil structure or result in soil liquefaction, which affects the bearing capacity of the soil and stability of structure may be compromised. So, it is necessary to perform a seepage analysis before the structure is malformed. Satpara dam was encountered with the severe seepage problem. Therefore, seepage analysis was essentially required for seepage quantification and counter the loss of energy production.
Research Questions
This research is built on seepage analysis of Satpara dam by considering the following research questions.
What is the quantity of seepage water through the Satpara dam and how to control the seepage failure?
What would be the effect of seepage water on electricity production?
Purpose of the Study
-
To quantify seepage through an earth dam
-
To study the effect of seepage on the power production
-
To recommend certain measures against the seepage failure
Research Methods
Seepage Analysis
To perform the seepage analysis, a typical cross-section of the dam is selected. The seepage analysis is performed by modelling the selected critical dam’s cross-section in GeoStudio SEEP/W for the seepage quantification. SEEP/W is a numerical model that can mathematically simulate the real physical process of water flowing through a particulate medium. Numerical modelling is purely mathematical and in this sense is very different from scaled physical modelling in the laboratory or full-scaled field modelling(Calgary, 2012). So, primarily SEEP/W is used for:
Seepage quantification
Determination of the phreatic line, for the estimation of the pore water pressures
For the analysis of seepage through and under earth dams, flow is considered two-dimensional, and the Laplace equation is given by (Novak, Moffat, Nalluri, & Narayanan, 2014)
This equation forms the basis of SEEP/W software. The results are contrived in the form of a flow net. The lines joining the points having equal potential heads are the ‘Equipotential lines’. The direction of seepage is always perpendicular to the equipotential lines, and the path of seepage is shown by lines called the ‘Flow lines’. From Darcy’s equation, the total flow between two points is given by
SEEP/W can compute the seepage quantity that flows across a user-defined section. The imaginary flow lines from one side of the section to the other side are known as subsections. SEEP/W identifies all subsections across a user-defined flux section, computes the flow for each subsection, and then sums the subsection flows to obtain total flow across the flux section.
Theoretically, from Casagrande and Fadum (1940); Cedergren (1989), after the flow net is drawn the rate of seepage can be computed from the geometry of the seepage pattern with the equation (Novak et al., 2014):
Where
The above equation applies to isotropic soil conditions. It can be modified for anisotropic conditions by using . Therefore, the equation becomes (MacGregor, Fell, Stapledon, Bell, & Foster, 2014);
Analysis Design
The analyses of unconfined flow through Satpara dam is unfolded in this section by using GeoStudio SEEP/W. The result includes the total head contours, total pore water pressure, velocity vectors and, the location of the water table or zero pressure contour. The results are obtained at the maximum conservation level.
The overall step-wise process is explained below:
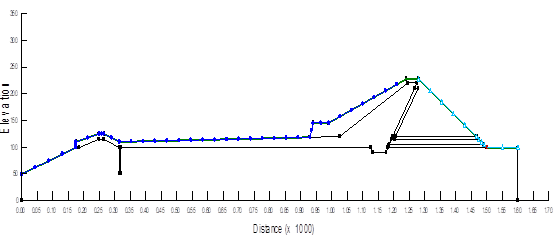
The sketch of dam cross section was made according to scale. It was often helpful to sketch an axis first by moving the cursor from the bottom left corner and stretching the axis outward. The sketch of the dam is shown in figure
01 .
-
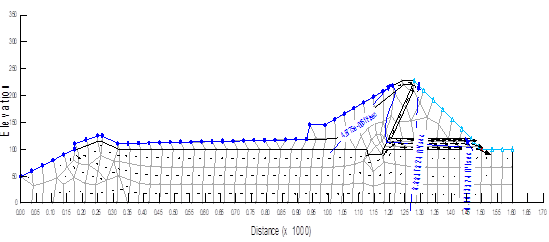
In the second step, material properties and boundary conditions were created then finally, reviewed and fine-tuned the finite element mesh. The finite element mesh of Satpara dam typical cross-section is shown in figure
02 .
-
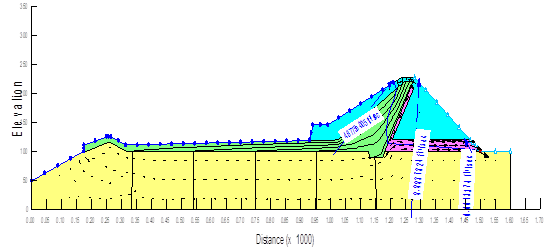
Progressively in the third step, material properties were assigned with distinct colour coding to easily recognised the different type of material in the dam cross-section. Generally, materials are first created and then assigned to geometric objects. Sometimes it can be helpful to sketch the supplementary information on geometry, so that one may know where to define the boundary conditions. Figure
03 shows the dam cross-section after assigning the material properties.
-
In the fourth step, the boundary conditions were applied to the region geometry. Multiple boundary conditions were defined and subsequently applied to the region geometry, which included the zero-pressure boundary condition applied to the downstream toe and a potential seepage face boundary condition applied to the downstream face. A potential seepage face is a unique boundary condition that is used to locate the position of a seepage face.
-
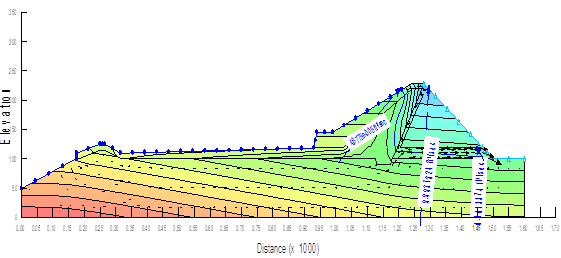
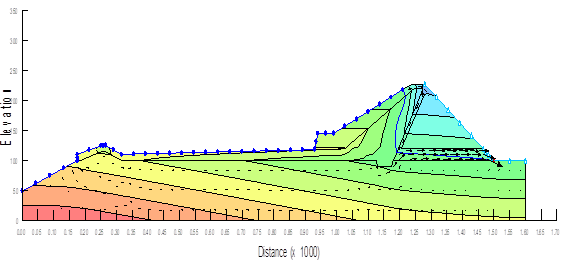
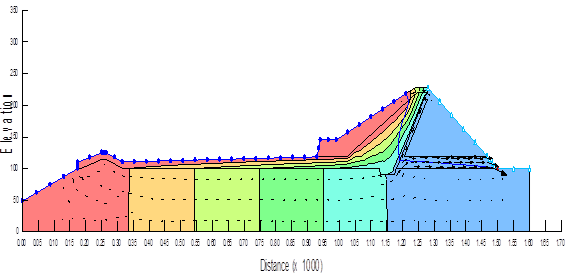
Finally, the problem was solved to obtain the results. Results obtained are shown by following contours for pore water pressure (figure
04 ), pressure head (figure05 ), and total head (figure06 ) respectively.
Findings
The results obtained from GeoStudio SEEP/W showed that the Satpara dam came across the severe seepage problem, which resultantly breached the one embankment of the dam. However, multiple remedial measures were taken to control the seepage and to stop the further damage to the embankment. The quantity of water seepage was estimated by using GeoStudio SEEP/W, and its effect on electricity production was determined. It is obvious from the literature that power and energy are directly proportional to discharge. Therefore, an increase in power and energy is expected with any minor increment in discharge.
Table
The calculation sheet indicates the gross head (in ft), net head (in ft), discharge (in cusecs), power (in megawatt), and energy (in Giga watt-hour) produced in the corresponding month. All factors mentioned above are listed at maximum conservation level.
Table
Table
The annual difference in power is 0.76 ≈ 0.8 (approx. 800 KW), and in energy, it is 0.56 ≈ 0.6 GWh (approx. 600GWh).
Conclusion
This research is built on seepage analysis, unfolding the effect of seepage on the Satpara dam including electricity production. The results obtained by GeoStudio SEEP/W dictates that:
The dam came across a severe seepage problem, but the remedial measures decided were good enough to counter the seepage problem. However, the more conservative approach is needed for the safety of the dam and to increase the production of electricity.
The seepage analysis revealed that all the seepage water is exiting the dam through the filter.
The provision of concrete lining at the upstream side (which is almost 600 ft long and a cut off which is 25 ft in the foundation) was useful in reducing the seepage through the embankment, which saved it from further breaching.
Installation of a technical instrument such as electric piezometer, telescoping tube (vertical settlement device), gauges to measure the total stress within the embankment of the dam and to monitor the horizontal movement of the dam, were enabled the authorities to assess the performance of dam services continuously.
The effect of seepage on power production was as expected, indicating an increase of 2.07%.
References
- Calgary, A. (2012). Seepage Modeling with SEEP/W: GEO-SLOPE International Ltd
- Casagrande, A., & Fadum, R. E. (1940). Notes on Soil Testing for Engineering Purposes: Harvard University, Graduate School of Engineering.
- Cedergren, H. R. (1989). Seepage, drainage, and flow nets: New York ; Toronto : J. Wiley, ©1989.
- Li, G., & Desai, C. (1983). Stress and seepage analysis of earth dams. Journal of Geotechnical Engineering, 109(7), 946-960.
- MacGregor, P., Fell, R., Stapledon, D., Bell, G., & Foster, M. (2014). Geotechnical engineering of dams: CRC press.
- Novak, P., Moffat, A., Nalluri, C., & Narayanan, R. (2014). Hydraulic structures: CRC Press.
- Wikipedia. (2017). Satpara Dam. In Wikipedia., The Free Encyclopedia. Retrieved from https://en.wikipedia.org/w/index.php
- Zhang, L., Xu, Y., & Jia, J. (2009). Analysis of earth dam failures: A database approach. Georisk, 3(3), 184-189.
Copyright information

This work is licensed under a Creative Commons Attribution-NonCommercial-NoDerivatives 4.0 International License.
About this article
Publication Date
17 May 2019
Article Doi
eBook ISBN
978-1-80296-061-7
Publisher
Future Academy
Volume
62
Print ISBN (optional)
-
Edition Number
1st Edition
Pages
1-539
Subjects
Business, innovation, sustainability, environment, green business, environmental issues
Cite this article as:
Irshad, M. I., & Naeem Tahir*, M. (2019). Seepage Analysis Of Satpara Dam (Pakistan). In M. Imran Qureshi (Ed.), Technology & Society: A Multidisciplinary Pathway for Sustainable Development, vol 62. European Proceedings of Social and Behavioural Sciences (pp. 194-203). Future Academy. https://doi.org/10.15405/epsbs.2019.05.02.18