Methodological Approaches To The Analysis Of Business Activity Of Regions
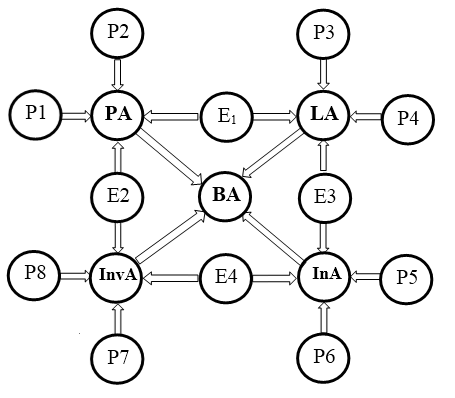
Figure 1: Net diagram of the analysis of the level of business activity in the region. Note: BA – business activity; PA – production activity, LA – labor activity, InvA – investment activity, InA – innovation activity; E1 – labor productivity, E2 – return on capital, E3 - patent activity; E4 – the effectiveness of innovation; P1 – the dynamics of the number of operating enterprises in the region, P2 – the number of small enterprises in relation to the population, P3 – the dynamics of the number of labor resources, P4 – the unemployment rate, P5 – the ratio of the number of researchers to the total number of employees; P6 – the proportion of companies that implemented innovations, P7 – the ratio of the volume of foreign direct investment to the gross regional product, P8 - the growth rate of investment in fixed assets.
< Back to article