Diagnostics Of The Production Potential Of The Regions Of Russia
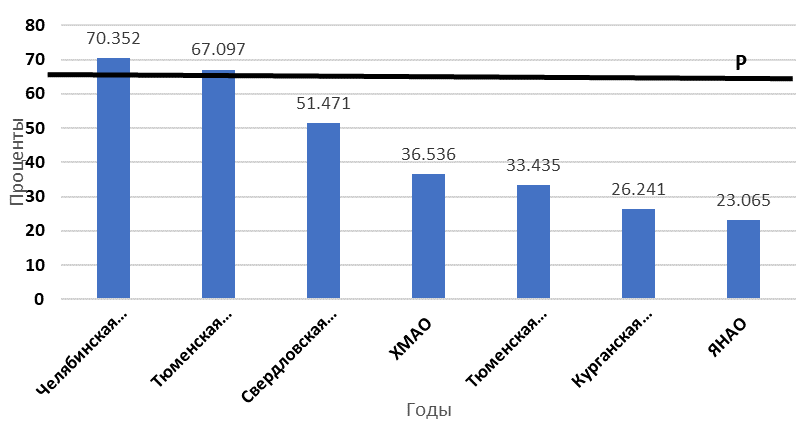
Figure 10: Distribution of subjects of the UFD by the level of capital productivity,% 2016, (РФ – Russian Federation ), (Челябинская область – Chelyabinsk region; Тюменская область без автономных округов – Tyumen region without Autonomous Districts; Свердловская область – Sverdlovsk region; ХМАО – Khanty-Mansiysk Autonomous District; Тюменская область в т.ч. авт. округа – Tyumen region including Autonomous Districts; Курганская область – Kurgan region; ЯНАО – Yamalo-Nenets Autonomous District). Source: Federal state statistics service (2017)
< Back to article