
Diagnostics Of The Production Potential Of The Regions Of Russia


Abstract
In the conditions of economic instability, it is importance to improve the quality of the production potential, which the regions of the country have in accordance with the different conditions. However, the available accumulated potential does not always allow to develop steadily and achieve strategic objectives. The study attempted to diagnose the production potential of the subjects of one of the leading macro-regions of the Russian Federation – the Urals Federal District. In the Urals Federal District regions are formed – growth poles. These include, primarily, the Khanty-Mansiysk and Yamalo-Nenets Autonomous Districts. They have a commodity export orientation, are among the three leading regions in the value of fixed assets, second only to the Moscow. However, the capital productivity is low due to the high cost of fixed assets. The Sverdlovsk Region, which historically develops an industrial complex based on engineering and metallurgy, has a significant production potential. By value of fixed assets, the region ranks sixth in the country. According to capital productivity, the region is the third in the Urals Federal District. Another subject has a large accumulated potential – the Chelyabinsk Region. Its economy based on the metallurgical industry, engineering, chemical complex. The capital productivity of the highest of these subjects, second only to the Tyumen region without autonomous districts. The positive impact on the production potential of the macro-region of innovation, together with the development of production complexes, has a beneficial effect on the economic security of the Ural macro-region.
Keywords: Indicatorsindustrial safetyindustrial potentialregions
Introduction
The importance of studying the production potential of a territory is related to the urgency of the problem of its economic security and the development of production. Security is ensured by the growth of production in the region or by the state of reproduction of goods and services, ensuring the employment of workers and the growth of incomes of the population.
Despite a considerable degree of study of the issue of diagnosing such an important part of the economic potential as production potential (Larionov, 2015; Gagarina & Arkhipova, 2017; Gainanov, Gubarev, Dzyuba, & Fayzullin, 2017), it remains the focus of scientists and practitioners in connection with its strategic importance to countries emerging economies (Bakanach, Proskurina, Tokarev, & Merkushova, 2015). These include the Russian Federation, which has all the main factors of production and the starting conditions for development. From the standpoint of assessing available production resources, one can note their heterogeneous territorial distribution, different levels of investment attractiveness. These factors largely determine the quality of the production potential.
The production potential, being an integral part of the economic potential of the territory, largely determines the degree of its sustainable and safe development. Its presence and qualitative characteristics have a significant role in confronting crisis phenomena and instability affecting the Russian economy. As the aggregate capacity of production developing in the region to produce products that meet the demands of a market economy, to ensure the growth of the GRP, production potential influences the socio-economic development of the region and determines its competitiveness.
Currently, production in the Russian economy remains the most important area affecting the strategic development of the country and regions. This is facilitated by a number of factors such as: natural, geographical conditions, resource base, human capital, the presence of large regional industrial complexes. In this regard, the production potential of the region is characterized by a set of basic types of resources that contribute to the development of production and economic growth.
Problem Statement
The task of the study is to diagnose and type the territories of the macroregion according to the level of production potential and safety based on identifying the main problems and indicators that determine the place of the region in the system of federal districts. In addition, the task is to assess the factors affecting the degree of use of the productive potential of the regions, and their role in increasing resilience to economic crises.
Research Questions
3.1. What are the results of diagnostics of the production potential of the regions in the system of modern indicators?
3.2. Are there any differences in the trend of production of the gross regional product of the macro-region and the country as a whole?
3.3. What are the differences in the current trend of development of macro-regions and the country as a whole?
3.4. What value does high depreciation of fixed assets for production have in harsh natural and climatic conditions?
3.5. How important is the contribution of the innovation economy to the quality of the production potential of the macro-region?
Purpose of the Study
The main objective of the study is to assess the state of the territory based on diagnostics of the production potential as a factor in the economic development of the region, typology of the levels of security and security of the territories, as well as determining the effectiveness of the use of the existing potential.
During the analysis of industrial safety at the regional level, the actual level of growth or decline in production over a certain period, the structure of the main types of regional activities reflecting the current state of fixed assets, the comparative value and the dynamics of production investments in fixed assets are assessed.
The applied part of the study consists in assessing the production potential of the regions of the Ural Federal District as one of the important macro-regions, which has not only favorable starting positions, but also significant prospects, both in geo-economic and geostrategic terms.
Research Methods
The main research methods are comparative, statistical and system analysis method.
Diagnostics of the production potential helps to identify the level of safety in accordance with the criteria approach, when the state of the territory is assessed from the position of assigning it to a particular hazard class. To this end, the study uses one of the methods of regional analysis – a comparison of macroeconomic indicators with their threshold values, which are represented by average Russian indicators. In modern conditions of macroeconomic instability, the comparison of Russian indicators with foreign ones is not possible and cannot be correct. In addition, there are no clear assessment criteria in Russian practice due to the incompleteness of the relevant methodologies or recommendations.
Comparative and statistical methods are needed to diagnose regions by production potential, using the following indicator system:
index of physical volume of GRP;
the value of fixed assets;
degree of depreciation of fixed assets by type of economic activity;
the proportion of fully worn fixed assets by economic activity;
investment in fixed capital by type of economic activity;
labor productivity index;
capital productivity by economic activity (assessment of the effectiveness of the use of fixed assets);
index of innovative development.
Findings
The study has a scientific and practical orientation, which consists in identifying the main strengths and weaknesses of the production potential of the regions of the Ural Federal District. The practical results of the work can be used in the drafting of the Regional Social and Economic Development Strategy (Saktoev & Khaltaeva, 2014; Durdyeva, Taran, Aslanov, Bindasova, & Borlakova, 2016) of this district for the medium term.
The article includes an analysis of the main indicators of production potential.
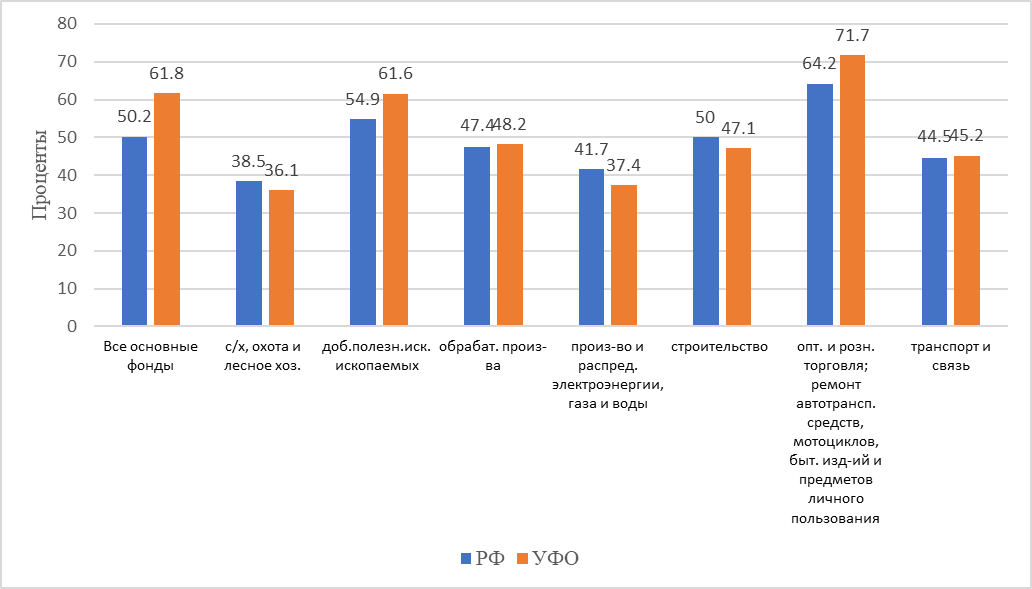
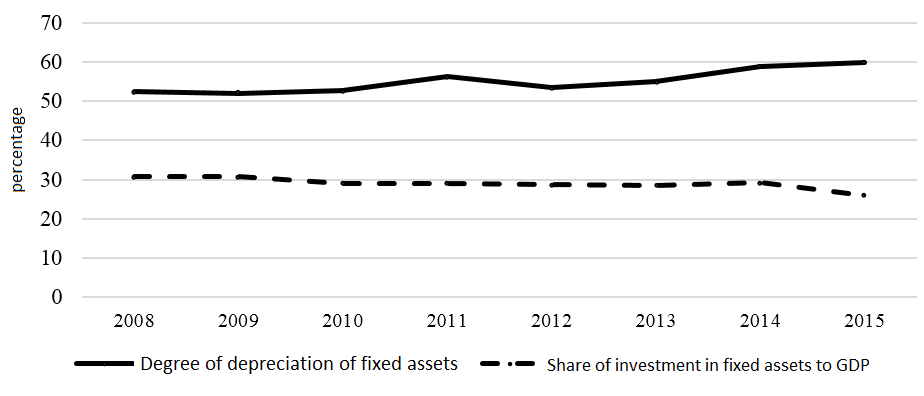
For the effective functioning of the production sector, fixed assets are of paramount importance as an integral part of the national wealth of the Russian Federation. Improving the quality of their use can solve many problems associated with the modernization and innovative development of the economy. Effective use of fixed assets allows you to increase production volumes, reduce production costs, while increasing productivity. And this directly affects the increase in return on capital, profitability and, as a result, on economic growth in the region. To achieve these goals, diagnostics of fixed capital is carried out. One of the most important indicators by which the degree of use of fixed assets by a region can be analyzed is capital productivity. It shows the level of turnover of fixed assets and allows you to determine how effectively they are used in production. Another important indicator of industrial safety is the indicator of depreciation of fixed assets. As a threshold, the study uses the average Russian level, which in 2016 is 50.2%. According to preliminary data of the Federal State Statistics Service of the Russian Federation in 2017, it was 48.1%. An important factor in industrial safety is also the share of investments in fixed assets in the gross regional product (GRP), which can contribute to a significant rise in many sectors of the regional economy, and, consequently, increase economic security.
The share of investments in fixed assets in Russia's GDP in 2017 amounted to 21.2%. After a decline to 19.6% in 2015, the indicator returned to the value of 2013, which is higher than the 2010 level (Figure
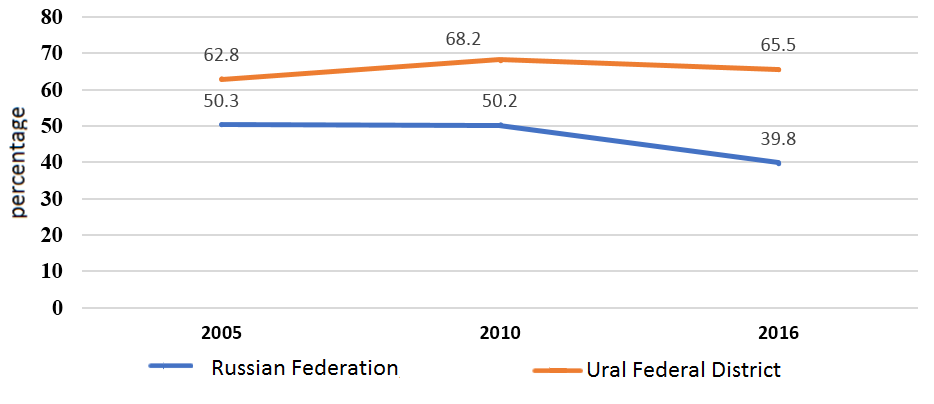
The dynamics of economic growth in the Urals Federal District (UFD) reveals the volume index of the gross regional product (Figure
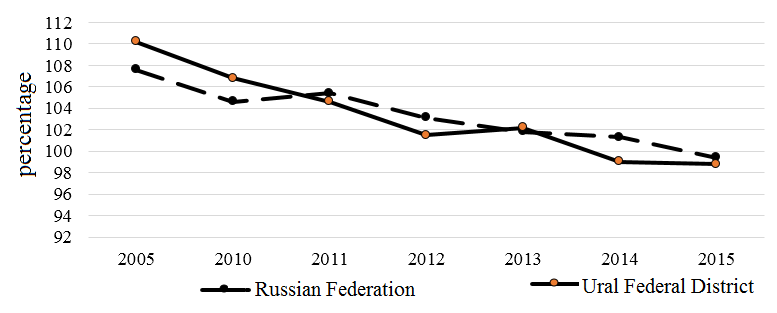
Since 2005, there has been a decline in the production of GRP both in the Russian Federation as a whole and in the UFD: the physical volume index of the GRP decreased from 110% in 2005 to 98.8% in 2015. If in 2005 there was an excess of the all-Russian level, then within 10 years the situation changed significantly downward, a slight excess (by 0.4%) fell on the pre-crisis 2013. In 2015, the situation in the district corresponds to the general Russian trend.
The regional slice of the change in GRP corresponds to the situation in the district (Figure
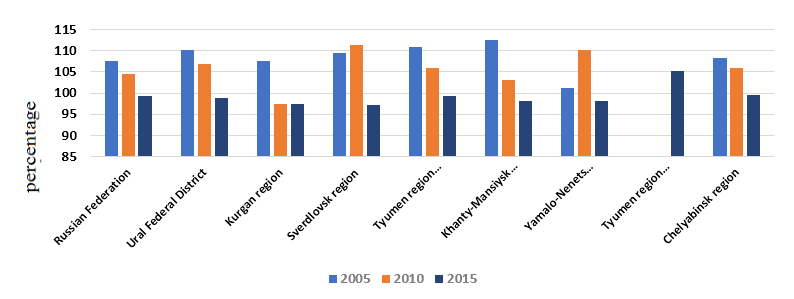
In terms of the volume of shipped goods of own production, work performed and services on its own, the following industries are leading – mining and manufacturing, which is natural for this district, since the largest share of GRP falls on these areas. The undoubted leaders in this indicator are the Khanty-Mansiysk and Yamalo-Nenets Autonomous Districts.
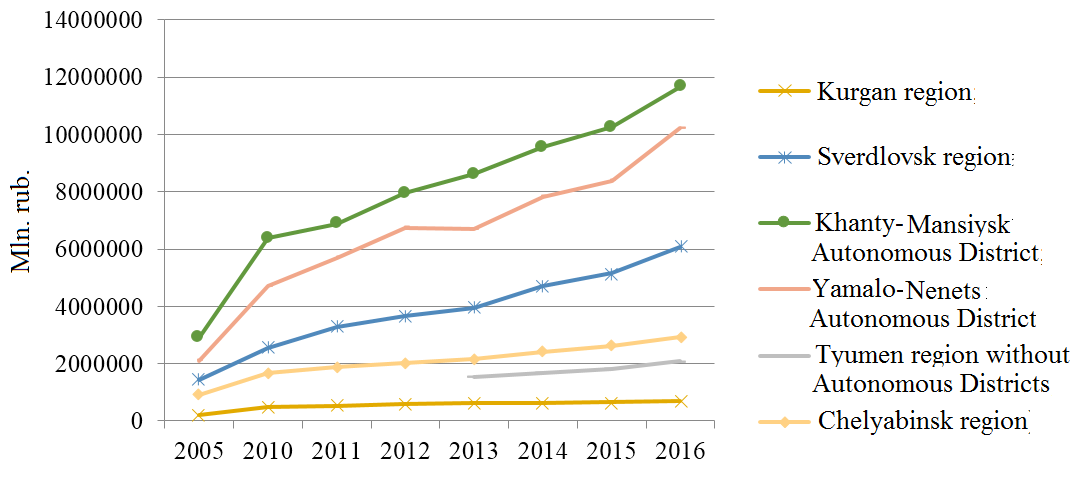
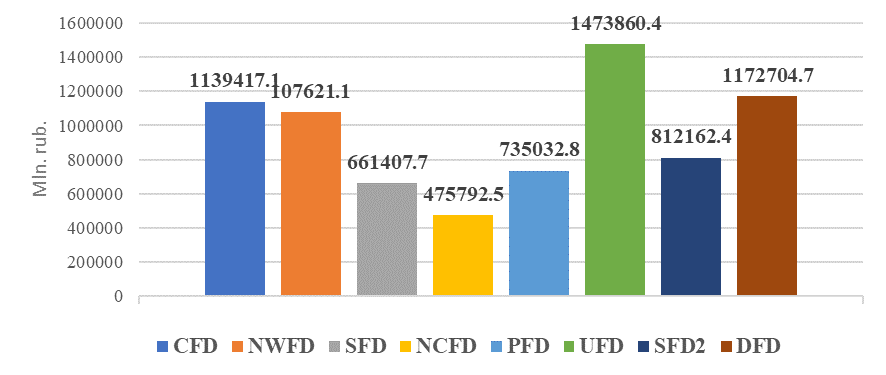
One of the most important indicators of production potential is the value of fixed assets and their dynamics. In this regard, it can be noted that two subjects of the Ural Federal District – the Khanty-Mansiysk and Yamalo-Nenets Autonomous Districts – are among the top five cost-based funds, second only to Moscow (Table
The low cost of fixed assets of the Kurgan region (61st place in the country), which by typology of GRP belongs to lagging regions, per capita GRP is 47% of the Russian Federation (Figure
The most important aspects of the state of fixed assets are disclosed in the course of analyzing the degree of their wear and tear, which is necessary when deciding whether to replace production equipment or increase its quantity.
The Urals Federal District is characterized by the highest degree of depreciation of fixed assets in the Russian Federation (Table
Over the past decade, the depreciation of fixed assets has increased significantly, with the UFO retaining its traditional leadership (Figure
Kurgan region stands out in the district the most worn and therefore cheap fixed assets. The region occupies the last place in the district in terms of the turnover of organizations (1.6% of the Ural Federal District), the number of enterprises and organizations, the volume of products shipped, the development of small and medium-sized businesses, needs an increase in investment in fixed assets (79th place in the Russian Federation).
The region does not possess such significant reserves of useful resources as the leading regions; therefore, enterprises and organizations are focused on the development of such areas of activity as wholesale and retail trade, processing industries.
In general, in the UFO (Figure
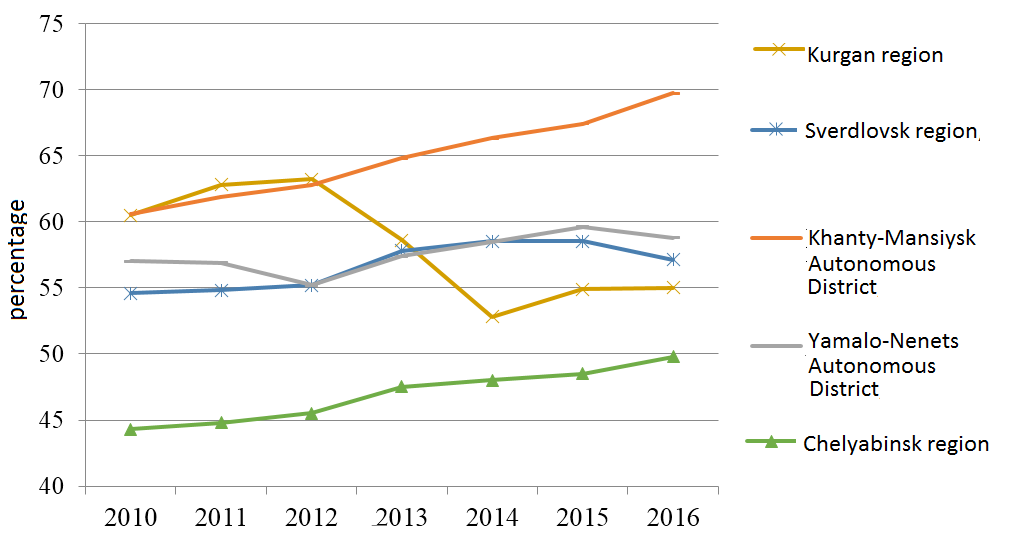
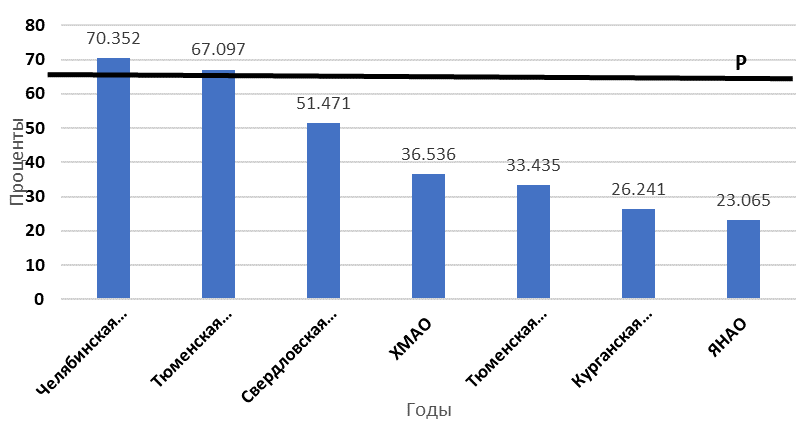
If we consider the depreciation on the subjects of the district, then it is important to note that for all subjects except Tyumen and Chelyabinsk regions there is a high degree of deterioration of fixed assets. In Khanty-Mansi Autonomous District, the level of wear in 2016 reaches 70%, which is a serious threat to the industrial safety of the region.
The share of fully worn out fixed assets significantly exceeds the all-Russian level: 30.2% – mineral resources, 25.3% – wholesale and retail trade, 16.5% – construction, 16.1% – manufacturing industries. In some regions of the oblast the value of this indicator exceeds 30%: Kurgan region (65.7% of fully worn fixed assets in wholesale and retail trade), Chelyabinsk region (56% of fully worn out fixed assets in wholesale and retail trade), Khanty-Mansiysk Autonomous District (36 % of fully depreciated fixed assets in the extraction of minerals). Thus, more than half of fixed assets are completely worn out and need to be upgraded.
The share of fully worn out fixed assets significantly exceeds the all-Russian level: 30.2% – mineral resources, 25.3% – wholesale and retail trade, 16.5% – construction, 16.1% – manufacturing industries. In some parts of the region the value of this indicator exceeds 30%: Kurgan region (65.7% of fully worn fixed assets in wholesale and retail trade), Chelyabinsk region (56% of fully wear out fixed assets in wholesale and retail trade), Khanty-Mansi Autonomous District (36% of fully depreciated fixed assets in the extraction of minerals). Thus, more than half of fixed assets are completely worn out and need to be upgraded.
Thus, the greatest depreciation of funds in the subjects of the UFD is observed in the mining, energy and manufacturing sectors, which make a significant contribution to the formation of the district GRP. Currently, to increase production volumes, continuing to use worn-out equipment, is not a rational option for the development of the economy.
A high degree of wear leads to a decrease in labor productivity, an increase in the cost of production, and a decrease in its quality. It can be noted that in some regions of the UFD a negative trend of labor productivity is forming (Table
The consequence of low productivity and competitiveness may be a lag of wages at most of the enterprises of the district from the all-Russian indicators. However, in general, in the UFD, labor productivity is increasing mainly due to the increase in this indicator in the Kurgan Region, the Sverdlovsk Region and the Yamalo-Nenets Autonomous District, the indicators in these regions exceed the national average by an average of 5%. As of 2016, the UFD is the leader in labor productivity among other federal districts of the country (Figure
Capital productivity is an important indicator of the quality of production potential and safety in production activities. It reflects the volume of output in the region and the volume of services provided for each ruble of financial resources, i.e. the efficiency of fixed assets.
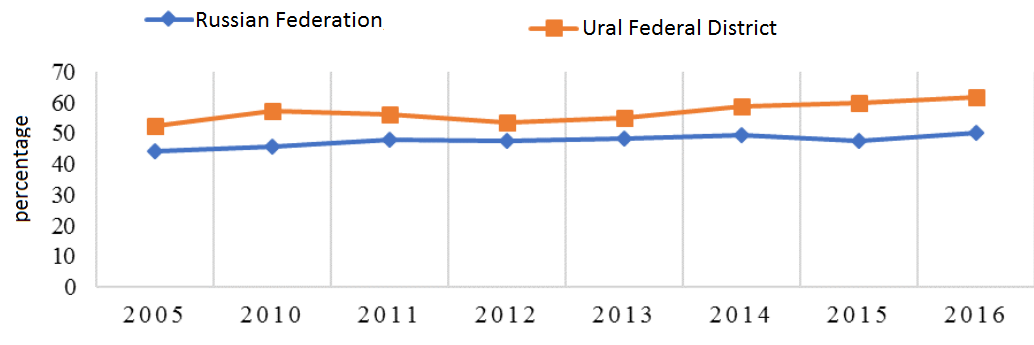
It is important to note that in general, in UFD, capital productivity is lower than the level in the Russian Federation as a whole (Figure
The results of the analysis of indicators of production capacity by the subjects of UFD can be used to determine the level of industrial safety in the district (Freis, 2015). In this regard, the grouping of regions can be represented in the following table.
Thus, it can be noted that most of the constituent entities of the district are in the zone of relatively low level of industrial safety (Table
Nonetheless, there is no unequivocal judgment about a particular level of industrial safety in the regions. For example, regions such as the Khanty-Mansiysk and Yamalo-Nenets Autonomous Districts are characterized by high depreciation of fixed assets, but, on the other hand, they have a high investment attractiveness, modern equipment is being modernized, new production facilities that define strategic priorities of the national economy.
Therefore, they can definitely be attributed to a high production hazard zone with a high degree of conditionality, using a relatively limited number of indicators during the assessment. One of the factors for increasing the role of production potential and its quality is to increase the level of innovation implementation (Kulikova, 2016) and, in general, the development of innovative economy in the subjects of both the UFD and the Russian Federation as a whole.
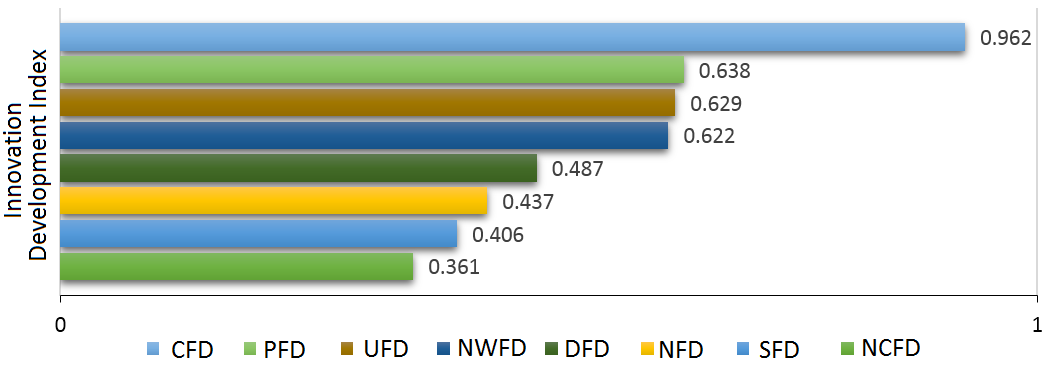
The Urals region ranks third in the country in terms of the innovation development index. It is calculated based on the assessment of the index of innovation susceptibility and the index of innovation activity (Figure
In the calculation of this indicator, data on expenditures on research and development per 1 employee are used (domestic expenditures on research and development / number of people employed in the economy); the cost of technological innovation on the 1st employed (the cost of technological innovation / number of employees to the economy) and the release of innovative products per capita (the volume of innovative goods, works, services / population). The study of these indicators shows the influence of the level of susceptibility of the industry of the region to innovations as a factor in the growth of production potential.
Conclusion
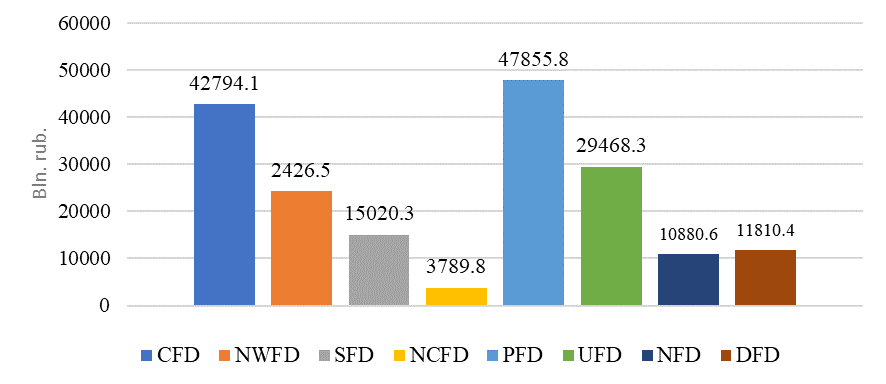
The study found that if the costs of research and development UFD takes 4th place (average) among the federal districts, then the cost of technological innovation is second only to the Central District. Among the subjects of the district, the leading place is occupied by the Khanty-Mansiysk Autonomous Okrug. On the output of innovative products of the UFD the third after the Volga and Central districts (Figure
Thus, investment and innovation renewal of the production potential, which significantly determines the socio-economic development of the regions (Goryunova, 2009), is a factor in the security of the national economy. In today's conditions of volatility in the markets and macroeconomic instability in general, the diagnosis of the state of the production potential reveals, on the one hand, its weak points, but, on the other, shows the possibilities of increasing economic growth.
Evaluation of the production potential of the subjects of the UFD showed that, in general, the district has great potential to increase its efficiency in connection with the modernization of fixed assets and increasing capital productivity. The attribution of high-level industrial hazards to UFD subjects is associated with high equipment wear and tear, a decrease in the physical volume of GRP and investments in fixed capital. The industrial potential of the Ural Federal District, despite significant problems, largely determines the leading position in the Russian Federation in labor productivity, investment in fixed capital, the value of fixed assets, the volume of output of the extractive industries, and innovative development.
The production potential of the Ural Federal District, despite significant problems associated with a decrease in the physical volume index of the gross regional product, high depreciation of fixed assets, reduced capital productivity and other factors, largely determines the leading position in the Russian Federation in labor productivity, investment in fixed capital fixed assets, the volume of products shipped to the extractive industries, innovative development.
References
- Bakanach, O., Proskurina, N., Tokarev, & Y., Merkushova, N. (2015). Statistic Analysis of Industrial Potential in the Russian Federation: A Regional Aspect. Mediterranean Journal of Social Sciences, 6(3), 384-391. MCSER: Publishing, Rome-Italy.
- Durdyeva, D., Taran, O., Aslanov, D., Bindasova, N., & Borlakova, M. (2016). Assessment and Analysis of Resource Approach to Formation of Strategic Potential of Economy of the Region. International Review of Management and Marketing, 6(S1), 84-89.
- Federal state statistics service. (2017) Region of Russia. Socio-economic indicators-2017. Retrieved May, 13, 2018, from http://www.gks.ru.
- Freis, V. E. (2015). The State of economic security of the regions of the Ural Federal district in the conditions of destabilization of economic processes. Retrieved May, 13, 2018, from http://elar.urfu.ru/bitstream/10995/34362/1/urrr_2015_187.pdf.
- Gagarina, G. Y., & Arkhipova, L. S. (2017). Regional features of the use of the production potential of the macroregion as a factor of stability of the Russian economy. Vestnik of the G. V. Plekhanov’s Russian University of Economics, 4 (94), 126-137.
- Gainanov, D. A., Gubarev, R. V., Dzyuba, E. I., & Fayzullin, F. S. (2017). Industrial potential of Russian regions: estimation and growth reserves. Sotsiologicheskie issledovaniya [Sociological Studies], 1, 106-116.
- Goryunova, L. A. (2009). Regional innovation development: assessment of structural differences. Spatial economics, 2, 127-139.
- Kulikova, E. I. (2016). On the development of goal-setting systems in the management of the regional market. Scientific notes of the Russian Academy of entrepreneurship, 46, 18-26.
- Larionov, A. O. (2015). Evaluation of industrial potential of the region. Problems of development of the territory, 2 (76), 45-61.
- Saktoev, V. E., & Khaltaeva, S. R. (2014). Regional strategic planning in the context of definitional approaches and specific features. Vestnik ESSTU, 1(46), 119-129.
Copyright information

This work is licensed under a Creative Commons Attribution-NonCommercial-NoDerivatives 4.0 International License.
About this article
Publication Date
02 April 2019
Article Doi
eBook ISBN
978-1-80296-058-7
Publisher
Future Academy
Volume
59
Print ISBN (optional)
-
Edition Number
1st Edition
Pages
1-1083
Subjects
Business, innovation, science, technology, society, organizational theory,organizational behaviour
Cite this article as:
Arkhipova, L., Kulikova, E., & Ilina, A. (2019). Diagnostics Of The Production Potential Of The Regions Of Russia. In V. A. Trifonov (Ed.), Contemporary Issues of Economic Development of Russia: Challenges and Opportunities, vol 59. European Proceedings of Social and Behavioural Sciences (pp. 109-122). Future Academy. https://doi.org/10.15405/epsbs.2019.04.13