
Internet Development Modeling


Abstract
The article proposed a technique that uses the logistic function for modeling and forecasting indicators approaching the level of natural saturation. There are a large number of indicators that at a certain point in time begin to approach their natural limit, that is, to a certain level of natural saturation, when approaching which there is a natural slowdown in the growth rate. The proportion of Internet users in Russia was chosen as such an indicator approaching the level of natural saturation. For the simulation was used the logistic function proposed by P.F. Verhulst, the schedule of which resembles the Latin letter "S", laid on its side. The curve of this function has two inflection points: in the transition from a slow growth rate to a higher and in the transition from fast growth to deceleration. The purpose of the study is to create a model based on the logistic function of P.F. Verhulst, to analyze and predict the share of Internet users in Russia in 2018-2020. The use of the presented methodology for analyzing and forecasting relevant indicators provides the source material for developing conceptual solutions and preparing strategies for possible directions for further development both at the level of individual firms and relevant industries as a whole, which becomes much more relevant in the context of economic crises, sanctions, etc.
Keywords: Τechniqueforecastinginternet usersVerhulst's equationlogistic functionmodeling
Introduction
As you know, there are many indicators in various industries, which at a certain point in time begin to approach their natural limit, that is, to a certain level of natural saturation, when approaching which a growth rate slows down. Such indicators, for example, can be the number of car owners in the country (world); the number of Internet users in the country (world); the number of families with washing machines in the country (world); the number of cellular users in the country (world), etc. (Parsons, 2018; Leong, Lim, Lam, Uemura, Ho, & Ho, 2018; Zhao & Hu, 2018; Huang, Yang, Chen, & Meng, 2018; Ryazanov, 2018; Puripat & Sarikavanij, 2018; He, Jiang, Zhao, Peng, & Shi, 2018; Miskinis & Vasiliauskiene, 2017).
For modelling and forecasting in this study, the proportion of Internet users in Russia was selected.
Problem Statement
For the analysis of the nature of development and forecasting the number of Internet users in Russia, approaching the level of natural saturation, a method is proposed that involves the use of the logistic function proposed by P.F. Verhulst (Wang, Zi, Ding, You, & Yu, 2018; Gevorkyan, Demidova, Velieva, Korol'kova, Kulyabov, & Sevast'yanov, 2018; Simin et al., 2017; Koch & Schropp, 2018). Logistic equation of P.F. Verhulst is traditionally used to predict population size.
In our methodology, this equation is used to model and predict the share of Internet users in the country.
Research Questions
In this study, we planned to answer the following questions:
How to change the proportion of Internet users in Russia in 2018-2020?
Purpose of the Study
The purpose of the study is to create a model based on the logistic function of P.F. Verhulst, to analyse and predict the share of Internet users in Russia in 2018-2020.
Research Methods
The logistic equation of P.F. Verhulst resembles the Latin letter "S", laid on its side. The curve of this function has two inflection points: in the transition from a slow growth rate to a higher (concave part of the curve) and in the transition from fast growth to deceleration (the convex part of the curve) (Lopez, Lupi, Leon, Lopez, Agudo, & Delgado, 2018; Miao, Hao, Guo, Wang, & Liang, 2017).
The equation for this function is as follows:
Y = (A/(1 + 10a+bx)) + C,
where
Y - the value of the function,
A - the difference between the upper and lower asymptotes,
x - the sequence number of the investigated period of time,
С - the level from which the growth of the function begins,
a, b - values that form the nature of the change in the logistic curve (slope, bend and inflection points).
The proposed research method includes 6 stages:
Stage 1, the essence of which is to select the studied indicator for analysis and forecasting;
Stage 2 is devoted to determining the level of saturation of the indicator under consideration, the minimum value and the number of analysed values based on expert assessments;
Stage 3 is the calculation of indicators for the system of equations;
Stage 4 involves the compilation of a system of equations and the search for their solution;
Stage 5 is to obtain the desired calculated values;
Stage 6 is devoted to the construction of graphs showing the results obtained and the formation of conclusions.
At stage 1, choose one of the indicators that characterizes the level of Internet use in the country: the change in the proportion of Internet users in the Russian Federation in 1993-2017 (International Telecommunication Union (2018). Country ICT data.) (see Table
At stage 2, we assume that C = 0, n = 20, A = 80%.
At stage 3, we calculate the data for the system of equations (see Table
At the 4th stage, on the basis of the calculation, we make up the system of equations and solve it:
Multiply the first equation by 10.5:
210a + 2205b = 219,31
Transfer 2205b to the right side of the equation and get:
210a = 219,31 - 2205b
Substituting 210a into the second equation and we get:
219,31 - 2205b + 2870b = 94,19
From here we get:
665b= - 125,13
b = - 0,19
Substitute b:
20a + 210 * (-0,19) = 20,89
We get:
20a = 60,4
a = 3,02
At stage 5, we substitute the data obtained into equation (1):
Y = 80/(1 + 103,02 - 0,18x)
and calculate the desired values (see Table
At stage 6, we build a graphical interpretation of the results obtained, which is shown in Fig.
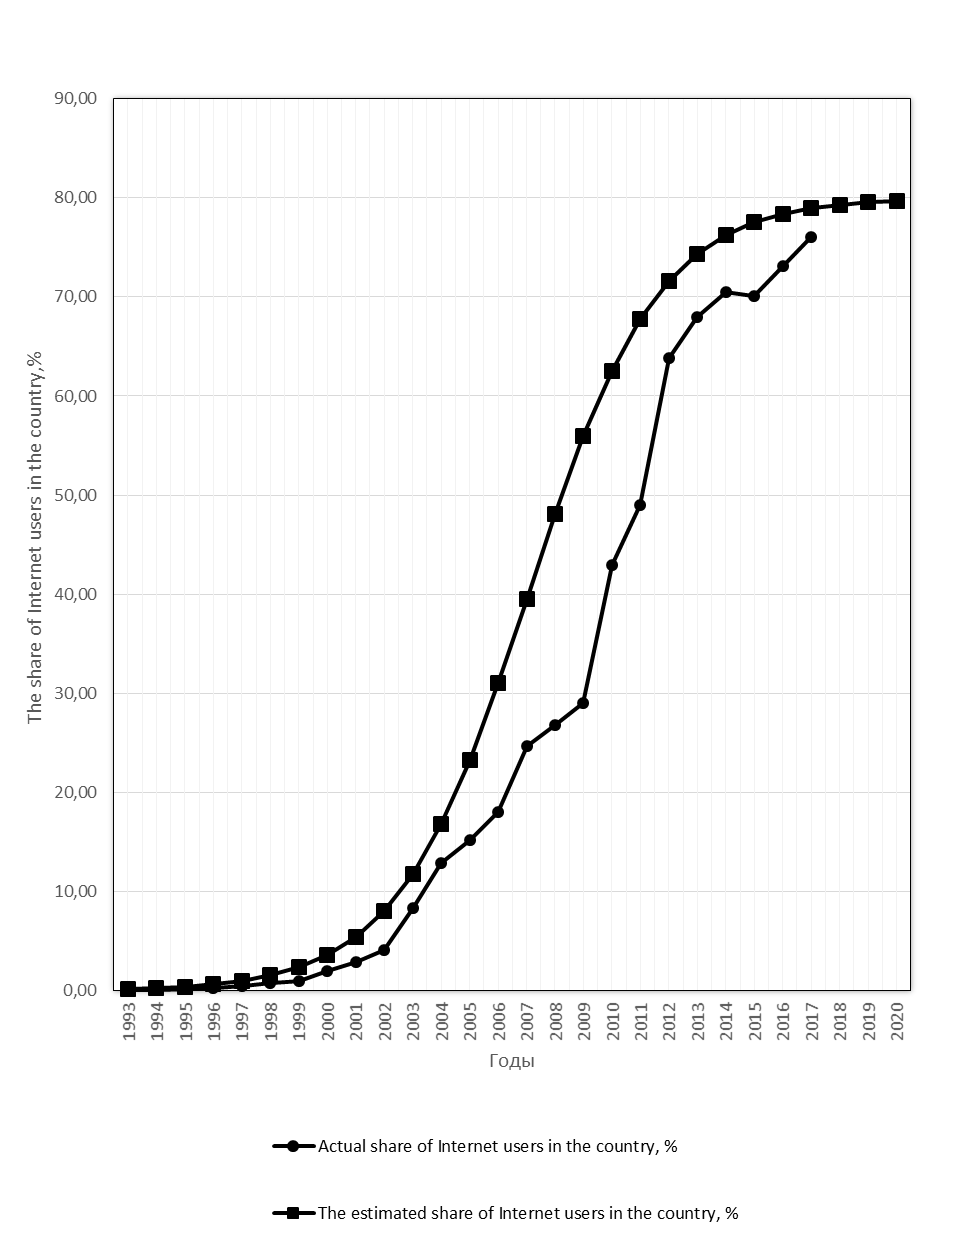
Findings
In fig.
As can be seen from built in Fig.
Conclusion
The use of the presented methodology for analysing and forecasting relevant indicators provides source material for developing conceptual solutions and preparing strategies for possible development directions both at the level of individual firms and relevant industries as a whole, which becomes significantly more relevant in the context of economic crises, the imposition of sanctions, etc. (Schmidt, 2018; Anikin & Anikin, 2017).
References
- Anikin, O.B., & Anikin, B.A. (2017). Intellectual systems to support the creation of world-class products. Step into the future: artificial intelligence and digital economics: Proceedings of the 1st international scientific-practical conference, 2, 54-58.
- Gevorkyan, M. N., Demidova, A. V., Velieva, T. R., Korol'kova, A. V., Kulyabov, D. S., & Sevast'yanov, L. A. (2018). Implementing a Method for Stochastization of One-Step Processes in a Computer Algebra System. Programming and Computer Software, 44(2), 86–93.
- He, J.P., Jiang, Z.X., Zhao, C., Peng, ZQ., & Shi, Y.Q. (2018). Cloud-Verhulst hybrid prediction model for dam deformation under uncertain conditions. Water Science and Engineering, 11(1), 61-67. https://dx.doi.org/10.1016/j.wse.2018.03.002.
- Huang, D., Yang, X.Y., Chen, S.Y., & Meng, T. (2018). Wide-area measurement system-based model-free approach of post-fault rotor angle trajectory prediction for on-line transient instability detection. IET Generation, Transmission & Distribution, 12(10), 2425-2435.
- International Telecommunication Union (2018). Country ICT data (until 2017). Percentage of Individuals using the Internet. Retrieved from https://www.itu.int/en/ITU-D/Statistics/Pages/stat/default.aspx.
- Koch, G., & Schropp, J. (2018). Delayed logistic indirect response models: realization of oscillating behavior. Journal of Pharmacokinetics and Pharmacodynamics, 45(1), 49-58. https://dx.doi.org/10.1007/s10928-017-9563-8.
- Leong, W.H., Lim, J.W., Lam, M.K., Uemura, Y., Ho, C.D., & Ho, Y.C. (2018). Co-cultivation of activated sludge and microalgae for the simultaneous enhancements of nitrogen-rich wastewater bioremediation and lipid production. Journal of the Taiwan Institute of Chemical Engineers, 87, 216-224.
- Lopez, B., Lupi, T. M., Leon, J. M., Lopez, F., Agudo, B., & Delgado, J. V. (2018). Characterization of the commercial growth curves of Spanish Merino, Fleischschaf, and crossbred lambs in an associative economy context. Small Ruminant Research, 164, 8-14. https://dx.doi.org/10.1016/j.smallrumres.2018.04.009.
- Miao, S.J., Hao, X., Guo, X.L.,Wang, Z.M., & Liang, M.C. (2017). Displacement and landslide forecast based on an improved version of Saito's method together with the Verhulst-Grey model. Arabian Journal of Geosciences, 10(3), 53. https://dx.doi.org/10.1007/s12517-017-2838-y.
- Miskinis, P., & Vasiliauskiene, V. (2017). The analytical solutions of the harvesting Verhulst's evolution equation. Ecological Modelling, 360, 189-193. https://dx.doi.org/10.1016/j.ecolmodel.2017.06.021.
- Parsons, T.L. (2018). Invasion probabilities, hitting times, and some fluctuation theory for the stochastic logistic process. Journal of Mathematical Biology, 77(4), 1193–1231.
- Puripat, C., & Sarikavanij, S. (2018). The Comparison of Grey System and the Verhulst Model for Rainfall and Water in Dam Prediction. Advances in Meteorology, 7169130, 11. https://dx.doi.org/10.1155/2018/7169130
- Qin, Q., Zhao, S., Chen, SW., Huang, DS., & Liang, J. (2018). Adaptive and robust prediction for the remaining useful life of electrolytic capacitors. Microelectronics Reliability, 87, 64-74.
- Ryazanov, V. V. (2018). Possibilities of Dynamic Behavior of Raft-Like Domains in Biological Membranes. Biologicheskie Membrany, 35 (3), 208-218.
- Schmidt, B.C. (2018). Diagnosis and Distribution of the Kivalliq Sulphur (Colias rankinensis Verhulst), an Enigmatic Arctic Butterfly. Journal of the Lepidopterists' Society, 72 (3), 227-232.
- Simin, P.T., Jafari, G.R., Ausloos, M., Caiafa, C.F., Caram, F., Sonubi, A., Arcagni, A., & Stefani, S. (2017). Dynamical phase diagrams of a love capacity constrained prey-predator model. European Physical Journal B, 91 (2): 43. https://dx.doi.org/10.1140/epjb/e2017-80531-7
- Wang, Z.Y., Zi, B., Ding, H.F., You, W., & Yu, LT. (2018). Hybrid grey prediction model-based autotracking algorithm for the laparoscopic visual window of surgical robot. Mechanism and Machine Theory, 123, 107-123. https://dx.doi.org/10.1016/j.mechmachtheory.2018.01.015
- Zhao, Z.D., & Hu, CZ. (2018). Grey prediction models for the standard limit of vehicle noise. Proceeding of the Institution of Mechanical Engineers Part D-journal of Automobile Engineering, 232 (7), 973-979.
Copyright information

This work is licensed under a Creative Commons Attribution-NonCommercial-NoDerivatives 4.0 International License.
About this article
Publication Date
20 March 2019
Article Doi
eBook ISBN
978-1-80296-056-3
Publisher
Future Academy
Volume
57
Print ISBN (optional)
-
Edition Number
1st Edition
Pages
1-1887
Subjects
Business, business ethics, social responsibility, innovation, ethical issues, scientific developments, technological developments
Cite this article as:
Anikin, B., & Anikin, O. (2019). Internet Development Modeling. In V. Mantulenko (Ed.), Global Challenges and Prospects of the Modern Economic Development, vol 57. European Proceedings of Social and Behavioural Sciences (pp. 1185-1192). Future Academy. https://doi.org/10.15405/epsbs.2019.03.120