
Management In Academic Teaching Staff Activity: Modeling Of Rating System Indicators

Abstract
The paper touches the issue of projecting the indicator-based rating system aimed at stimulating the professional activity of high-education academic staff. The majority of teaching staff activities have been incorporated into the logic with what indicator groups have been chosen. The social challenge that defines the level in education services quality contributes to the importance of this research. To forecast the indicators dynamics in the whole system, the authors introduced such notion as drifting factor and variability degree of each indicators group. The usage of a hypercube for initial data structuring allowed considering the individual features of every parameter instituted into a mathematical modeling describing the rating system indicators. The drifting factor in the indicators counts the introduction of new category of indicators, deleting the existing ones and their relocating between groups. The authors firstly introduced the quantitative indicator on the group variability degree, the value of which facilities identifies the forecasting strategy that might be useful to correct the professional activity in future. With the aim to make prognosis for the general stimulating measure, we propose the holistic methodology, which consists of four modules. The flexible information system in a view of the hypercube and the holistic math model allowed us to conduct the calculation-based experiment to make the forecasts towards the individual and group efficacy indicators. In the experimental course the structural value stability has been identified that does not lead to a sharp change of the quantitative ratio between the group indicators.
Keywords: Managementteachingstaffratingmodelingforecasting
Introduction
The modern higher education system requires the changes in the strategy applying in managing the work efficiency of academic teaching staff (ATS). Based on this statement the authorities of Russian universities take the initiatives in launching new management instruments, and among them very popular and scientifically-proven is a rating system. The rating system aimed at evaluating the work efficiency of ATS is one of the tools that are used for management purposes at universities. The choice of the indicators, including the rating system, defines the strategy and a range and its intensification of the priority activities.
The analysis that that was conducted by Grishina, Saginova and Skorobogatih in (Grishina, Saginova, & Skorobogatih 2015) towards the indicators’ structure used in the Russian and abroad universities showed that the set of basic indicator groups is invariant and defines the main professional activities of ATS. Among these main groups we point out the following activities: educational, scientific, international. As part of the scientific activity we highlight the publication one that is evaluated on the basis of the registered indices used in scientometric international and Russian systems. The advantages and disadvantages of the scientometric system are a debatable question among scientists. However, these systems are the single and reasonable instrument used in evaluation of efficiency and demand of ATS intellectual work results (Brummstein, Baganina, Akhmedov, & Gorbachev, 2016; Bedarkar & Pandita, 2014).
According to in-university regulatory documents an institution makes a connection between the rating system indicators and monetary payments that are paid to ATS as additional money grants for the high achievements in the professional activity and qualification level (Bedarkar, & Pandita, 2014; Yilin, & Yilinova, 2013). The introduction of such monetary grants sometimes significantly changes the payroll rate of ATS and is the effective stimulating measure towards the increase in ATS indicators activity (Feoktistova, 2014; Bocharnikov, 2015; Weihua, 2015). With monetary grants introduction, we face an issue about the balance between the investments reasonability that have been spent to achieve these results, and the ATS salary rate. As the analysis shows (Bedarkar & Pandita, 2014) the gap between these two components is ever-growing. The expenses spent for 1 publication base sheet, in the period since 2005 till 2008 have increased from 287 to 862 rubles, whereas, a monthly salary has changed by 1.2 times when the publication growth rate has increased by 3.92 times.
Problem Statement
In that context the relevant issue is not only to choose the rating system structure but in making prognosis to achieve this result. Universities from the management point are socio-economic objects. Decision making for such structures are a social experiment in the course of which the conditions for activities and process actors’ well-beings. If, when the rating system has been accepted (from 1 to 3 years being in use), there were no other means to declare the indicators, then, in the subsequent period an trial-and-error approach should be excluded from the approaches of decision making (Santos, Amorim, Santos, & Barreto, 2015; Emirov, & Labutina, 2013; Barbakov, & Goreva, 2007; Sidorov, & Baigunchikova, 2015). The system analysis methods and math modeling are coming as alternative ones able to make prognosis towards the results in future (Yamazaki, & Regularity, 2016; Lin Xu, Chao-Fan Xie, Lu-Xiong, & Xu, 2016)
In Nosov Magnitogorsk State Technical University since 2012 the rating system aimed at evaluation and stimulation has been included into the whole management system since 2012. For four years of the system being in use, we managed to collect the data obtained in the course of the social experiment, for which we conducted systematically the analysis allowing to evaluate the quality of the chosen indicators, and hence, the development level the university has achieved according to the State university requirements. The results of this analysis have been presented in (Logunova, Lednov, & Koroleva, 2014; Logunova, Egorova, & Koroleva, 2015) and allowed to identify some advantages and disadvantages of the system that was in use in past period. In order to make a decision about the structure of the indicators and their weight coefficients in the holistic rating system for 2016–2017 academic year there is the opportunity to develop them in a prognosis mode.
Research Questions
The description of the rating system to manage ATS activity is performed with a math dynamic model-support based on drifting arguments, which has the view as:
where – weight coefficients, having the values 0.3 and 0.7, and allowing to perform one group indicators gain; – group-function, featuring ATS qualification; – group-function, featuring ATS level to be active in doing a work (group-activity); – a number of indicators in the groups “qualification” and “activity” during the period under consideration correspondingly.
In the educational institution in the group “activity” as a rule some sub-groups are denoted, which reflect the main professional ATS activities: educational, scientific, international and etc. the set of sub-groups is unique for each university and reflect the goals that the university sets up.
Each from indicators of the group-function is defined by:
a drift – how an indicator enters the rating system and to what group it belongs;
a number of arguments, and their type and a form of dependence;
the parameters’ values, corresponding to each indicator that are in the group.
The initial data used to define the value of the function during the period under consideration view as two-dimensional datasets records, which are structured and where each record has a field:
Where – data set record, corresponding to an employee with a number ; – ID of an employee; – arrays of strings to store the data about an employee (surname, name, patronymic name, scientific degree, job position, department, structural unit); dataset of the ranking assessments of an employee; – a number of participants in rating during the considered time . The dimension of one hypercube layer а; is a variable in each considered period of time.
Storing the several layers of the initial data for the time when the system was in functioning allows to keep in dynamics the history of changes and how the indicators have been changed in their values. The full structure of the initial data forms a hypercube. Graphically, the initial data structure in their accumulation for the several periods of time is introduced in Fig.
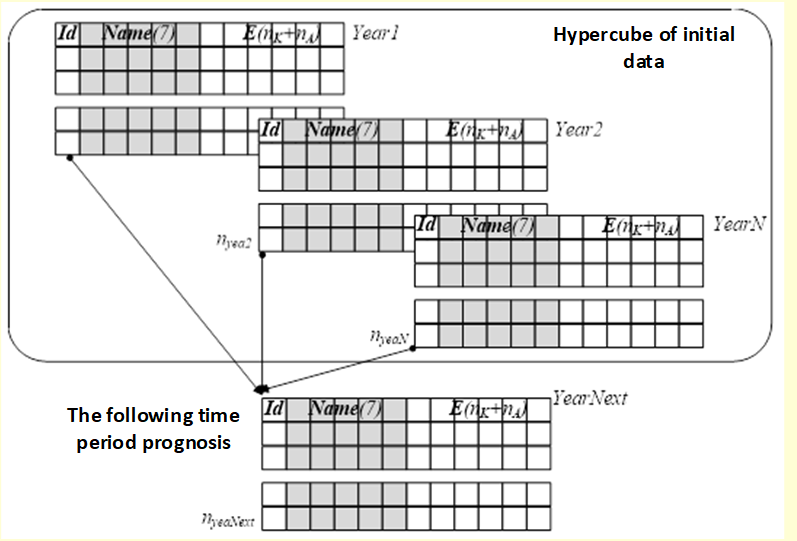
The analysis of this empirical information defines the efficiency level at what the system is functioning and allows to make effective decisions geared at transforming of the rating system indicators.
Purpose of the Study
It can be seen that the existence of the initial data set and motivation to improve critically important university trends development has defined the aim of the research, which is to increase the efficiency in managing of ATS activities based on the scientifically proven principles describing the structure of the rating system and giving the characteristics to the relevance of its indicators; able to make prognosis for future.
Research Methods
Taking into account the drift indicators’ specific aspects and their sensitivity to changed arguments there were built two hypercubes with the initial data: a hypercube with keeping a number of participants in each indicator, excluding the indicator ; a hypercube with a number of project participants after staff optimization.
To make some prognosis for the indicator the following method is proposed:
to generate for the indicator a random number в диапазоне for each project participant;
to introduce the hypothesis about successful completion of online courses depending on a job position: «the possibility of successful course completion in accordance with own willing of ATS amounts to: 20% for professors; 35% – associate professors and 50% – assistances and senior teachers»;
in according to the hypothesis to create a corresponding filed in the hypercube with the initial data (2) with the formula:
where – the condition defined with the hypothesis that formally has a view as:
where – a job position: 1 – professor, head of department, director of institute, dean of faculty; 2 – associate professor; 3 – senior teacher; 4 – assistant;
to calculate the indicator within the group :
Where – a number of project participants with non-zero indicators.
The hypothesis adequacy can be achieved after conducting the analysis on the results obtained within the period under consideration that was in prognosis. Under described modeling conditions we get the following statistical data for the indicator :
average number of participants – 200 (20.3%):
total score – 7800:
average score per one participant – 40.
With the aim to forecast the publication activity values, we propose to use the methodology based on changes in total score with a correction index and on indicators’ gain that is predicted for the previous periods under consideration. Indicators’ correction is carried out with the formula:
where 0.7 – group weight coefficient; 3 and 15 – assigned coefficients for an indicator; and – a number of publication performed by the university under prognosis in 2016; – index, describing a particular status of a publication (article published in high rating journals or a book) that is defined with the equation:
where and – corresponding quantitative indicators of the institute in 2015 and 2014;
where – the total value of h-index of the project participants in 2015 году; – the total value of h-index without self-citation in 2015; 1 and 4 – assigned indicators parameters; – correction index on h-index gain that is found with the equation:
Where and – the values of h-index of the institution in 2015 and 2014 and on 27.07.2016 the value of the correction index was 1.049;
Where – the assigned parameter; – weighted average journals impact factor in which the university had publications in 2015; – a correction index characterizing the constant gain of journals’ impact factors that is defined with the formula (10); – a number of journals under prognosis in 2016, that is defined with the equation (11):
where и – the average value of journals’ impact-factors, where there were publications of the university in 2015 and 2014; and – a number of journal publications in 2015 and 2014 and on 27.07.2016 the correlation index value was 1.86.
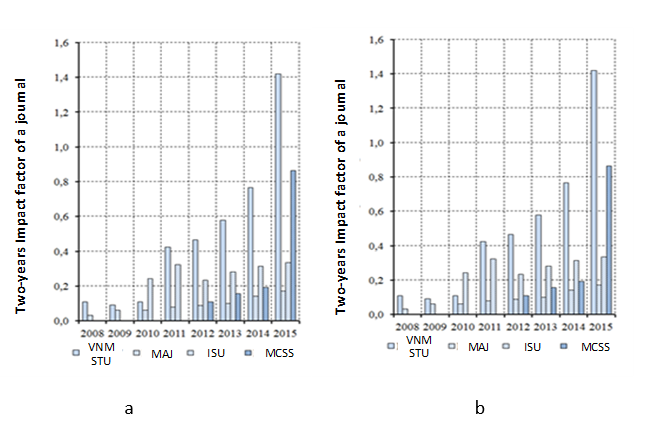
The parameter
is the phenomenon beyond the prognosis. During 2014–2015 there was a sharp leap up in impact-factors value actually in all journals. Figure
Therefore, the prognosis of the impact-factor value in correspondence to is a guess-work. Hence, for we take the method of balanced limitation. According to the method the balance between the indicators of the group responsible for publication activity should be followed. For example, let us set the limits from 25 till 50% from the total sum of the indicators belonging to the group :
With simple analytical calculations we get the limits for the parameter value :
Thus, the prognosis for the group indicators is becoming balanced.
Findings
The initial data for the indicators of the group
are introduced in table
With the initial data of table
The total score is:
On average one participant of the project had from 40 till 69 points.
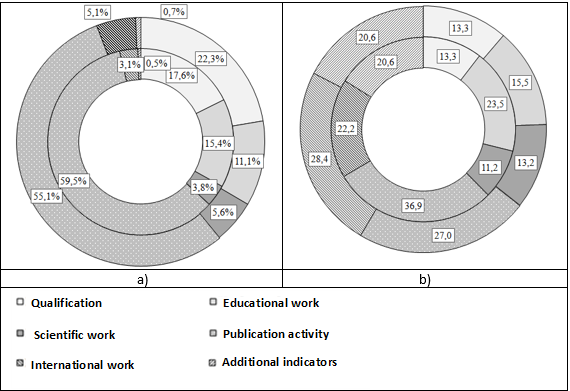
The result on structure changes in group assessment in 2016 that was under prognosis and in 2015 that was under consideration when
is introduced in figure
Conclusion
-
The modern management systems involved into the university management requires inserting new forms of managing and one of them is the rating system. The main part of the math model is relatively simple and, as a rule, based on the linear combination of the chosen indicators and weight coefficients. However, each period under consideration demands not only the analysis of the results but either making prognosis on expected future achievements.
-
When making the results prognosis, we have to take into consideration a particular nature of some indicators, such as indicators’ drift, variability on dependence form, and parameters values. The drift view denotes the prognosis strategy and the structure changes in the initial data hypercube.
-
For new-introducing indicators the prognosis method is to be chosen, which is determined with its meaning and with the time dynamics. As basic methods we recommend to use the method of generating values for random processes that have the limits with the hypothesis stated; and the balance-interval method allowing to assign parameters after the time period expired, it is needed to keep the balance between the indicators inside the group.
The strategy to be used with account of working indicators’ drifting and the assessment of new introducing indicators enabled to make the prognosis geared at the new system structure and to balance the indicators of the publication activity group.
References
- Barbakov, O. M, Goreva, O. M. (2007). Social experiment on the virtual space as a form of control of innovative technologies in the system of higher education. Proceedings of higher educational institutions. Sociology. Economy. Politics, 4, 86–89.
- Bedarkar, M., Pandita, D. A. (2014). Study on the Drivers of Employee Engagement Impacting Employee Performance. Social and Behavioral Sciences, 133, 106-115.
- Bocharnikov, D. A. (2015). Some problems of the remuneration system of scientific and pedagogical, employees belonging to the teaching staff. Actual problems of Russian law, 10 (59). 120-125.
- Brummstein, I. Yu., Baganina, A. A., Akhmedov, R. R., Gorbachev, A. N. (2016). Comparison of the scientometric indicators of publication activity universities in the Caspian regions of Russia Caspian journal: management and high technology, 1 (33), 79–90.
- Emirov, N. D., Labutina, L. M. (2013). Social experiment and promotion of innovative technologies of management in the social sphere. Bulletin IzhSTU, 3 (59), 68–71.
- Feoktistova, O. A. (2014). The results of the work of researchers: tools of state quality incentives, 5 (24), 1–17.
- Grishina, O. A., Saginova, O. V., Skorobogatykh I. I. (2015). Evaluation of the effectiveness of the teacher in a modern educational institution. Novosibirsk: TsrNS Publishing House.
- Ilyin, A. E., Ilyinova, O. V. (2013). The economic essence and elements of the system of material incentives. Bulletin of the Kursk State Agricultural Academy, 9, 2-5.
- Lin Xu, Chao-Fan Xie, Lu-Xiong Xu. (2016). The International System for Comparison and the Economic Distribution System. Advances in Intelligent Systems and Computing, 10, 35–42.
- Logunova, O. S, Lednov, A. V., Koroleva, V. V. (2014). The results of the analysis of the publication activity of the faculty of the Magnitogorsk State Technical University. G.I. Nosov ". Bulletin of Magnitogorsk State Technical University. G.I. Nosov, 3 (47), 78–87.
- Logunova, O. S., Egorova, L. G., Koroleva, V. V. (2015). Dynamics of indicators of publication activity of the faculty of Magnitogorsk State Technical University. G.I. Nosov. Bulletin of Magnitogorsk State Technical University. G.I. Nosov, 3 (51), 101–112.
- Santos, L. M., Amorim, L. D., Santos, D. N., Barreto, M. L. (2015) Measuring the level of social support using latent class analysis. Social Science Research, 50, 139 - 146.
- Sidorov, A. A., Baygunchova, A. T. (2015). Social experiment "the price of modern society. In Resource efficient technologies - energy and enthusiasm of the young. Proc. Of VI All-Russian Conference. Tomsk: National Research Tomsk Polytechnic University.
- Weihua, An. (2015) Instrumental variables estimates for social networks. Social Science Research, 50, 382 - 394.
- Yamazaki, K. (2016). Criteria of the three-dimensional MHD system. Nonlinear Analysis: Theory, Methods & Applications, 135, 73-83.
Copyright information

This work is licensed under a Creative Commons Attribution-NonCommercial-NoDerivatives 4.0 International License.
About this article
Publication Date
29 March 2019
Article Doi
eBook ISBN
978-1-80296-057-0
Publisher
Future Academy
Volume
58
Print ISBN (optional)
-
Edition Number
1st Edition
Pages
1-2787
Subjects
Sociolinguistics, linguistics, semantics, discourse analysis, science, technology, society
Cite this article as:
Logunov, O., Koroleva, V., & Kozherchinskay, Y. (2019). Management In Academic Teaching Staff Activity: Modeling Of Rating System Indicators. In D. K. Bataev (Ed.), Social and Cultural Transformations in the Context of Modern Globalism, vol 58. European Proceedings of Social and Behavioural Sciences (pp. 529-538). Future Academy. https://doi.org/10.15405/epsbs.2019.03.02.60