“Convenient” Correlational Errors In Modern Psychological Science (Mathematical Aspect)
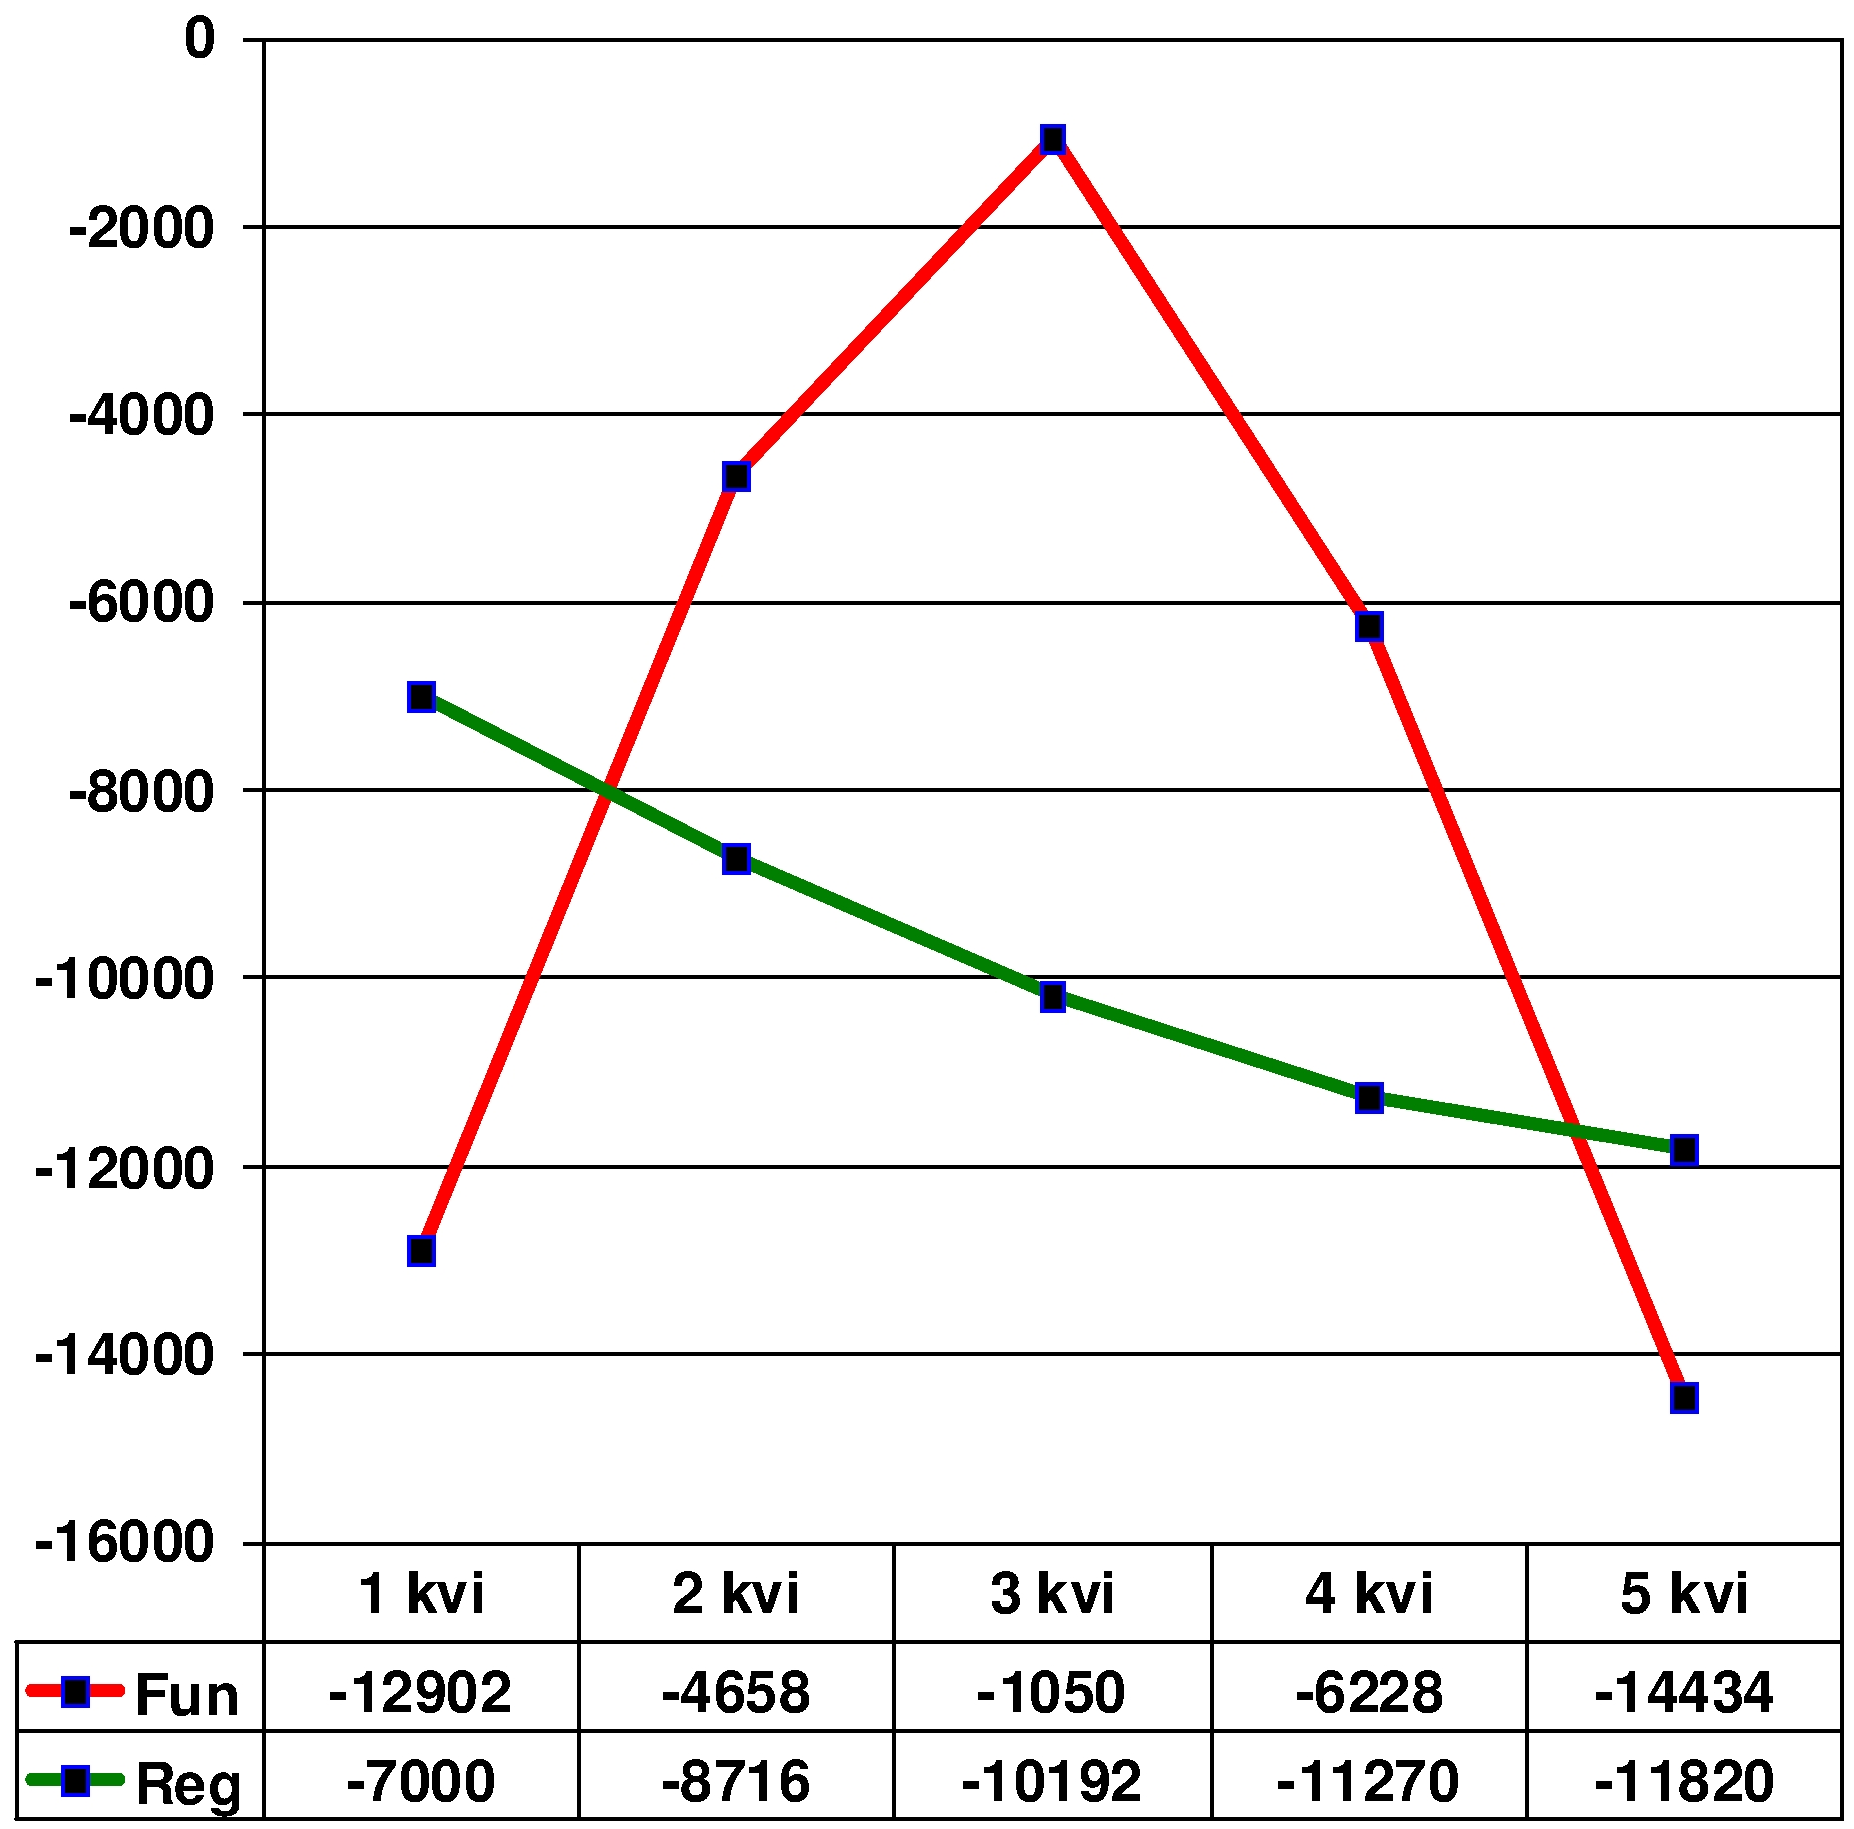
Figure 4: Graph of dependency for a function with an unsymmetrical maximum (cut on the left): "Y= -X2" (to the left of the maximum); "Y= -1.4*X2" (to the right of the maximum) and a regression straight line based on the linear correlation