Abstract
The article addresses the issue of studying the statistical dependencies in psychological research. In the main, psychologists propose, based on their data, interpretations of only linear relations and linear models. The problem, however, emerges not only in the fact that while interpreting the linear dependencies, the psychologists ignore and often do not understand the great number of simply-shaped non-linear relations (Type 1 errors). Over the last 20-25 years the focus has been mainly on not such simple processes that might fit into linear models. Knowingly or not so, the psychologists took up a method in which weak (very weak) linear relations (virtually no strong ones are detected except between related parameters), with reference to the hypothesis that the correlation coefficient is equal to zero, started being presented as “meaningful” correlations that are covertly implied to be sufficiently strong and worth consideration for interpreting the results. Indeed, quite a few such correlations have been detected so that this supplied material for lengthy articles. However, a still more serious error lies here (Type 2 errors) when the simplest non-linear dependencies are not just ignored, but instead of strong simply-shaped non-linear dependencies between parameters only their linear approximations featuring a weak correlation (0.2-0.3) are supplied, which completely distorts the real picture. Thus, a scientific knowledge is produced which does not correspond to realities and promotes the parallel development of practical psychology based mainly on the intuitive understanding of the client’s problems and attempts to help him/her.
Keywords: Non-linearitycomparative weightinessquantiledependencefactor of the connection strengthcoefficient of correlation
Introduction
The European as well as other psychological communities support an obviously pseudo-scientific approach that has established itself in the last 20 to 25 years according to which the very weak (0.2-0.3) and weak correlations are presented as “meaningful” and described as sufficiently strong relations (the saving SPSS asterisks) that are worth description and interpretation in publications.
Problem Statement
The following statistics show the problem and its relevance. For comparison, let us start with sociology. Most sociologists as well as psychologists are very far from the concept of non-linearity, which is confirmed, for instance, by the last but one European congress “The 11th Conference of the European Sociological Association 2013 (Torino)” (ESA, 2013), in whose theses the terms “non-linear” or “nonlinear” as a word or part of a word are encountered (except our materials, 4 reports) only in 10 theses (a total of around 3000 theses). Under such circumstances, those are mainly general phrases about non-linearity and the authors are far from a concrete realization of this concept. Farther on, the situation does not change at all. In materials of the latest European congress “The 12th Conference of the European Sociological Association 2015 (Prague)” (ESA, 2015), the term “non-linear” or “nonlinear” occurs in 11 theses (a total of more than 3000 theses).
The situation is still more problematic in psychology even though for psychology this problem is still more meaningful in terms of contents and methods. In materials of “The 12th European Congress of Psychology (Istanbul 2011 04-08 July)” (ECP, 2011), the term “non-linear” or “nonlinear” occurs (except our materials, 10 reports) only in 3 theses (in a total of around 3000 theses). Farther on, the situation does not change dramatically either: in materials of the latest European congress “The 14th Conference of the European Congress of Psychology (Milan, Italy, 7-10 July, 2015)” (ECP, 2015) the term “non-linear” or “nonlinear” occurs (except our materials, 12 reports) only in 4 theses (in a total of around 2500 theses).
The analysis of the articles allows a conclusion that most psychologists detect relations between the parameters under study and use for this purpose mostly the correlation analysis. Proposed as results is a set of the so-called “meaningful” coefficients of correlations. This is a test of the hypothesis about the correlation coefficient being equal to zero when the existence of a relation is transferred to the general combination with a shift of the zero point to the critical value determined by the amount of sampling.
Research Questions
A situation emerges in which a sufficient sample (of around 100) has a critical value close to 0.2 and a very weak correlation (0.2-0.3) is often interpreted as virtually strong. One can observe a massive exit (intentional or unintentional) into an area of low values of the correlation coefficient when “a zero correlation” becomes sufficient to describe the relations as strong. This results from the shortage of strong linear relations (greater than 0.6 or at least 0.5 by module) when sophisticated psychological objects, mainly non-linear by nature, come under study.
Two global splits occur in psychology. On the one hand, a methodologically non-linear nature of psychological phenomena is not denied and a narrow circle of psychologists operates in the framework of a synergetic paradigm, partially addressing the emerging problems. However, the overwhelming majority of psychologists, even those treating synergetics as a new methodological phase, still remain in their experimental work within the bounds of linear notions. The strong linear relations (except, for instance, relations between indicator-synonyms) are becoming very rare so that the authors start describing in their articles numerous very weak correlations (up to 0.3) whose listing takes up 5 to 6 pages.
Whereas the first error is just wishful thinking without relation to reality in which neither linear nor simplest non-linear relation exists, the second one may be regarded as very rude since the relation with the weak correlation is “detected”, but in actual fact it is fairly strong and different in nature, i.e. non-linear (more often with a maximum or a minimum). It means that in order to detect and interpret it, other statistical methods are needed that correspond to the complex nature of psychological phenomena. The overwhelming majority of psychologists, by virtue of their efforts, especially in the last 20-25 years, have produced a pseudo-scientific knowledge whose nature resembles an avalanche. Students and post-graduates are taught how to obtain precisely this kind of knowledge.
So a second split occurs between experimental and practical psychology when linear models give a false picture of the subject under study and when it is believed that a profuse scientific knowledge does not benefit a practical psychologist who needs to build up his experience, which by nature is primarily intuitive process.
The psychologists keep speaking about the complex nature of their subject of research, i.e. psyche (mind), but in doing so they very seldom (except, for instance, in case of psycho-physiology) consider in their studies the interpretations based on results of the correlation analysis and hence the mechanistic approach, the methodology of the late 18th century. Under such circumstances, the sciences that study “simpler” (as psychologists assert) subjects, such as physics, have passed in their methodological development the non-classical (the early 20th century) and post-non-classical (the late 20th century) stages of development.
In order to find a way out of this methodological deadlock, one must accept the fact that in their studies the psychologists, along with linear relations, must also consider the simplest non-linear relations that have a psychological meaning and explain many phenomena being studied by psychology.
Also, one should not try to build models with sophisticated dependencies, given that in any case a number of dots can be connected by a curve that is a nth-degree polynomial, which makes it possible to formally obtain a functional dependency for any case of analyzing experimental data. As for the simplest non-linear dependencies, they are always sufficiently numerous in order to completely reveal the relations between experimental parameters under study.
In the early 20th century, the statistical methods started to penetrate psychology. The Pearson’s correlation coefficient was developed as a tool for studying cause-and-effect relations along with its simplification for other (non-interval) types of variables (for example, Spearman’s coefficient for ordinal variables).What was then often studied for establishing the relations represented related parameters, such as stability and distribution of attention, numerical and verbal reasoning, etc. or really scarce pairs of proportional parameters for which the Pearson’s correlation coefficient supplied plentiful information.
At present, if a fairly sophisticated research subject is formulated for a dissertation or a graduation work, we shall by no means detect strong linear relations between unrelated parameters. Between the related parameters within a single method there are always linear correlations (MMPI scales, T. Leary’s test, etc.). Therefore, an author of the dissertation (post-graduation work) encounters a dilemma of offering an interesting research work, rich in contents, and be left without strong correlative relations or considering two synonyms (or several pairs of synonyms) and establishing between them strong linear relations based on correlation analysis.
As a result, the psychologists have developed a research stereotype. On the one hand, it means not understanding and rejection of non-linearity as a basis of methodology (which is aggravated by the lack of accessible instruments for analyzing experimental data), while on the other hand, an attempt to cling to linear models and, not finding in them a solution to the problem (except just trivial results) make – knowingly or unknowingly – a substitution, which allows presenting very weak correlations (0.2-0.3) as meaningful ones, which makes it possible to speak about results supplied by a large set of detected relations between the parameters being studied.
It means that the psychologists still overwhelmingly abide by the methods of the late 18th century (linearity, principle of super-position, etc.). The fashion for synergetics manifests itself in that the dissertation includes synergetic contents as a methodological introduction, but farther on the analysis of data is made using the linear approach (Ermolaev, 2011; Rubtsova, 2002).
When they speak about the complex nature of mind and personality, in overwhelming majority of studies this is not detected by statistical methods based on analysis of experimental data. The dot charts are also built very seldom though this alone could make most researchers think that the study of the subject should be made not only on the basis of linear models (linear dependencies established by the correlation analysis), but also an attempt must be made to start studying the simplest non-linear dependencies and interpret them which indisputably makes the process more complex and is often beyond the sphere of professional interests of psychologists.
Purpose of the Study
Based on the author’s method of multiple comparison, a new approach was elaborated for studying variously-shaped statistical dependencies, which method employs a generalized version of the multiple comparison method for quantile splitting (triads, quarters, quinters) of data by each parameter being measured so that there is no need to preliminarily propose a hypothesis about the shape of dependence.
As a result, the strength and shape of dependence are determined while linear dependencies are established as a specific particular case. The proposed approach not only enables the simultaneous tracking of various types of non-linear dependencies, but also makes it possible to determine for which intervals of parameter values those dependencies are observed. This allows a more precise interpretation of results. The synergic mode of thinking is a way of thinking employed by post-non-classical science. “Non-linearity” is a fundamental conceptual node of the new paradigm. The research into any psychological process and phenomenon will be artificially simplified to the extreme and restricted by the external framework if a researcher, while studying a multi-dimensional psychological phenomenon, remains exclusively within the linear notions (Danilov, 2016).
Research Methods
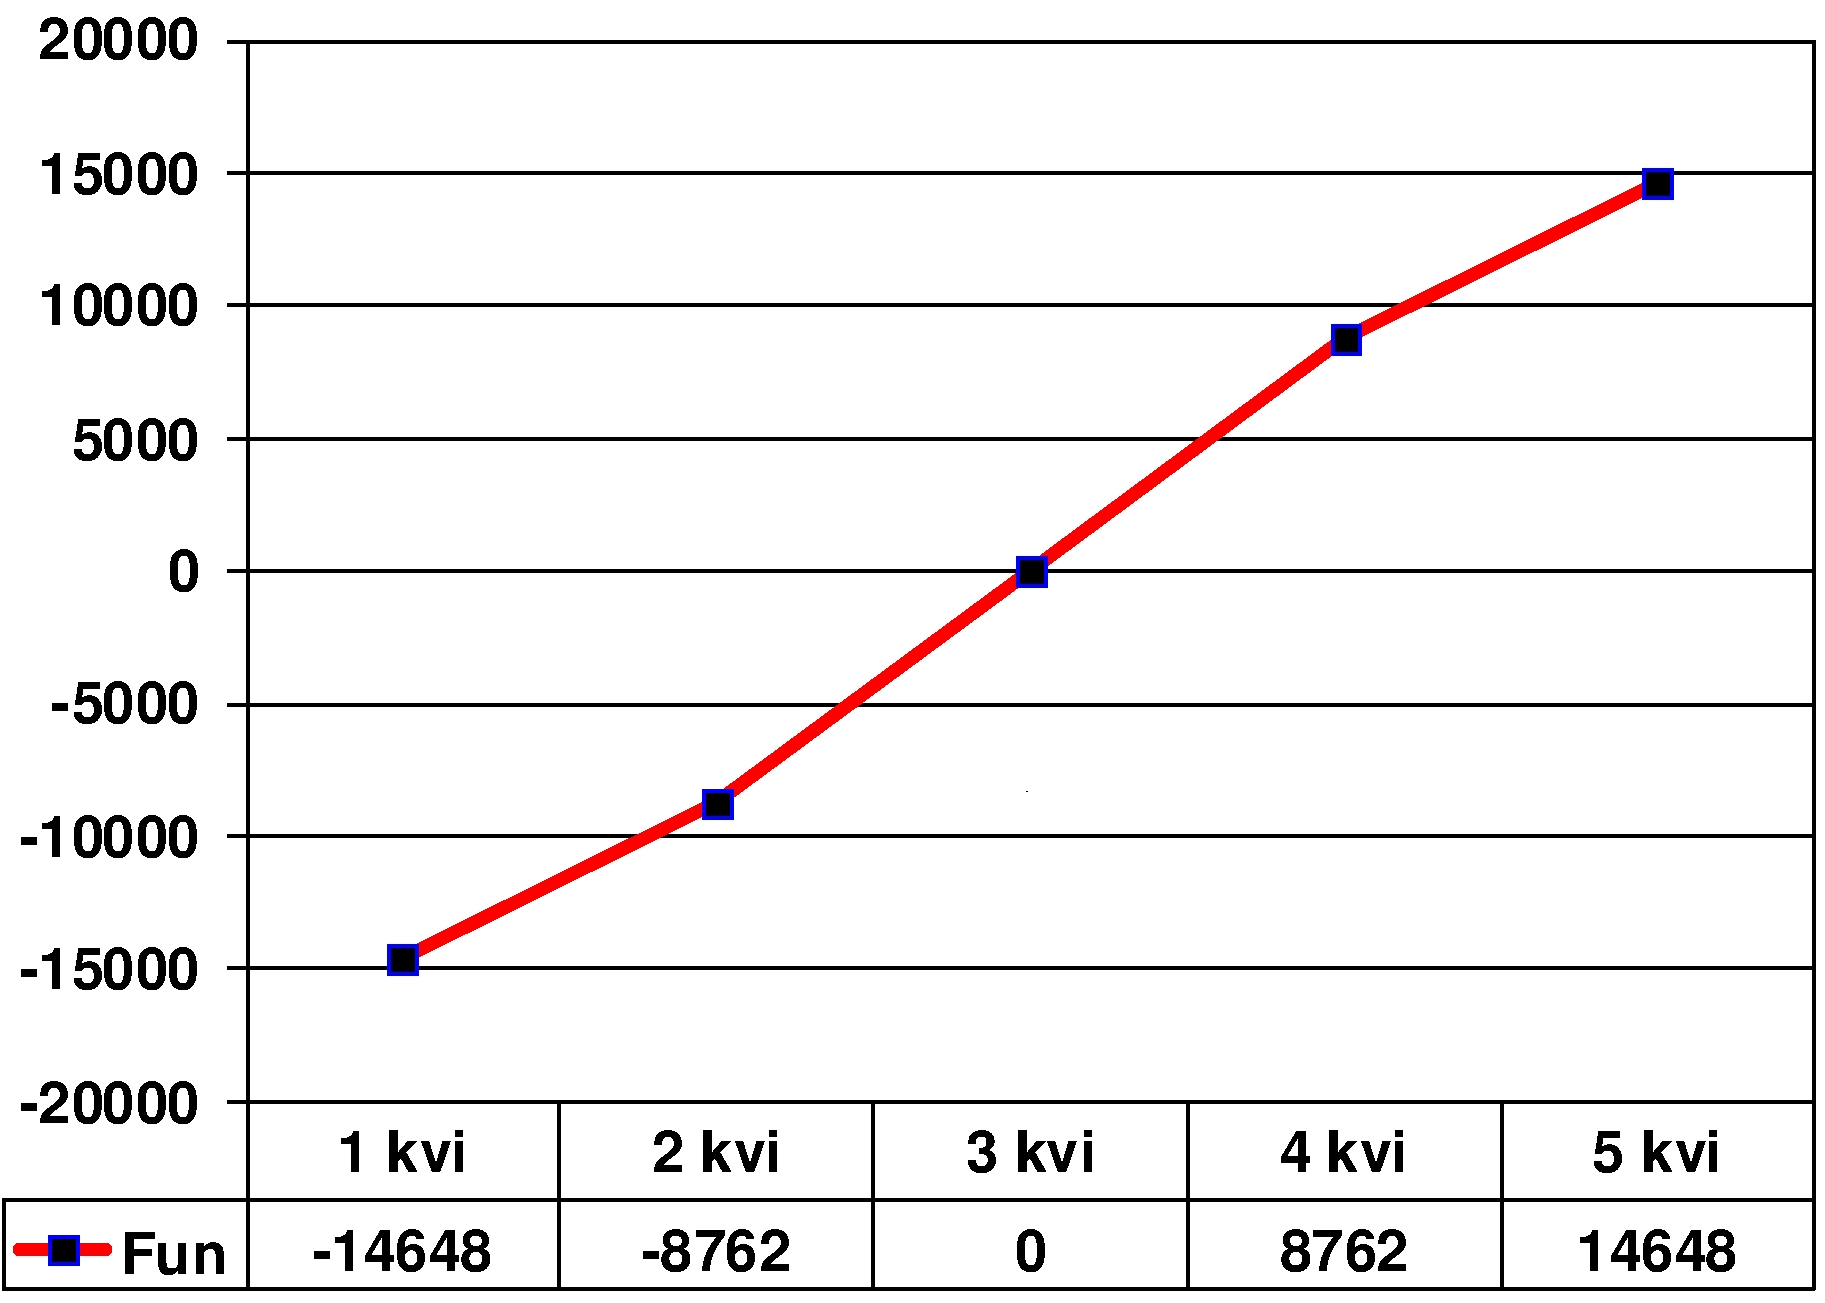
Dependence of parameter
The graph of dependence of parameter
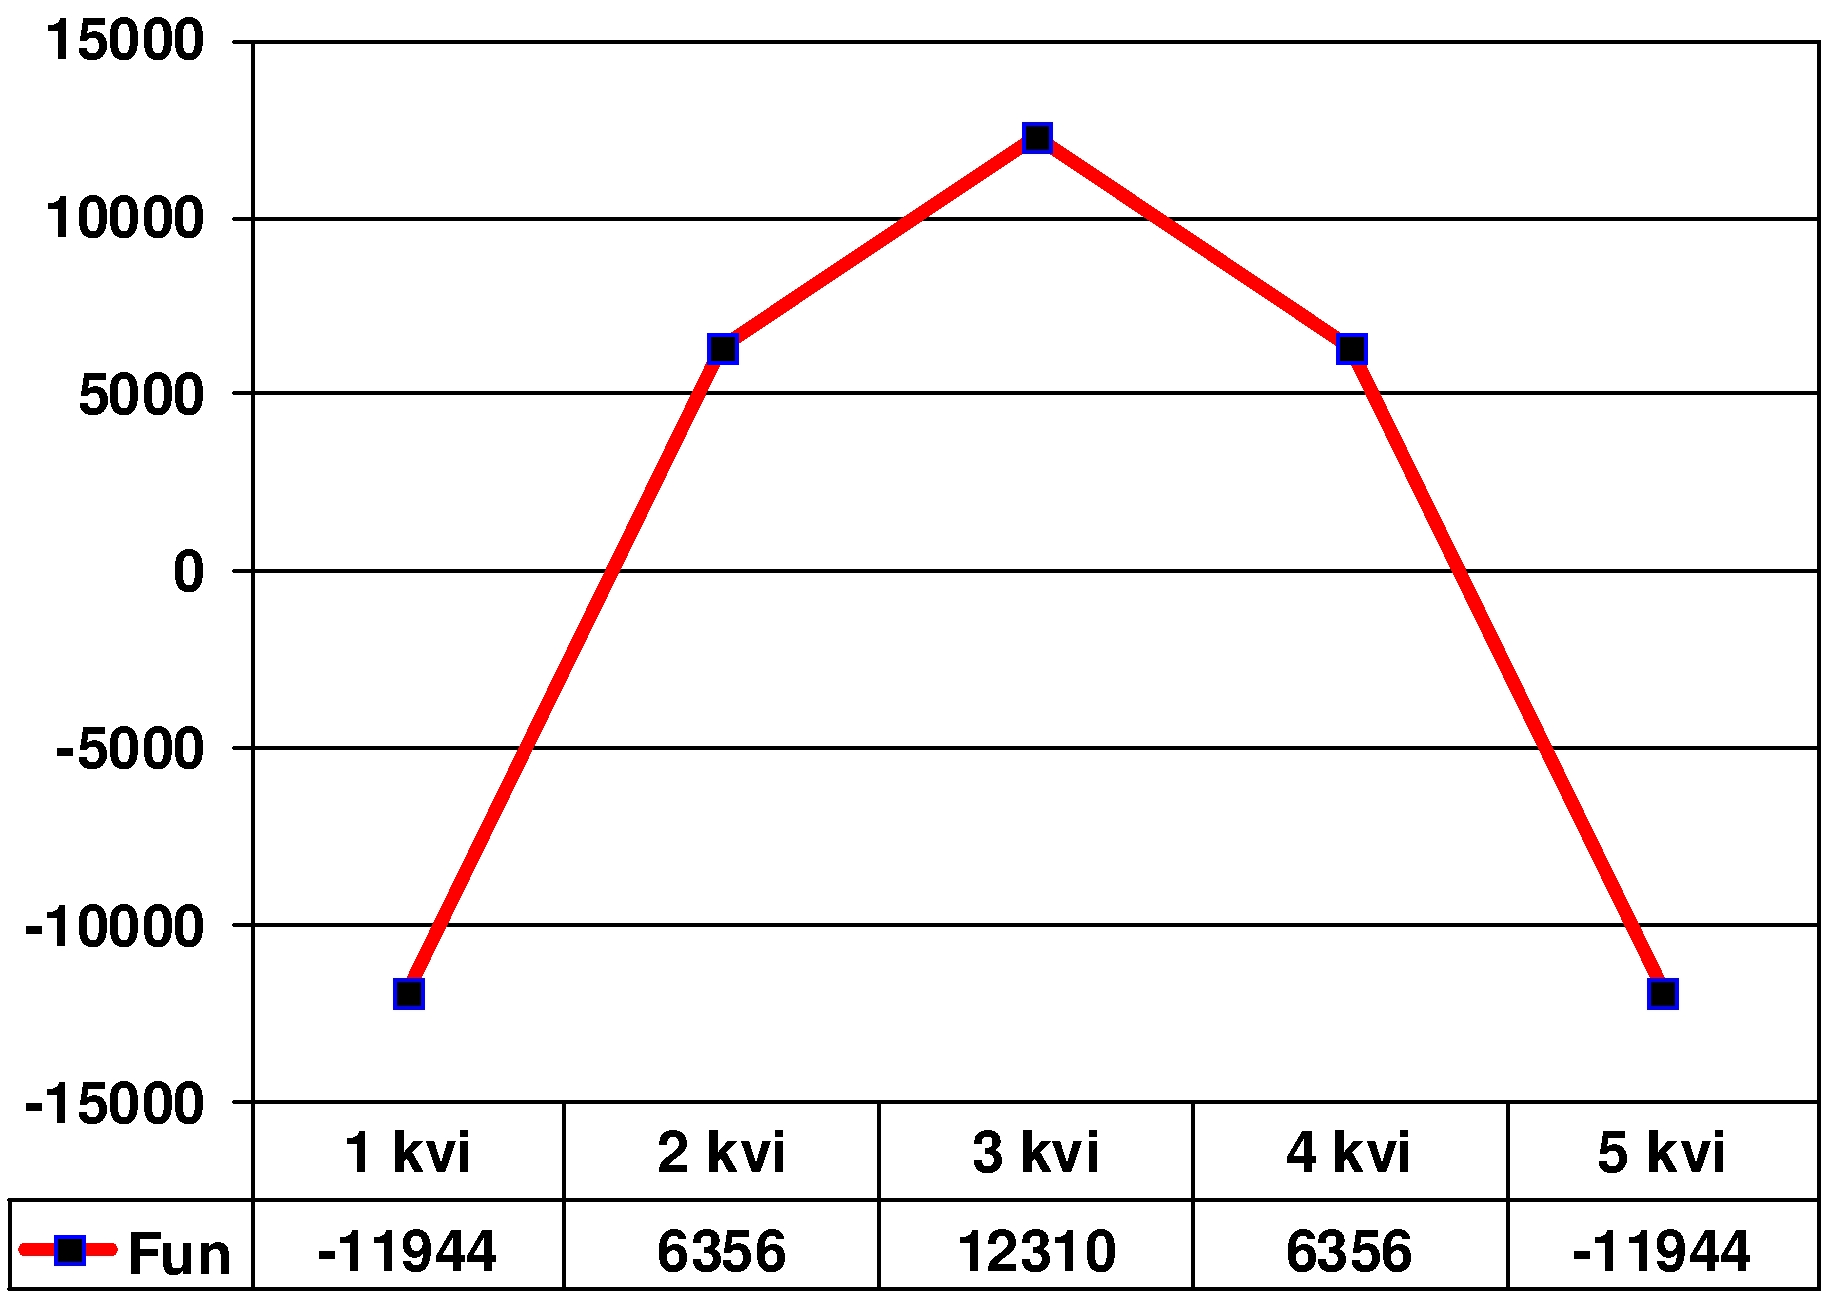
Let us consider, as qualitatively opposite, an example of dependence of an even function (a parabola with a maximum) on the linear function (the dependence of
Dependence of parameter
The graph of dependence of parameter Y= -X2 on the parameter X is given in Figure


However, in this case there will be no error with an erroneous interpretation since the dependency is not fixed and, consequently, not interpreted. In actual fact, it does “not” exist. But if this dependency is not quite symmetrical and a correlation coefficient is detected close to 0.2-0.25, then many researchers tend to grasp such “a meaningful” (in terms of SPSS) correlation as straw and interpret the relation as linear, which is a gross blunder both technically and methodologically.
Further, let us consider individual informative results of solving the model problem, which makes it possible to demonstrate the declared issue and system errors arising in the wake of the method accepted by modern psychological community in analyzing the statistical dependencies.
The model sample being considered (an idealized mathematical problem) displays parameters (a total of 58) presented both by mathematical functions (30 parameters) and their regression models (28 parameters) based on the linear correlation.
There are dependencies with a maximum presented among the mathematical functions, and dependencies with a minimum, along with monotonously increasing and decreasing dependencies, including linear ones.
For example, among the functions with a minimum in the problem for studying the dependencies there were included 9 parameters on the basis of function y=x2, when to the left of the minimum the function is set by formula y=x2, and to the right of the minimum, excepting one symmetrical version, we set four versions of the graph squeezed along the Y axis: 0.5*x2; 0.6*x2; 0.7*x2; 0.8*x2 and four versions of the graph stretched along the Y axis: 1.2*x2; 1.3*x2; 1.4*x2; 1.5*x2. Similarly, the next 9 parameters were obtained using a function with a maximum y=-x2. Among the monotonous functions included in the problem of studying the dependencies, it is possible to point out three increasing and three decreasing linear functions as well as three increasing non-linear functions based on function y=x3 and three decreasing non-linear functions based on functions y=-x3.For 28 functions (except two even and strictly symmetrical functions y=x2 and y=-x2), regression models were built on the basis of the linear correlation.
Findings
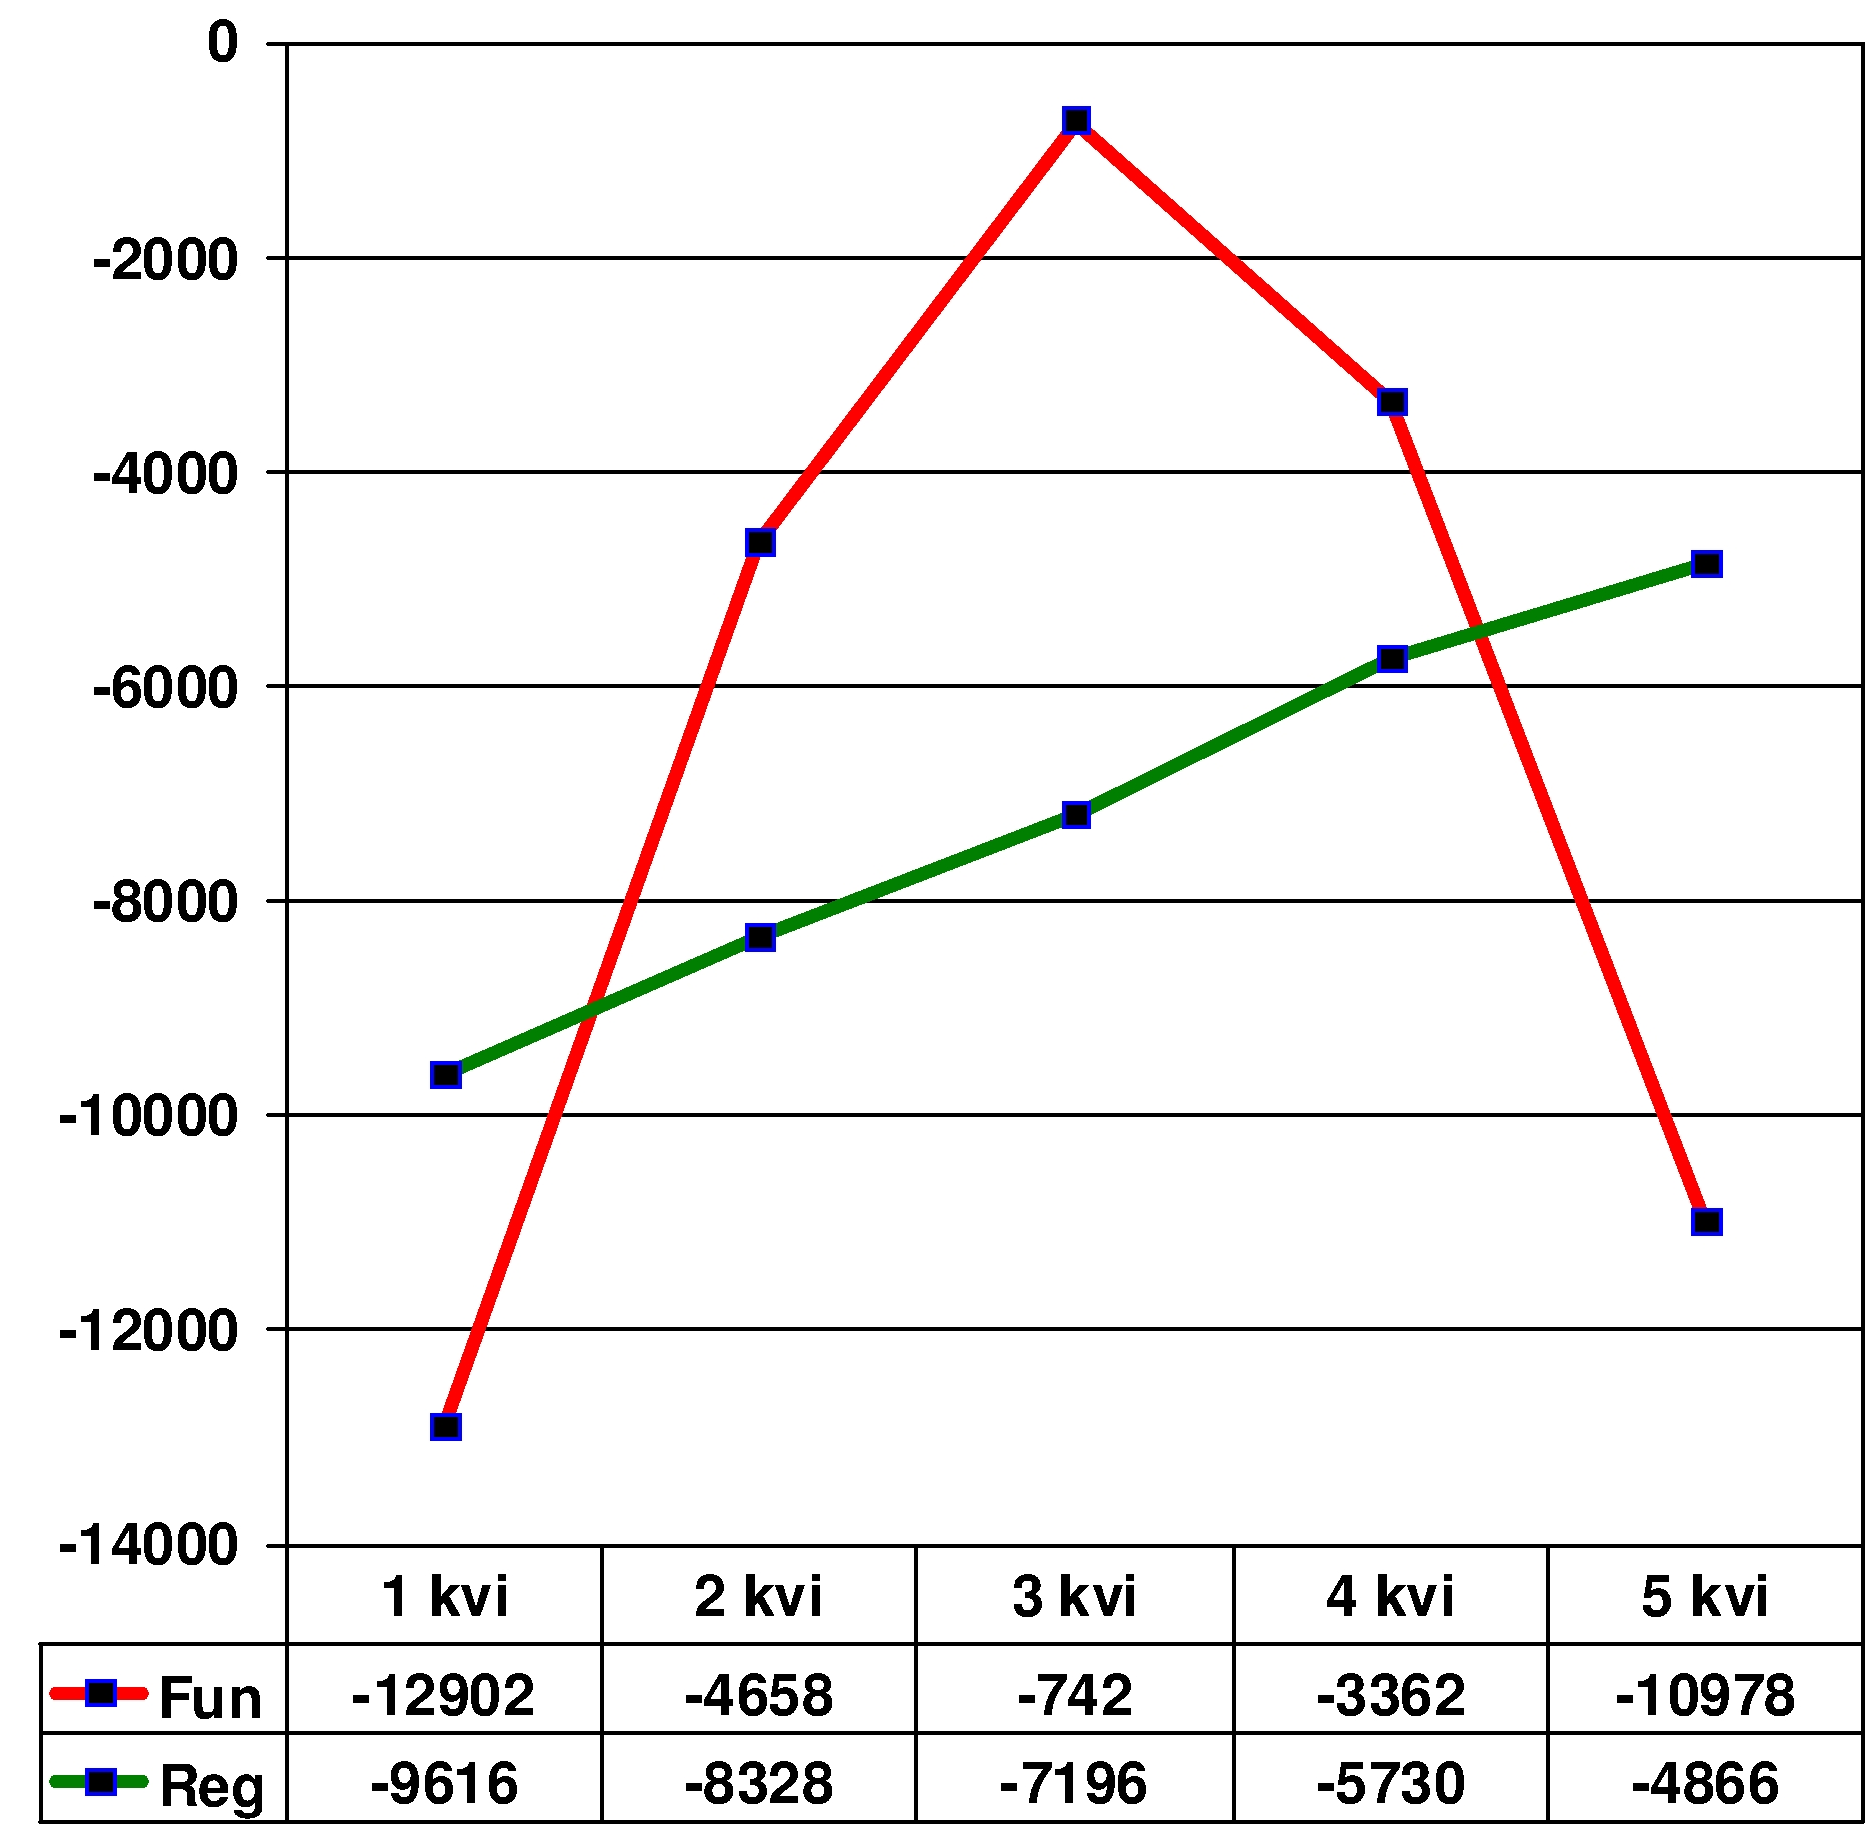
Let us consider two dependencies which graphically show the psychologists’ problems as they address in their articles “the meaningful correlation” (in terms of SPSS). The dependencies are curves with a maximum but having an unsymmetrical shape. In this case, unlike the symmetrical curve with a zero correlation, the obtained correlation will be not zero, though insignificant (very weak) in the absolute value. However, we shall choose the cases in which the correlation is embraced by the hypothesis about being equal to zero and can be interpreted as “meaningful.”
1. A dependency for a function with a single maximum (cut off on the right):
In this case, the correlation coefficient is equal to 0.25.
The charts (Figure


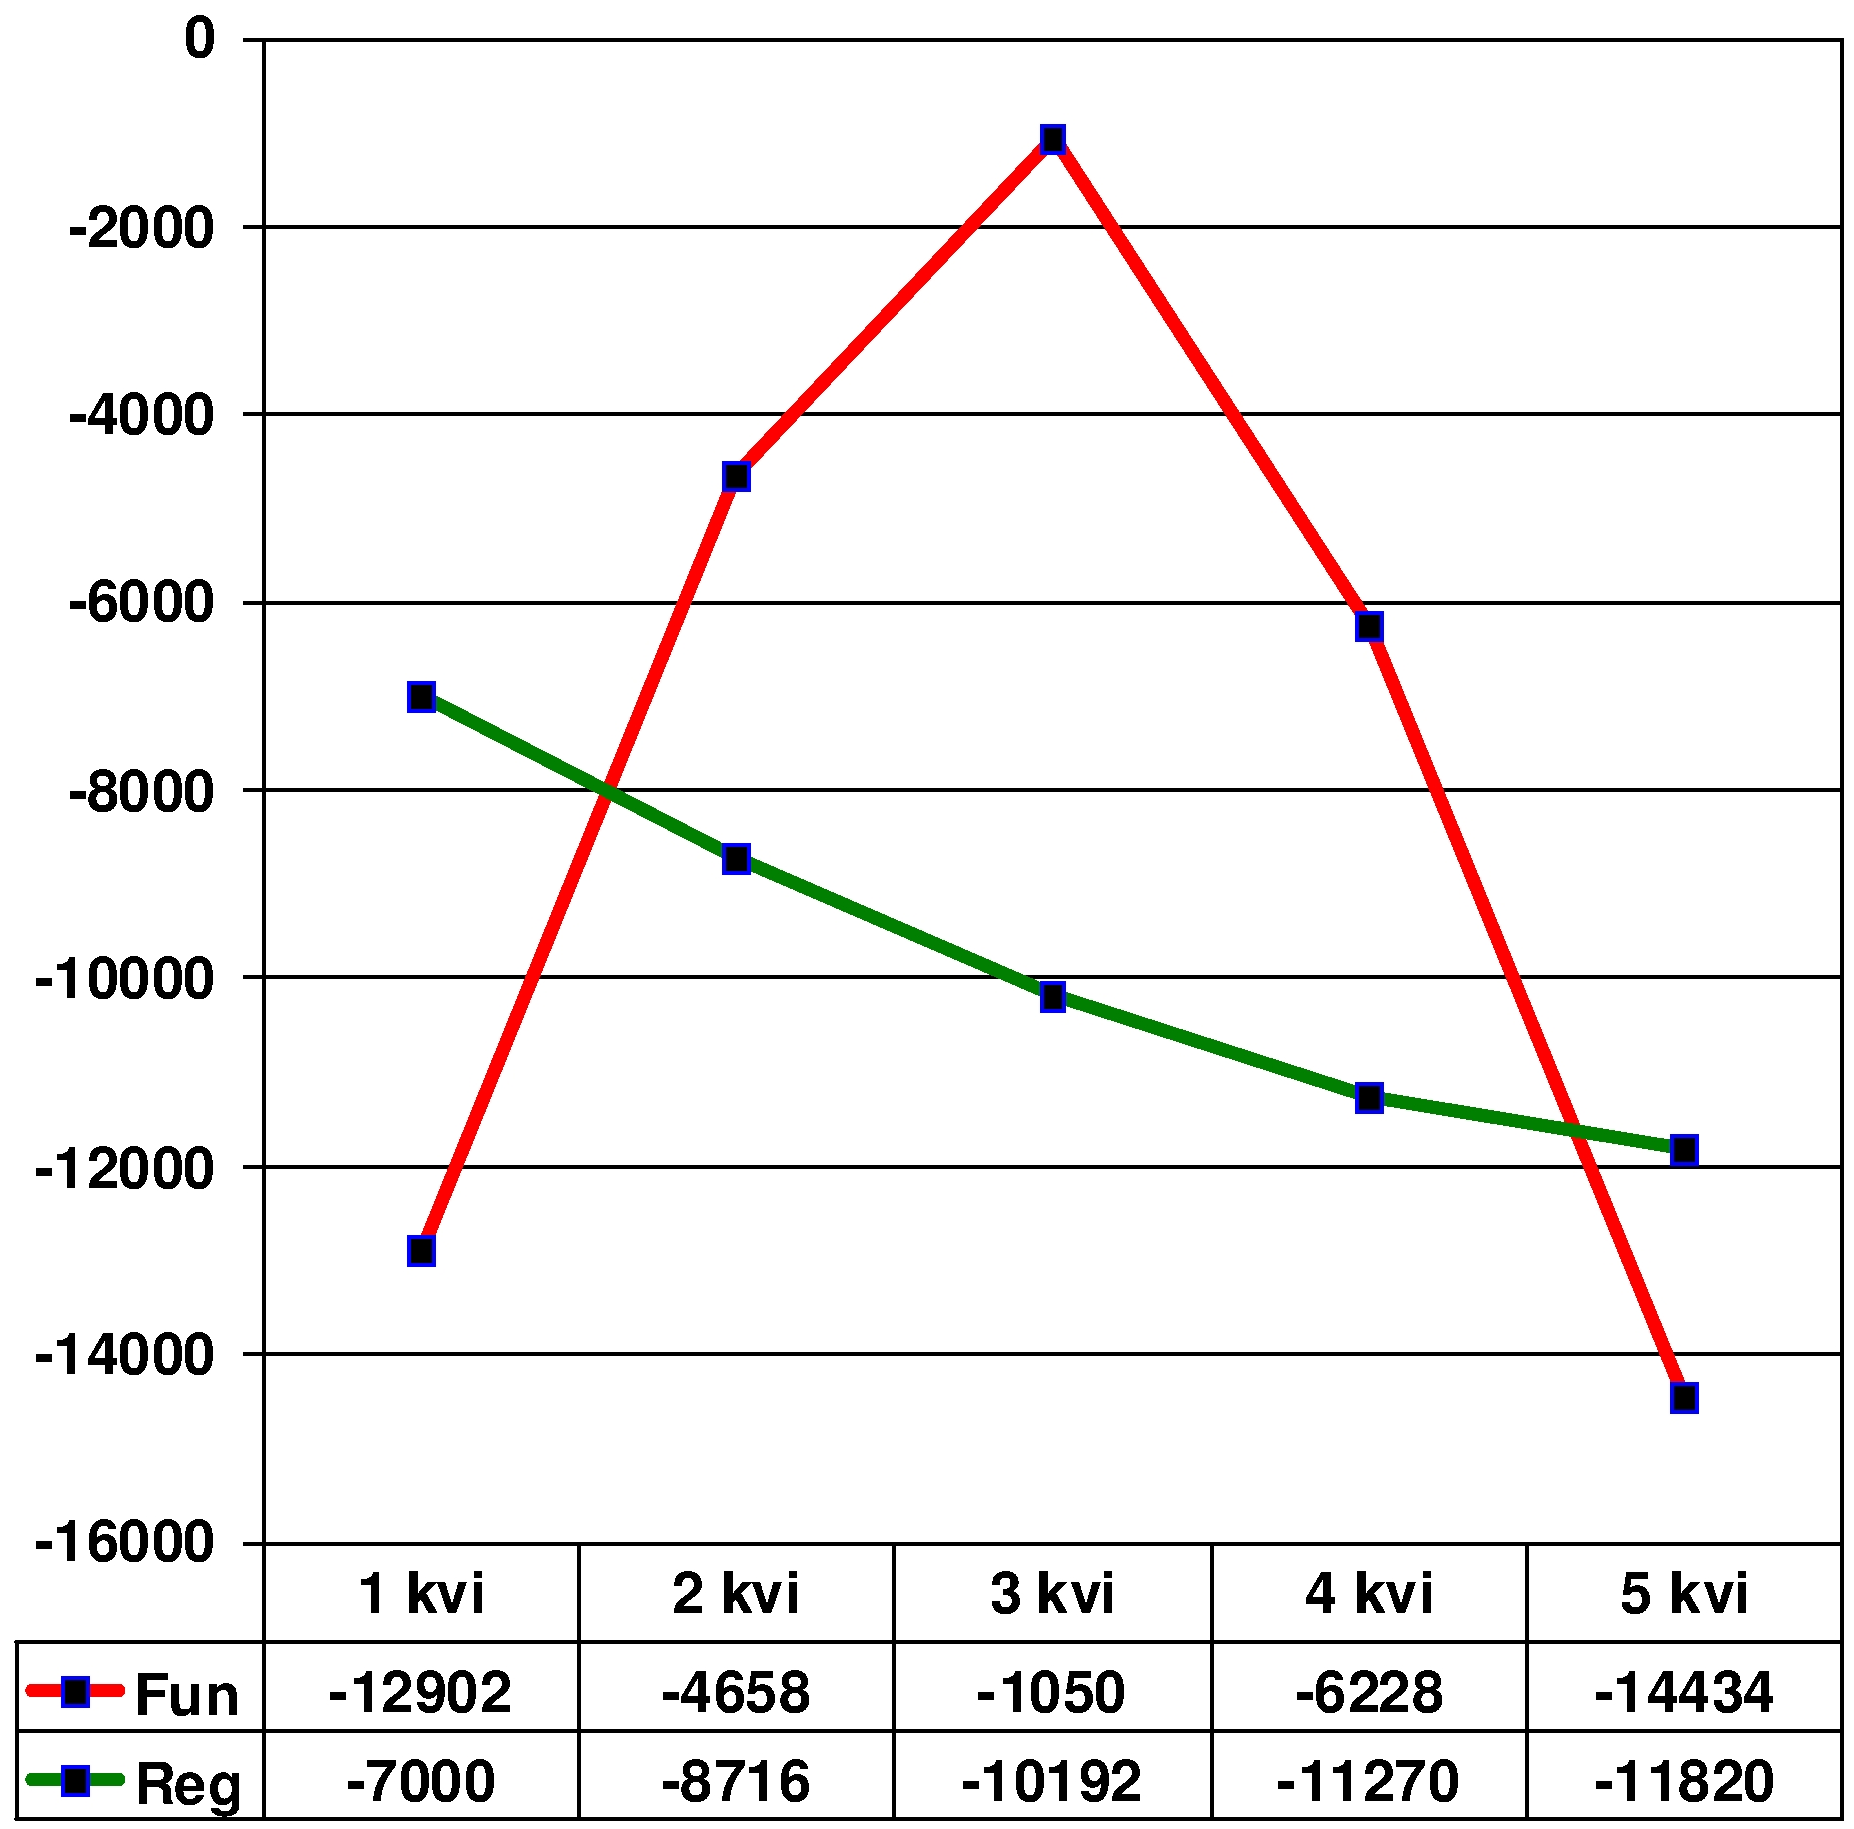
2. A dependency for a function with a single maximum (cut off on the left):
Y= -X2 (left from the maximum);
Y= -1.4*X2 (right from the maximum)
In this case, the correlation coefficient is equal to -0.23.
2.1. Dependence of parameter Yon parameter X as comparative weightiness of parameter Y for quinters on scale X:
The charts (Figure
Conclusion
In order to overcome the said problems, we use the author’s approach to the notion of statistical dependence (non-linear, linear) in psychological and sociological studies. In addition to the method of studying the dependencies, we propose a method, implemented under a programme, for classifying dependencies in the framework of dependency models for triads and quarters of the independent parameter.
The study of non-linear relations by the author’s method (Basimov, 2009) was tested in different psychological studies presenting diverse areas of the psychological science (Basimov, 2017), such as the psychology of preschool children and teenagers, the political psychology, the ethno-psychology, the occupational psychology (Basimova, 2016), the psychology of trust, the psychology of Personality (Basimova, 2016) , the psychology of stress, the psychology of parenthood (Padurina, 2012), the psychology of learning, the measuring of the value-relations of a person “Me and Others”, the study of the family upbringing as a factor that shapes the child’s meaningful spheres (Ilinyh, 2012), and the study of the dynamics of motivational and semantic formations in a student’s personality, etc.”
The study on non-linear dependences based on the author’s method (Basimov, 2009) was also tested in sociological studies varying in contents, i.e. sociology of a young family, demographic plans of the population, a psychological type of the respondent, sociology of professions, political sociology, etc.
In the modern world, the linear thinking, until now predominant in some areas of science, is becoming obviously insufficient and even dangerous in the non-linear, complex reality (Mainzer, 1994). Non-linear psychology is a new approach to the study of psychological systems whose main mission is the study of specific non-linear features (Knjazeva, Kurdyumov, 2005; Krylov, 2000) of psychological phenomena.
Acknowledgments
Preparation of the paper was supported by the grant of the Russian Foundation for Basic Research (RFBR), Project № 16-06-00273а.
References
- Basimov, M.M. (2009). Mathematical methods in psychological research (monograph). Russia, Kurgan: Kurgan State University.
- Basimov, M.M. (2017). Nonlinear psychology in specific examples (scientific and methodological manual). Kurgan affiliate of the RANEPA under the President of the Russian Federation.
- Basimova, P. (2016). Competitiveness as the reason Impulsiveness in non-linear psychology (Five-Factor Personality Model). International Journal of Psychology, 51, Supplement S1, 903.
- Basimova, P. (2016). Commitment to Principles in Pedagogic Activity (non-linear aspect). International Journal of Psychology, 51, Supplement S1, 789.
- Danilov, Yu.V. (2016). Nonlinearity. Introduction to Synergetics. http://spkurdyumov.ru/category/introduction.
- Ermolaev, O.Yu. (2011). Mathematical statistics for psychologists (textbook). Moscow: “Flinta”.
- Ilinyh, Y. (2012). Non-linear influence of severity on the lifemean orientations of the child. International Journal of Psychology, 47, Supplement 1, 261.
- Knjazeva, E.N., Kurdyumov S.P. (2005). Bas of synergetrics. Synergetic Worldseeing. Moscow: KomKniga.
- Krylov, V.Yu. (2000). Methodological and idealized problems of mathematical psychology. Moscow: Yanus-K.
- Mainzer, K. (1994). Thinking in Complexity. The Complex Dynamics of Matter, Mind, and Mankind. Berlin: Springer-Verlag.
- Padurina, E. (2012). Non-linear influence of the gnostic emotional orientations on parental feelings. International Journal of Psychology, 47, Supplement 1, 403.
- Rubtsova, N.E. (2002). Statistical Methods in Psychology: Proc. Allowance. Tver-Klin: Liliya Print.
Copyright information

This work is licensed under a Creative Commons Attribution-NonCommercial-NoDerivatives 4.0 International License.
About this article
Publication Date
17 December 2018
Article Doi
eBook ISBN
978-1-80296-049-5
Publisher
Future Academy
Volume
50
Print ISBN (optional)
-
Edition Number
1st Edition
Pages
1-1464
Subjects
Social sciences, modern society,innovation, social science and technology, organizational behaviour, organizational theory
Cite this article as:
Basimov, M. (2018). “Convenient” Correlational Errors In Modern Psychological Science (Mathematical Aspect). In I. B. Ardashkin, B. Vladimir Iosifovich, & N. V. Martyushev (Eds.), Research Paradigms Transformation in Social Sciences, vol 50. European Proceedings of Social and Behavioural Sciences (pp. 137-146). Future Academy. https://doi.org/10.15405/epsbs.2018.12.18

