The Developmental Changes In Number Sense Throughout The School-Age
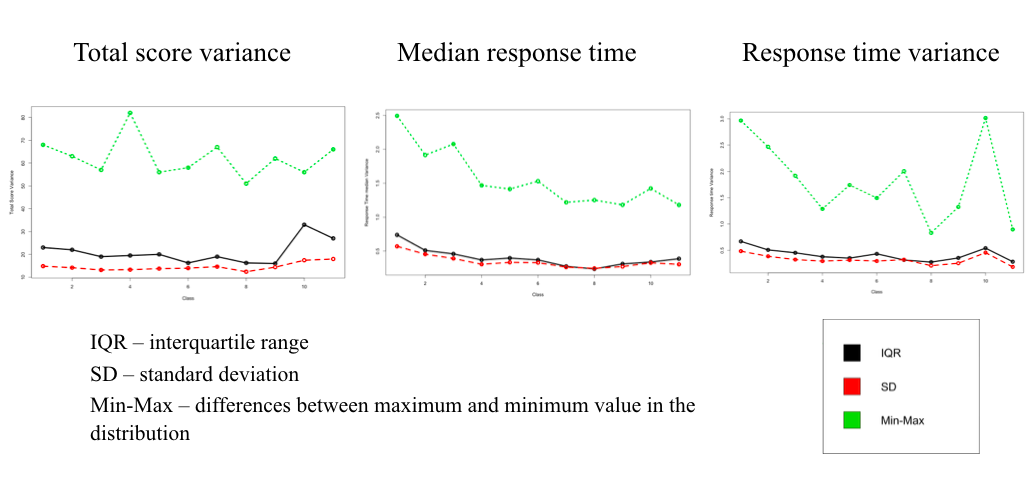
Figure 3: Class difference in total score variance, median response time and response time variance (from left to right). The x-axis is the number of grade. Green line - the difference between the maximum and minimum value within each grade, black line - the interquartile range, red line - standard deviation for each grade.