The Developmental Changes In Number Sense Throughout The School-Age
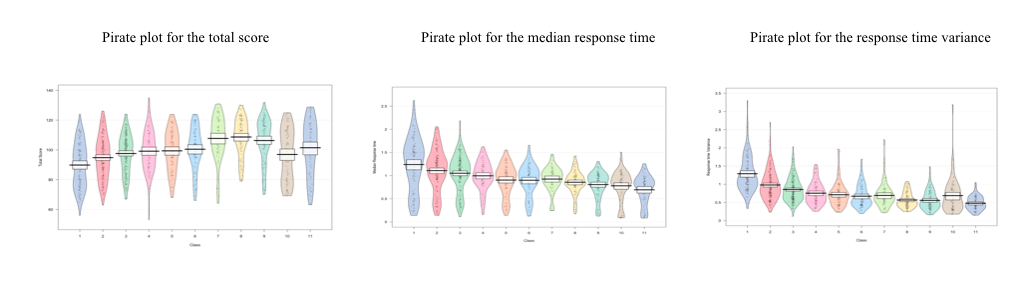
Figure 2: Pirate plots for total score, median response time, and response time variance (from left
to right). A pirate plot has 4 main elements: points, symbols representing the raw
data (jittered horizontally); bar, a vertical bar showing central tendencies (in the present
data the medians were calculated); bean, representing a smoothed density; and a rectangle
representing an 95% confidence inference interval.
< Back to article