
The Results Of The Research Of The Score-Rating Educational Results Of Students


Abstract
The article presents an internal assessment of the quality of educational results of students, based on the ongoing psychological and pedagogical study of the score-rating system, its organization and analysis. As a result of the use of score-rating system in the same educational groups, it was possible to increase its efficiency from 44% successfully passed the session in the first semester, 57% in the second semester, to 64% in the third semester. When analysing the results of the questionnaire on the use of score-rating system in the educational process and summarizing the overall results for all five groups of questions, 68% of students perceive score-rating system as a means of internal assessment of the quality of educational results, consider it an element of training that allows to systematically adjust the individual educational trajectory through self-assessment of its results; consider as an organizational component of a comprehensive approach with clear requirements and a schedule regulating educational activities.
Keywords: Score-rating systemteaching staffeducation
Introduction
Organization of psychological and pedagogical research of the effectiveness of the score-rating system (SRS) as a method of internal evaluation of the quality of educational results of students consists of several stages:
Theoretical analysis of the SRS, Generalized methodology (Dill, D. D., & Soo, M. 2005; Hazelkorn, E. 2007; Stolen, J. D., & Gnuschke, J. E. 1977)
Selection of criteria for evaluating the use of score-rating system, the development of a questionnaire for students to assess their attitude to the SRS (Dill, D. D., & Soo, M. 2005; Hazelkorn, E. 2007; Stolen, J. D., & Gnuschke, J. E. 1977; Vyzhigin, 2017).
Processing and generalization of the results of psychological and pedagogical research of SRS (Vyzhigin, 2016; Vyzhigin, 2017).
Problem Statement
This article is a continuation of the study of motivation and cooperation of innovative activity of teachers through the introduction of the educational process developed score-rating system of knowledge assessment as well as the organization and analysis of psychological and pedagogical research, point-rating system as a means of internal evaluation of the quality of educational results of students of higher education institutions.
Research Questions
One of the tasks not yet considered was to carry out statistical analysis of the results of psychological and pedagogical research of the SRS.
Purpose of the Study
To analyse and interpret the results of research of the SRS.
Research Methods
All the generalized data of the rating systems in the period from spring 2006 to spring 2016 are presented in table
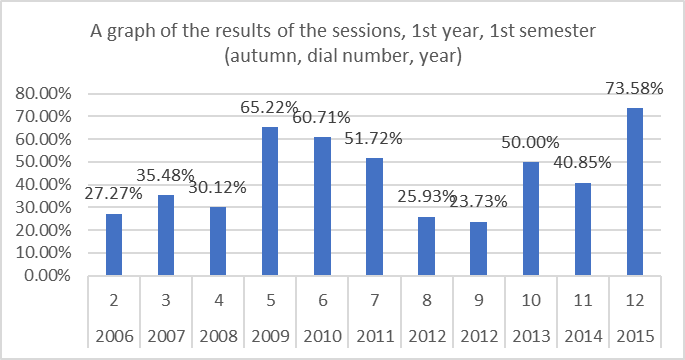
Over the past decade, the average number of students admitted to the test or examination has become 45-55%, of which about 80% received a positive assessment. In the application of the standard system of training, the percentage of students who passed the exam or set-off in the main session of the jam was within 20-40% of the total number of students in the group or stream.
It is proposed to analyse the results of using different variants of SRS.
Consider figure
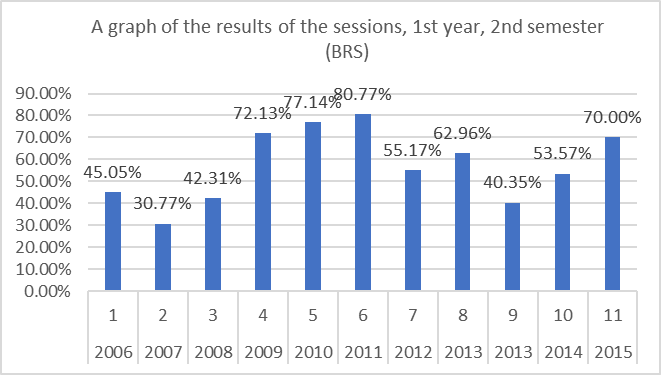
Consider figure
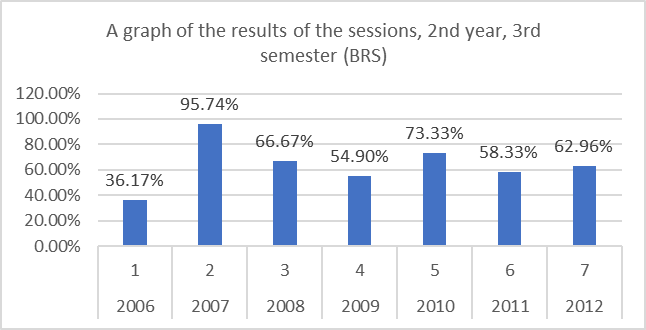
Consider figure
Generalized data on educational flows № № 1-12 the data of the score-rating system in the period from autumn 2006 to the present time are presented in table
Findings
Generalized data on educational flows № № 1-12 the data of the score-rating system in the period from autumn 2006 to the present time are presented in table
Analyzing table
To identify the significance of the results, the Student's t-test was applied. To calculate the t-criterion it was necessary to determine: n - the number of sample values (total number of groups in the sample), XSR the average number of students who passed the main session of students; S-standard deviation. Standard deviation is a measure of how widely data points are scattered about their mean; SSR is the standard deviation of the mean; t is the student's t-coefficient; and DI is the confidence interval calculated by multiplying the student's coefficient by the standard deviation of the mean; δ is the relative error of determination of
The statistical analysis of the results of the use of score-rating systems, depending on all sets of students, the results of the use of variants of score-rating systems for the first, second and third semesters of training.
For all variants, the student's t - coefficient was negative, which led to the conclusion that the empirical value was below the standard value, which can be taken as 100 per cent achievement in each study group.
Additional computational experiment showed that for the growth of the empirical value it is necessary to consider the probability value to be equal to 0.5 when calculating the results of t-student coefficient. This suggests that the confidence interval is reduced from 95 to 50%.
Conclusion
As a result of the use of BRS in the same educational groups, it was possible to increase its efficiency from 44% successfully passed the session in the first semester, 57% in the second semester, to 64% in the third semester.
When analyzing the results of the questionnaire on the use of the score-rating system in the educational process and summarizing the overall results, 68% of students perceive BRS as a means of internal evaluation of the quality of educational results and as an element of professional training. The use of the PRS allows you to systematically adjust individual educational trajectory due to the self-evaluation of its results; to consider it as an organizational component of the competence-based approach with clear requirements, schedule, and regulatory training activities.
References
- Dill, D. D., & Soo, M. (2005). Academic quality, league tables, and public policy: A cross-national analysis of university ranking systems. Higher education, 49(4), 495-533
- Hazelkorn, E. (2007). The impact of league tables and ranking systems on higher education decision making. Higher education management and policy, 19(2), 1-24
- Stolen, J. D., & Gnuschke, J. E. (1977). Reflections on alternative rating systems for university economics departments. Economic Inquiry, 15(2), 277-282.
- Vyzhigin, A. (2016). University STAFF: motivation of innovative activities. SHS Web of Conferences, 29, 02045. doi: 10.1051/shsconf/20162902045
- Vyzhigin, A. (2017). Organization and analysis of psychological and pedagogical research of the score-rating system as a means of internal evaluation of the quality of educational outcomes of students in higher education. The European Proceedings of Social & Behavioural Sciences EPSBS, 33, 472-481. doi: 10.15405/epsbs.2017.12.50
Copyright information

This work is licensed under a Creative Commons Attribution-NonCommercial-NoDerivatives 4.0 International License.
About this article
Publication Date
23 November 2018
Article Doi
eBook ISBN
978-1-80296-048-8
Publisher
Future Academy
Volume
49
Print ISBN (optional)
-
Edition Number
1st Edition
Pages
1-840
Subjects
Educational psychology, child psychology, developmental psychology, cognitive psychology
Cite this article as:
Vyzhigin, A. Y. (2018). The Results Of The Research Of The Score-Rating Educational Results Of Students. In S. Malykh, & E. Nikulchev (Eds.), Psychology and Education - ICPE 2018, vol 49. European Proceedings of Social and Behavioural Sciences (pp. 765-770). Future Academy. https://doi.org/10.15405/epsbs.2018.11.02.88