
Indicators Of Estimation Of The Stability Of Science And Education-Based Cluster Development


Abstract
The problem of ensuring of stable development of both the national economy as a whole and its industrial complex in particular is very relevant in today’s society and it should be taking into account in the design of educational programs. Only the system, which basic parameters of functioning are considered can be stable. This article examines the science-based cluster, having the following main indicators of stability: environmental security, economic security, technological independence, intellectual attractiveness and social stability. The article presents the technique of cluster stability estimation, presenting each of the listed indicators as a system of factors, characterizing the level of enterprise stability within the cluster. The application of the technique will enable to refer the investigated cluster enterprise to one of five possible stability classes, depending on the selected parameters. The following technique can be used for policy making in various areas including educational program design for cluster needs.
Keywords: Innovationsindicatorsustainable developmentscience-based cluster
Introduction
In modern conditions of globalization of the world economic space, the problem of ensuring sustainable development is relevant both at the global level and at the level of a certain enterprise or in the design of educational programs. However, there is still no generally recognized, clear, universal definition of "sustainable development" and the structure of the system of indicators of its assessment. Thus, the purpose of this paper is to clarify the definition of the concept of "sustainable development" in relation to an industrial cluster and to propose the technology for assessing the level of sustainability, taking into account the key characteristics of its functioning.
Speaking about the principles and tools of monitoring, it is important to analyze the existing system of statistical reporting in the country and highlight its features. It should be noted that commercial enterprises report to Rosstat, rendering more than 10 kinds of reports in the field of nature management, depending on an enterprise's profile. However, the website of the Federal State Statistics Service systematically releases to the public only the results of the cost-based approach to assessing the activities on a science-based or educational cluster.
The main criteria for selecting indicators in the system for assessing the level of sustainability within a cluster are:
importance and relevance of an indicator to ensure the sustainability of development;
possibility of quantitative expression;
understandability of the essence and content of an indicator;
availability of input data (statistics) to calculate an indicator;
reflection of the problems of the cluster level;
possibility of using at the sectoral and local level, while assessing the sustainability of science-based production.
So the problem of the assessment of cluster development should be done according to these criteria.
Problem Statement
The opinions of scientists on the essence of the notion of "sustainable development" are different: some define it as a model of the progressive development of mankind, in which the maximum satisfaction of the life needs of the present generation is achieved, without negative impact on future generations, while meeting their own needs; others as the achievement of maximization of long-term benefits for the society. The analysis of the existing normative documents and works by well-known scientists, determining the essence of sustainable development showed that there is no single approach (Table
Thus, development is considered sustainable if it is both aimed at the economic growth and balanced with the needs of the society to improve the quality of life and policies, aimed at preventing the environmental degradation.
For the first time, the problem of developing tools for assessing the sustainability of various systems development was considered in 1992 in the Global Program ‘Agenda is the XXI Century’, but Russia still lacks the comprehensive system of indicators, capable of assessing the level of stability of various elements of the national economy infrastructure. This article uses the term "indicator" as an instrument, capable of reflecting the development prospects of the examined system properly and being functionally significant at the same time. We propose to assess the level of sustainability of a science-based cluster development, using the system of indicators that estimate the level of environmental protection, economic security, technological independence, intellectual attractiveness and social stability. We will consider the essense of the indicator of environmental protection in detail, the remained ones will be briefly defined.
The indicator of economic security characterizes the most effective use of resources, which are necessary to prevent the unstable situation and ensure the balanced functioning and development of a science-based cluster. The indicator of technological independence characterizes the level of technological, production, technical, marketing potential. The indicator of intellectual attractiveness characterizes the presence and the level of intellectual potential of a company as a specific resource, which is actually a part of a company's capital, used by it in business and determines its competitive advantages. The indicator of social stability characterizes the level of providing the personnel potential of a cluster with the necessary conditions for high-performance and efficient work. Table
Thus, with respect to the five listed sustainability indicators, it is necessary to take into account that the highest degree of stability of a cluster operation is achieved if the entire system of indicators is within the established threshold values. In addition, it should be noted that the proposed system of indicators for assessing sustainability should not only state the fact of stability (in this case, the subjectivity of the assessment is inevitable), but also be used in forecasting of a cluster stability.
The main criteria for selecting indicators in the system for assessing the level of sustainability within a cluster are:
importance and relevance of an indicator to ensure the sustainability of development;
possibility of quantitative expression;
understandability of the essence and content of an indicator;
availability of input data (statistics) to calculate an indicator;
reflection of the problems of the cluster level;
possibility of using at the sectoral and local level, while assessing the sustainability of science-based production.
Each indicator is represented by a group of indicators, all of them are homogeneous and positive. Indicators must meet the following conditions:
data for the calculation of indicators should be taken from official documents;
indicators should be presented in the form of quantitative values;
the presence of threshold and reference values for each indicator, the intervals for assessing the level of stability correspond to the verbal-numerical Harrington scale;
comparability of indicators of the level of sustainability;
the ability to analyze indicators in dynamics;
simplicity and accessibility of the calculation technique.
The values of the factors within each indicator will vary from 0 to 1 according to the following rule: if the value of an indicator is in the stable state range (normal stability level), it is assigned rank 1; if an indicator is within the critical stability level - rank 0.5; if the crisis level of stability – rank 0. As indicators of the stability level tend to 1, it will determine the stability of an enterprise functioning in dynamics.
Summing up the ranks for each enterprise and dividing this amount by the number of indicators, we will determine the rating of each enterprise and refer this enterprise to one or another class on its basis (Table
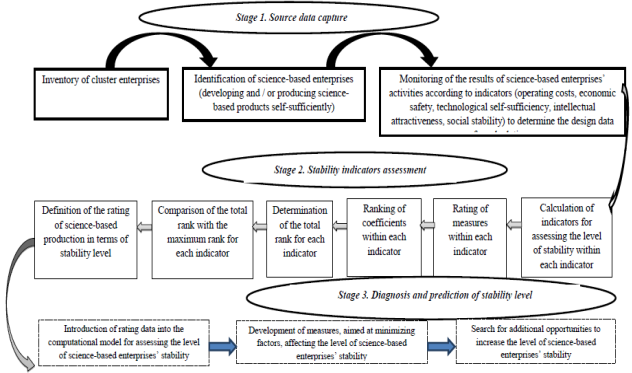
The algorithm, included in the method, proposed in the study is a series of successive steps and is depicted in Fig.
Research Questions
The research question is to develop a mathematical rule to assess the the level of science-based cluster stability what can be used in the decision making process, including educational program design
Purpose of the Study
To ensure the assessment of the level of science-based cluster stability it is very important to construct a decision rule that allows to refer one or another examined enterprise to one of the possible classes of stability.
Research Methods
This study uses discriminant analysis as a tool for construction of the stability assessment model.
Findings
From the methodological point of view, discriminant analysis provides two tools to solve the problem, set in this article: it allows to carry out the classification, using the distance function and provides the possibility to use the method of canonical functions, which constructs such function of observed quantities, which value indicates a certain class. Let us introduce the following designations:
– observed value of the coordinate (variable) i for the m-th observation in the s-th group, where the superscript s identifies the group or class, the first subscript i is the ordinal number of the coordinate or component of an observation, the second subscript m is the ordinal number of the observation in a group (object number);
– average value of variable i in the s-th group;
– average value of variable i in all groups;
– vector of average values in the s-th group;
– vector of average values in the whole observed population;
To apply the discriminant analysis correctly, it is necessary to take into account and fulfill the following compulsory conditions:
number of groups: g ≥ 2. In the available data this condition is observed, it is pointless to classify one group, as everything is clear without classification;
number of objects in each group: n(s) ≥ 2, s = 1, 2, …, g, this restriction is related to the need to calculate the sum of squares of deviations from the average within each class (in fact, this is a correct possibility to calculate intragroup dispersions);
number of discriminant variables: 1 ≤ p < n – 2, this restriction is related to the calculation of intragroup variances and the use of the Fisher criterion to compare dispersions;
discriminant variables are measured in an interval scale;
discriminant variables are linearly independent (the hypothesis will be tested during the research);
covariance matrices of the groups are approximately equal (the hypothesis will also be checked during the research);
discriminant variables in each group are subject to a multidimensional normal distribution law.
Let us first estimate the information, characterizing the degree of difference between objects over the entire space of points determined by group variables. To do this, we calculate the total scattering matrix T (accurate to a multiplier – this is the covariance matrix of observations), which is equal to the sum of squares of deviations and pairwise products of observations from the total averages , i = 1, 2, …, p for each observed variable. The elements of the matrix T are determined by the expression (1):
, (1)
where
– intragroup average i are components of the observation vector:
– general average i are components of the observation vector.
Combining observations of all objects (enterprises), belonging to one class or group, we obtain observation matrices for each group (2):
(2)
Degrees of these matrices are the following - the number of rows is equal to the number of observed variables (constantly within the model), and the number of columns is equal to the number of (observed) objects, classified as:
To measure the degree of dispersion of objects within individual groups, we consider intragroup scattering matrices that differ from the general scattering matrix T, as its elements are determined by observations in separate groups rather than by average vector for common data. Matrices of intragroup scattering are determined by expressions (3):
. (3)
If we divide the scattering matrix , , we will obtain the covariance matrix of the observation results for each of the classes. The main diagonal will contain dispersions of the coordinates of observations, off-diagonal elements - covariance of the corresponding coordinates of observations within the class.
The weighted sum of intragroup scattering matrices (4):
(4)
If we divide each element of the matrix W into (n–g), we will obtain the estimate of the covariance matrix of the intragroup data.
There is one more sum of squares, associated with the partition of the observed population into classes - the intragroup sum of squares (5):
. (5)
Thus, the general dispersion matrix (2) measures both the systematic variation (the belonging of the observation to one or another class) and the random variation, caused by uncontrolled factors. Intragroup scattering matrices (3) measure only random variation if the classification in one class or another is true. The weighted sum of intragroup scattering matrices (4) measures the average random variation in all groups. The intragroup scattering matrix (5) measures the systematic variation between classes.
Conclusion
In the paper we tried to answer a question of development a mathematical rule to assess the level of science-based cluster stability what can be used in the decision making process, including educational program design. We proposed a method for the problem outlined based on discriminant analysis. It can be used in various procedures of decision making including the educational policies.
Acknowledgments
The article was prepared within the project-winner of Vladimir Potanin Scholarship Grant Competition 2016/2017.
References
- Bobylev, S.N. (2011). Sustainable Development: Methodology and Measurement Techniques: Teaching Guide. M: Economics
- Bruntland, G. (1988). Our General Future: The report of the United Nations World Commission on Environment and Development 1987. М.: Progress, 1988.
- Chursin, A.A, Kashirin, A.I., Strenalyuk, V.V., Semenov, A.S., Ostrovskaya A.A., and Kokuytseva T.V. (2018). The approach to detection and application of the company's technological competences to form a business-model. IOP Conference Series Materials Science and Engineering, 312, 012003. https://doi.org/10.1088/1757-899X/312/1/012003
- Chursin, A.A., Shamin, R.V. and Fedorova, L.A. (2017). The Mathematical Model of the Law on the Correlation of Unique Competencies with the Emergence of New Consumer Markets, European Research Studies Journal, 0(3A), 39-56. https://ideas.repec.org/a/ers/journl/vxxy2017i3ap39-56.html
- Kashirin A.I., Semenov A.S. (2007). Venture investing in Russia. M: Vershina.
- Rodionov I.I., Semenov A.S. (2013). Enterpreneurial Finances. M: Aleteya, 2013.
- Zayganova, М. (2007). Genesis of Sustainable Development Concept. In V.А. Plotnikov, and Т.Yu. Feofilova (Eds.), Social and Economic Systems: Issues of State Regulation and Management: Processings. Issue 2. St.Petersburg: Publishing House GPA, 2007.
Copyright information

This work is licensed under a Creative Commons Attribution-NonCommercial-NoDerivatives 4.0 International License.
About this article
Publication Date
23 November 2018
Article Doi
eBook ISBN
978-1-80296-048-8
Publisher
Future Academy
Volume
49
Print ISBN (optional)
-
Edition Number
1st Edition
Pages
1-840
Subjects
Educational psychology, child psychology, developmental psychology, cognitive psychology
Cite this article as:
Fedorova, L. A. (2018). Indicators Of Estimation Of The Stability Of Science And Education-Based Cluster Development. In S. Malykh, & E. Nikulchev (Eds.), Psychology and Education - ICPE 2018, vol 49. European Proceedings of Social and Behavioural Sciences (pp. 229-237). Future Academy. https://doi.org/10.15405/epsbs.2018.11.02.25